|
|
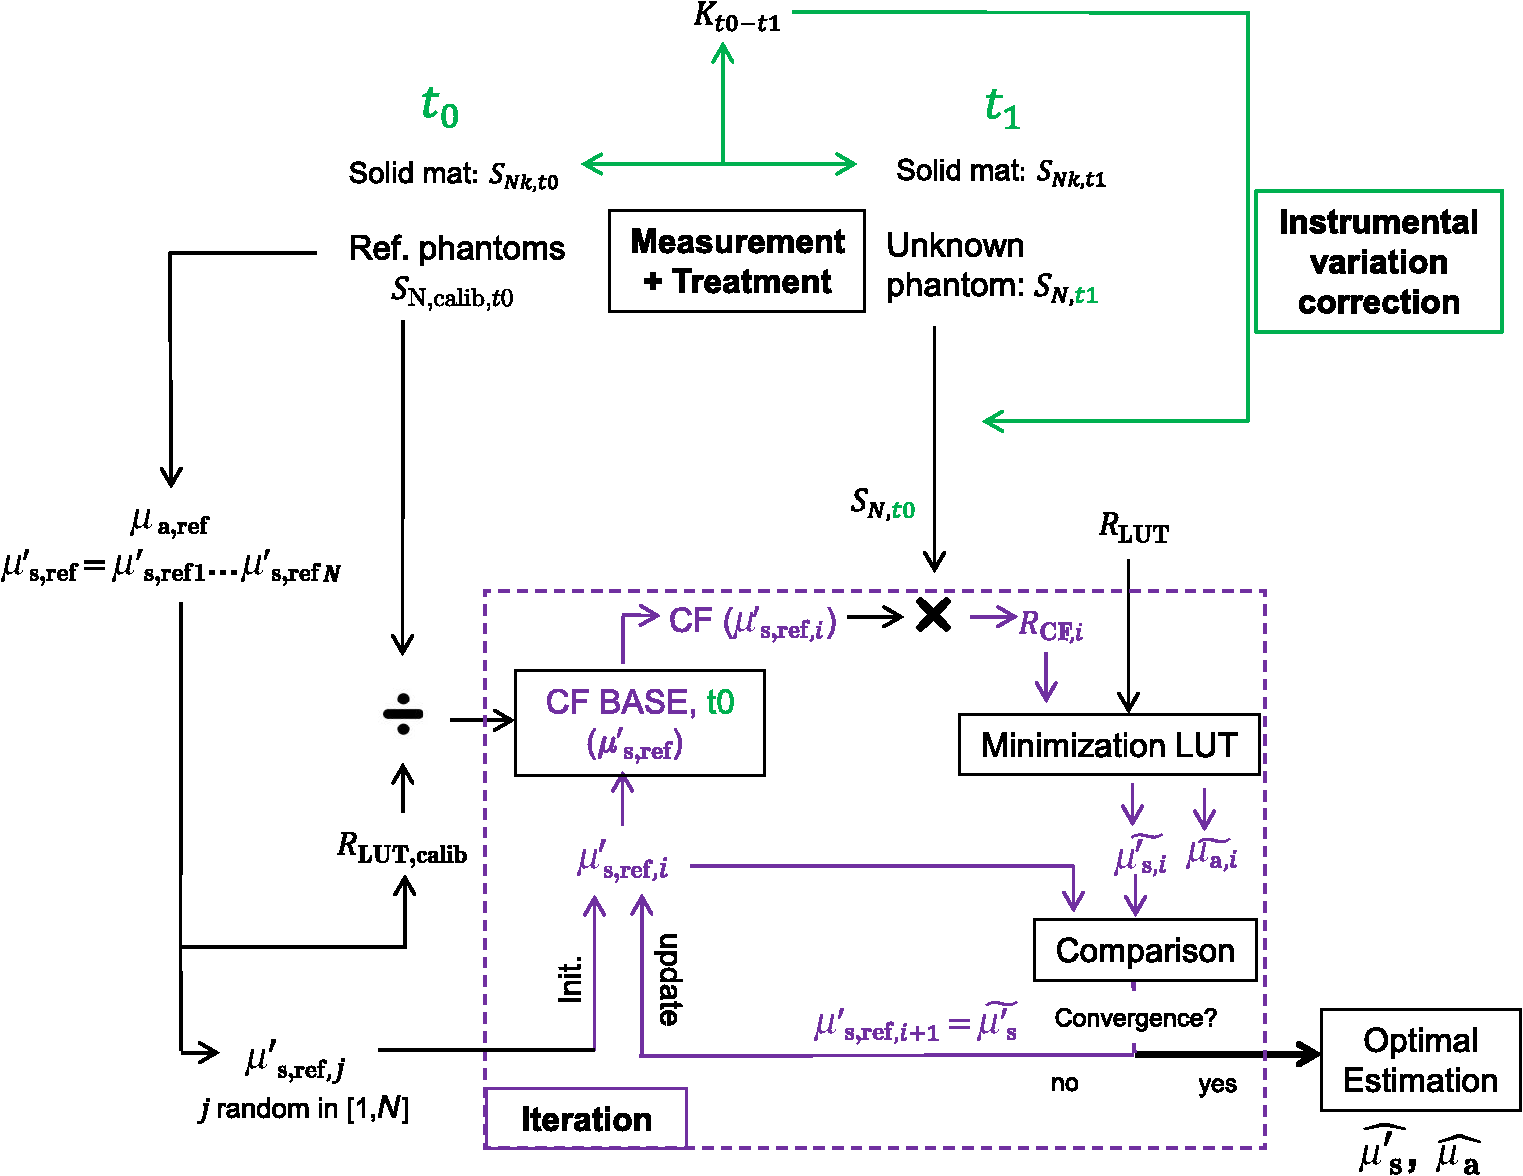
1.IntroductionSpatially resolved diffuse reflectance spectroscopy (DRSsr) is an optical spectroscopic technique that provides quantitative estimations of optical properties from measurements of diffuse reflectance at multiple source-detector (SD) distances. To obtain absolute quantitative estimations of absorption and scattering properties, many research groups rely on the instrumental calibration through phantom measurements. This calibration considers the various instrumental responses, detector geometry, and measurement modalities (contact or noncontact). Thus, it is possible to solve the inverse problem in which the calibrated reflectance measurements are compared to the theoretical reflectance of the forward model. The forward model is established by the radiative transfer equation (RTE) which is approximated by an analytical diffusion model or numerically solved by a Monte Carlo simulation. Results of both procedures can be saved under a look-up-table (LUT). Alternatively, the forward model and the instrumental calibration can be combined in an LUT built beforehand with reflectance measurements of a comprehensive set of characterized phantoms and used for direct comparison with further experimental measurements. A first group used the diffusion approximation at several SD distances and calibrated the instrumental (noncontact hyperspectral CCD detector) effect through a single intralipid phantom measurement.1 The average estimation errors obtained are 7% for the reduced scattering coefficient and 12% for the absorption coefficient, , being higher for those further away from the calibration phantom. Another group used multiple phantoms (made of polystyrene beads and bovine blood) to deduce two empirical factors and .2 These factors were integrated in the modified diffusion equation to obtain a semianalytical model of the diffuse reflectance. Factors and depend not only on the geometry of the probe and the refractive indices of the medium, but also on the optical properties of the calibration phantom. Therefore, for a wider range of optical properties, the accuracy of the solution with a single pair is deteriorated. This was verified through a comparison with Monte Carlo simulations and modeling of and as a function of the absorption and scattering coefficients.3 To overcome this, an extensive phantom study and additional parameters are necessary which increases the number of fixed variables and influence estimation accuracy. Moreover, this semianalytical model is limited to samples having hemoglobin as the only chromophore. This model has been used together with multiple calibration phantoms to fit measurements and derive scattering and hemoglobin concentration parameters with a noncontact DRSsr system.4 The estimation errors are less than 5% for reduced scattering coefficient and 10% for hemoglobin concentration. The accuracy of estimations is bound to the limitations of the diffusion approximation (see Sec. 4.1). On the other hand, many groups use a Monte Carlo simulation as a forward model. For instance, with a single calibration phantom measurement at a single SD distance and an iterative estimation update, optical properties estimation errors lower than 12%, for a large range of absorption properties, have been achieved.5 A big advantage of this work is that the Monte Carlo simulation is not individual for a specific contact probe geometry. Noncontact hyperspectral CCD measurements have been calibrated with a single reference intralipid phantom achieving errors for and for but only for a low to moderate absorption range.6 In contrasting, using multiple phantoms for calibration of measurements acquired at several SD distances of a contact probe achieved errors smaller than 10% both for and in a low to moderate absorption range.7 A recent study8 developed a two-layered Monte Carlo simulation and considered a single SD distance of a contact probe. A general calibration factor, obtained through the minimization of the difference between simulated and measured reflectances of 28 phantoms with different optical properties, is used to correct measurements from the instrumental effect. The results, obtained after an iterative update, show high correlation of estimated melanin with a commercial skin-melanin probe (Pearson coefficient of 0.97) and higher sensitivity to blood oxygenation than the commercial Mexameter instrument. Other groups avoid the use of analytical diffusion models, which are not valid for short SD distances and highly absorbing media, or Monte Carlo simulations, which are complex and require long computing times. They achieve this by considering the forward model to be an LUT built with experimental measurements of phantoms in which the instrumental calibration is already integrated. For instance, one study9 considered a matrix of 24 phantoms with varying optical properties and made of polystyrene spheres and diluted ink. The average estimation errors achieved were for and for . The same methodology was used for a noncontact probe,10 obtaining an average error of 5.1% for and 8.3% for . The merit of this experimental inverse-model technique is that it achieves good estimation accuracy which might, however, be vulnerable to the accumulation of experimental noise. Moreover, it is limited by the constrained range of optical properties considered and the number of phantoms that need to be produced and measured. In this work, we develop an adaptive calibration algorithm and protocol (ACA-Pro) that allows optical properties estimation with measurements taken with different DRSsr setups under contact and noncontact modalities and a single Monte Carlo-based LUT under contact conditions. Out of all the studied research groups,5 it is the only one that develops a similar calibration procedure providing flexibility for different contact probe geometries. However, the noncontact measurement modality is not taken into account. The ACA-Pro algorithm we propose is a -based two-step calibration approach. The first step makes use of a reference base built with measurements of a few reference intralipid phantoms covering a large range of reduced scattering coefficients proper to biological tissues. The second step integrates an interpolation strategy to reduce the number of reference intralipid phantoms needed to build the reference base. In addition, we extend the calibration capacity of ACA-Pro to the correction of experimental variations that are common between measurements taken at different time periods and degrade the estimation of optical properties. The approach relies on the single measurement of a common optically stable solid material that characterizes individual experimental conditions. With this, all measurements are adapted to the experimental conditions of a unique reference base. One of the new advantages of this strategy involves the exemption of manufacturing, for each experiment, the various reference intralipid liquid phantoms, subject to temporal optical instability and tedious handling. This paper describes the ACA-Pro algorithm and its validation on a well-established contact DRSsr system11 and an extended noncontact DRSsr system with the same measuring probe and an integrated achromatic doublet pair that creates an image on the sample and the probe detector planes. Moreover, the first conclusive results on an additional noncontact setup in which the probe is replaced by a CCD detector are given and discussed. The major interest of noncontact imaging systems is that they are of particular value for medical applications requiring completely noninvasive and sterile measurement techniques. We first define the intralipid phantoms used for the measurements in Sec. 2, and each experimental DRSsr setup and measurement protocol in Sec. 3. We analyze the different instrumental effects to outline the appropriate signal treatment in Sec. 4. Thereupon, the required signal calibration is performed with the developed ACA-Pro algorithm (described in Sec. 5) to enable optical properties estimation with all DRSsr setups (shown in Sec. 6). Finally, we conclude in Sec. 7. 2.Intralipid PhantomsThe use of phantoms with similar properties to those of skin tissue is common to calibrate optical instruments as well as to validate the forward and inverse models. The homogeneous liquid phantoms we used as turbid media consist of an aqueous solution of distilled water with different concentrations of fat emulsion scatterer Intralipid® 20% (manufactured by FRESENIUS-KABI) to control scattering properties and black “Rotring” ink or blue “Gubra” pigment to control absorption properties. The absorption coefficient of phantoms is measured with a spectrophotometer on the aqueous ink/pigment solution before incorporating the scatterer. The expected reduced scattering coefficient is determined according to the Mie theory and the relationship between the percentage of Intralipid and anisotropy coefficient .12 Along this paper and for simplification purposes, we refer to to describe the scattering properties of phantoms and values are given at 600 nm. Measured and calculated coefficients (see Fig. 1) are used as the theoretical standard in the evaluation of the optical properties estimation accuracy. The chosen range of optical properties of the phantoms include that typical of biological tissue.13 The reduced scattering coefficient range lies between 6.8 and at 600 nm and is obtained with ranging between 0.5% and 3%. The absorption coefficient range is chosen to be between 0.2 and at 600 nm to lie close to the absorption signature of skin, generated by the contribution of oxy- and deoxyhemoglobin, melanin, and bilirubin.14,15 3.Experimental Setups3.1.Contact Spatially Resolved Diffuse Reflectance SpectroscopyFigure 2 schematically illustrates the well-established contact DRSsr setup and the distal end of the probe used.11 A tungsten halogen (T–H) Lamp (HL2000 Ocean Optics) is used as the source, and a QE65000 (Ocean Optics) is used as the spectrometer detector (cooled down to to reduce dark noise). The spectral working range of the instrument lies between 470 and 880 nm which is appropriate to address superficial signals originating at less than a few millimeters deep. The probe features a central illumination fiber and concentric detection fibers at six different distances ranging from 300 to (center-to-center). These distances are adapted to separate and thereby quantify absorption and scattering effects in the visible spectrum. Indeed, it is known that diffuse reflectance signals close and far from the light source have different sensitivities to the medium’s optical properties. For instance, at distances smaller than one transport length, , reflectance strongly depends on the scattering properties, phase function, and anisotropy factor and is less affected by absorption. On the contrary, larger distances () measure a reflectance that has a high dependence on absorption and minimal dependence on scattering effects.16–18 The detection fiber rings are referred to as , with and being the closest () and furthest () ring to the source, respectively (see Fig. 2). Correspondingly, the diffused reflectance signals measured by the fibers are referred to as . The core diameter of the central excitation fiber () and that of each detection fiber is 500 and , respectively. Fig. 2Contact probe DRSsr setup with detailed illustration of the distal end of the measuring probe. 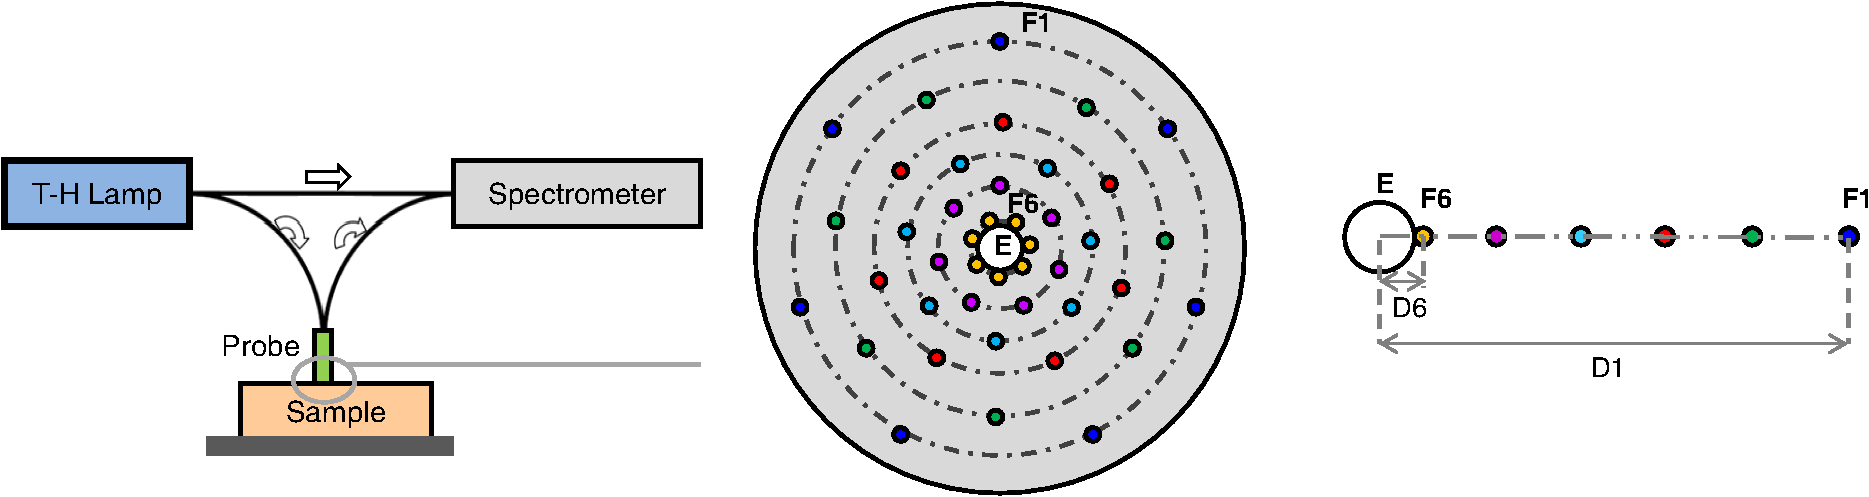 Measurements are taken by placing the probe in contact with the sample under constant ambient darkness conditions. The setup allows the measurement of the source signal just after measurements to control the slight signal intensity and spectral variability. Integration time of each signal ( and ) is adapted to the dynamic range of the spectrometer. 3.2.Parallel Noncontact Probe-Based Spatially Resolved Diffuse Reflectance SpectroscopyCompared to the contact DRSsr modality, the noncontact DRSsr modality considers different clinical interests. For instance, noncontact measurements of sensitive samples such as injured or infected tissues are completely noninvasive and, therefore, sterile. Moreover, the noncontact measurement modality is not affected by the coupling variations which arise from the fluctuation of pressure exerted on the sample by the contact probe and directly influence the estimation of optical properties.19 In addition, the use of optics in a noncontact setup provides higher flexibility in the choice of geometrical dimensions of the projected illumination beam and detection areas of the resulting reflectance. We built a noncontact DRSsr setup by placing an achromatic doublet pair between the measuring probe (see Fig. 2) and the sample as shown in Fig. 3. The focal distance of the doublets is chosen to be the same to guarantee magnification equal to 1 at a convenient distance of 100 mm. The doublet pair has an antireflection coating that ensures optimal transmission between 400 and 700 nm. Parasite reflections consequently arise after 700 nm and should be measured as explained in Sec. 4.2.1. Focusing on the phantom is achieved in two steps. In the first step, the height of the adjustable support is accommodated to a visually acceptable first focusing range. In the second step, is used since it is a direct measurement of the signal close to the borders of the projected illumination source point that decrease at the focal plane. Consequently, the height obtaining a minimal within the first focusing range is determined to be the methodical focal plane. All phantoms are placed at this focal plane using the same container and keeping the phantom’s volume constant. Diffused reflectance, parasite reflections, and offset are measured under the same ambient darkness conditions. 3.3.Folded Noncontact CCD-Based Spatially Resolved Diffuse Reflectance SpectroscopyTo further test the calibration algorithm, we built a CCD-based DRSsr setup. The use of a CCD as detector (replacing the probe and spectrometer) requires the separation of the illumination and detection paths. To do so, we use a beamsplitter that ensures an orthogonal projection of the illumination orthogonal on the sample’s surface, as shown in Fig. 4. Two achromatic doublets establish a diameter of the projected illumination point. Fig. 4Folded noncontact CCD-based DRSsr setup with separated detection and illumination paths with an additional filter support for spectral scanning.  Once this architecture was validated with a probe detector, we replaced it with a 12-bit monochrome PixelFly VGA CCD and fixed a filter between a collimator just after the source, as shown in Fig. 4. Since this work aims for a proof of concept, we consider only four different Thorlabs band-pass filters (): 450, 550, 650, and 750 nm. Focusing is achieved through video-mode for each filtered light. To allow measurement of the diffused reflectance decay up to 2.49 mm () with the constrained dynamic range of the CCD, several acquisition times, , adapted to a specific signal intensity, are used (see Fig. 5). We consider the effect of pixel blooming around the saturated zones of the image to be negligible after having checked signal linearity at all detectable distances. Each integration time determines a detectable area in the image with a nonsaturated gray level value higher than the limit of detection, being three times the offset’s standard deviation. Fig. 5Adaptive integration time needed to recover the complete reflectance decay with the limited CCD dynamic range.  All measurements are taken under constant ambient darkness. Background images are acquired with no light source for some acquisition times, . Average values of each background image are used to obtain the linear offset- curve which is interpolated for all other s. Detectable areas of all phantom images are corrected from the background at their corresponding acquisition time and then combined to construct the reflectance decay (see Fig. 5). 4.Method4.1.Monte Carlo SimulationA home-made Monte Carlo simulation in MATLAB® has been used to precompute an LUT, used as a numerical solution of the RTE because, contrary to the diffusion approximation, it is valid for the highly absorbing phantoms we use and at the close detection distance from the source. The simulation describes photons reaching the medium’s surface through the excitation fiber (with a numerical aperture of 0.22), traveling through the semi-infinite medium, and measured back at the surface at different SD distances from the source (F6–F1), under contact conditions (see Fig. 6). Therefore, the instrumental effect of the achromatic doublet (present in the noncontact modality) is not considered. Photons start with an initial weight and are injected perpendicularly to the sample’s surface. Absorption events of photons are considered through a cumulative function that decreases the photon’s weight. Scattering events deviate photons by an elementary step and by an angle calculated with the Henyey–Greenstein function. Fig. 6Illustration of the illumination profile and reflectance detection according to the Monte Carlo simulation conditions.  The geometrical features of the illumination and detection correspond to the DRSsr probe shown in Fig. 2. The range of optical properties considered in the simulated medium is and covering that of all evaluated phantoms. A constant anisotropy factor throughout the spectrum is used and its wavelength dependence is considered in a following scaling procedure. The refraction index of the refractive medium is set to 1.37, which is characteristic of skin.20 The refraction index of the incident medium is set to that of silica (main material of the fibers’ core) and equal to 1.45. The resulting simulated reflectance is saved under an LUT which is used for comparison and data fitting with the measured and normalized reflectance [see Eq. (2)]. 4.2.Signal TreatmentThe existing method that treats to derive the estimation of optical properties is based on the instrumental calibration with a normalized reflectance of a single reference phantom for which the optical properties are known. and are obtained through Eq. 2 by scaling reflectance measurements and of unknown and reference phantoms, respectively, from the source signal [calculated with Eq. (1)] and acquisition time (proper to each signal) and by subtracting the additive signal (measured at the same ) which includes instrumental offset and parasite reflections (see Sec. 4.2.1). Thus, a calibration factor (CF) is calculated as the ratio of the simulated reflectance of the reference phantom and [see Eq. (3)], for each wavelength and distance. Normalized reflectance (at each distance) of unknown phantoms is corrected with CF according to The resulting corrected reflectance is then fitted to with a least-squared minimization that estimates the unknown optical properties. This method is valid only if the measured reflectance signals and are taken under the same conditions of ambient light and instrumental configuration. Only then it is possible to compensate for additive effects through Eq. (2) (Sec. 4.2.1) and constant multiplicative effects through a single CF calculated through Eq. (3) (Sec. 4.2.2). However, in a noncontact setup, the method is unable to make up for the modification of the illumination beam profile (Sec. 4.2.3) which depends on the noncontact architecture and influences the measured reflectance depending on the optical properties of the sample. Since further distances from the source are most sensitive to the absorption of photons in the medium, is estimated with further fibers . On the contrary, scattering sensitivity is highest at short distances from the source justifying the selection of for estimation. In the noncontact DRSsr setups, is strongly illuminated by the profile extension and cannot be used for optical properties estimation (see Sec. 4.2.3). 4.2.1.Additive effect: parasite reflections of doublet pairAdditive parasite reflections pollute in the case of the parallel noncontact probe setup (see Fig. 3), in which both the illumination and detection signals go through the doublet pair. They originate after 700 nm because the antireflection coating of the chosen doublet pair (400 to 700 nm) does not cover the whole working spectral range (470 to 880 nm). A simple measurement of these parasite reflections consists of placing no sample at the object plane. A black cloth far from the focal plane is used to fully absorb the illumination signal that goes through the system. By doing so, only the parasite reflection of the source on the doublets is measured by the detection fibers and then subtracted from for correction through Eq. (2). 4.2.2.Constant multiplicative effect: optical transfer functionThe constant multiplicative modification of the diffused reflectance signal by the various components in the noncontact setups is described by their optical transfer function (OTF). The spectral OTF is directly measured by placing the illumination signal at the image plane and comparing it to the signal reaching the object plane, or vice versa. We correct measured signals by dividing them by the OTF. We verified that OTF-corrected and uncorrected and calculate the same optical properties (data not shown). This proves the method’s robustness regarding constant multiplicative modification. Thus, the measurement of the OTF is not required and is not used in the signal treatment. 4.2.3.Effect of the projected illumination beam profileThe plate doublets and beamsplitter (depending on the noncontact DRSsr setup) induce optical aberrations that degrade the projection of the illumination point on the sample, shown in Fig. 7. Indeed, it is seen that is greatly affected by the intense specular reflection of the inaccurate point borders that are not considered in the contact Monte Carlo simulation (Sec. 4.1). After having confirmed the capacity of the contact probe DRSsr system to resolve optical properties without the signal (measured by ), it was decided not to use it for the noncontact DRSsr systems. The rest of the fibers measure a combined diffused reflectance signal resulting from the modeled central illumination and the nonmodeled optical aberrations of the projected point which include the extended point borders and, in the case of the folded illumination setup (Fig. 4), the parasite reflections provoked by the beamsplitter. Fig. 7Illumination profiles of all DRSsr setups: contact DRSsr (Fig. 2), parallel noncontact (NC) DRSsr (Fig. 3), folded noncontact (NC) DRSsr without and with a 650-nm filter (Fig. 4).  It is seen that the influence of the nonmodeled signal is strongest for the closest distances and negligible for further ones. Considering that the closest fibers are the most sensitive to and the furthest to ,16–18 it is possible to differentiate with no illumination profile correction only if both the reference and unknown phantoms have the same , meaning that the overall instrumental effect can be calibrated through the multiplicative correction of Eq. (3). Adversely, when the phantoms have different , the nonmodeled signal on the closest fibers will vary and with it the required multiplicative correction. In this case, the correction of the illumination profile is crucial for the appropriate optical properties estimation. In other words, for the noncontact DRSsr setups, correction of the nonmodeled signal is mainly related to . A possible correction strategy consists of considering the noncontact projected illumination beam profile in the Monte Carlo simulations as it is done in Ref. 21. An alternative solution considers a calibration approach. We opted for a dichotomic calibration algorithm described in Sec. 5. 5.Adaptive Calibration AlgorithmThe developed adaptive calibration algorithm (ACA-Pro) takes advantage of the fact that the actual technique is robust in the estimation of an unknown phantom when its is equivalent to that of the reference phantom. Yet, a difference between reference and unknown phantoms provokes an unacceptable error in the estimation of . In other words, the CF between measurement and simulation [Eq. (3)] changes with the scattering difference. This is mostly recognizable in noncontact measurements since we use a Monte Carlo simulation under contact conditions. The key characteristic of ACA-Pro lies in the selection of the best CF, inside a studied range, for any unknown . For this purpose, CFs are precomputed with several corresponding to a set of reference phantoms having a range of different reference reduced scattering coefficients . These CFs, computed for individual wavelengths and for signals , that are used for optical properties estimation (see Sec. 4.2.3), constitute the CF reference base set. The characterization of an unknown phantom with its normalized reflectance follows a first estimation step and, if required, a supplementary interpolation step (Sec. 5.1). Using the CF reference base set calculated for several , a set of possible unknown is computed. In the first step, an error minimization between and leads to the choice of the correction factor . If estimates a approximating to a specific , and complementary are considered to be the optimally estimated unknown optical properties and . Thus, is considered to be the optimal calibration factor . The calibration is performed individually for each and signal. A faster implementation of ACA-Pro in the selection of is achieved through a dichotomic method, which initially makes use of a single (not the whole set) random and corresponding to determine . Through an error minimization between and all , a estimating and is rapidly chosen. 5.1.InterpolationIf estimates which lies between two neighboring , an interpolation step follows. Neighboring are used to define an interpolated correction factor for each and . This final correction factor obtains the optimal estimation of both optical properties and . 5.2.Correction of Instrumental VariationsFor the optimal performance of ACA-Pro the measurement of a CF reference base set should be taken under the same conditions of the unknown phantom measurements. Thus, a CF reference base appropriate to each experiment is needed. Since the optical properties of intralipid liquid phantoms depend on the temperature,22 the water quality, and the Intralipid emulsifier, and further mutate after some time23 through processes such as cream formation,24 experiments outside this time period () require the manufacturing of new fresh phantoms. To allow a faster and less burdensome instrumental calibration between different experiments, a new calibration step has been determined. The latter makes use of a single measurement of a common material that is taken for each experiment and characterizes individual experiment conditions. For this, it is important to guarantee spatially homogeneous and constant optical properties of the material over indefinite time periods separating experiments. Homogeneous liquids should, therefore, be fresh and manufactured in the same way for each experiment. An attractive alternative is the use of homogeneous solid materials with negligible surface variations and temporal optical stability. The advantages of solid materials is that they do not pose the problems related to liquid phantoms including tedious and constant fabrication, short-term conservation at low temperatures, and demanding manipulation. However, because the optical properties of solid materials are not easily characterized, they cannot be used to directly build the CF reference base. Therefore, liquid phantoms are manufactured and measured only once to build a single CF reference base and a measurement of a solid material taken at each experiment is used to compensate for experimental variations. The calibration is performed by calculating the ratio between the normalized signal of the solid material [calculated with Eq. (5)] obtained at a specific experiment or moment , and that obtained for a second experiment or moment [see Eq. (6)]. Hence, the unknown phantom reflectance at () is adapted to the original instrumental conditions of the single CF reference base built with measurements at . The corresponding signal at () is obtained through the correction with the ratio [see Eq. (7)]. The flowchart of Fig. 8 and the results shown in Sec. 6 facilitate the understanding of ACA-Pro’s performance in the method for optical properties estimation. 6.Results and Discussion6.1.Calibration Factor Reference BaseWe built a comprehensive CF six-reference base with six-reference phantoms having common at 600 nm and different corresponding to , 1%, 1.5%, 2%, 2.5%, and 3%. The CF six-reference base shows the variability of the relationship between Monte Carlo simulated and measured reflectance of phantoms having different scattering properties. Figure 9 shows examples of the CF six-reference base obtained with the contact (Fig. 2) and parallel noncontact (Fig. 3) probe DRSs, respectively, for , some wavelengths , and with two different measurement sets and . All CFs are normalized with respect to a common CF at . Ideally, if no calibration were necessary, all normalized CF should be equal to 1. It is, therefore, not surprising that because of the smaller difference between measured and simulated reflectance, normalized contact CFs are closer to 1 than noncontact CFs. The high difference of contact M1 and M2 at (mostly seen for ) is probably related to the limited accuracy of the Monte Carlo simulation at such a low scattering value. This will be analyzed in future work. Fig. 9CF six-reference base for contact and parallel noncontact probe-based DRSsr setups measured twice (M1 and M2).  Moreover, notice that noncontact CFs tend to be slightly more repeatable than those measured with contact DRSsr. This can be explained by the higher difference between simulated and the noncontact measurements that render experimental noise negligible. Contrastingly, the smaller difference between contact reflectance measurements and accords a more significant role to the experimental noise. Moreover, contact measurements are affected by the higher dynamic changes of the intralipid phantom, induced by the positioning of the probe. This is not the case for the noncontact measurement modality. 6.2.Estimation of Optical Properties with the Calibration Factor Reference BaseThe interest of ACA-Pro with the CF six-reference base set is shown for an unknown phantom having theoretical properties and at 600 nm. Optical properties and are estimated with all CF from the different () of the CF six-reference base. The estimated scattering and absorption properties obtained with the contact and the parallel noncontact probe-based DRSsr setups are shown in Fig. 10. Fig. 10Estimation of optical properties of an unknown phantom ( and at 600 nm) with the CF six-reference base for each DRSsr setup. (a) Contact probe DRSsr estimation. (b) Contact probe DRSsr estimation. (c) Parallel noncontact probe DRSsr estimation. (d) Parallel noncontact probe DRSsr estimation.  When looking at the estimated with all [see Figs. 10(a) and 10(c)], it is clear that most of them are closest to the curve proper of (dotted violet curve) because . Not surprisingly, when comparing all separately, the estimated with (circle-violet curve) is the nearest to . The algorithm, therefore, chooses as . In terms of absorption [see Figs. 10(b) and 10(d)], estimated with (circle-violet curve) obtains the minimal error with respect to (dotted-black curve). This is consistent with both DRSsr setups, which validates the new ACA-Pro algorithm. Figure 11 summarizes the average percentage error of optical properties estimations of Fig. 10. The average relative error throughout the spectrum is calculated for each and with corresponding (determining ) and , respectively. The errors give a general idea of the ACA-Pro performance and confirm that minimal errors are achieved with for all setups. Table 1 displays these minimal errors. Table 1Average relative percentage errors achieved with CF^.
Fig. 11Average relative percentage errors over the working spectrum of optical properties estimation with each . 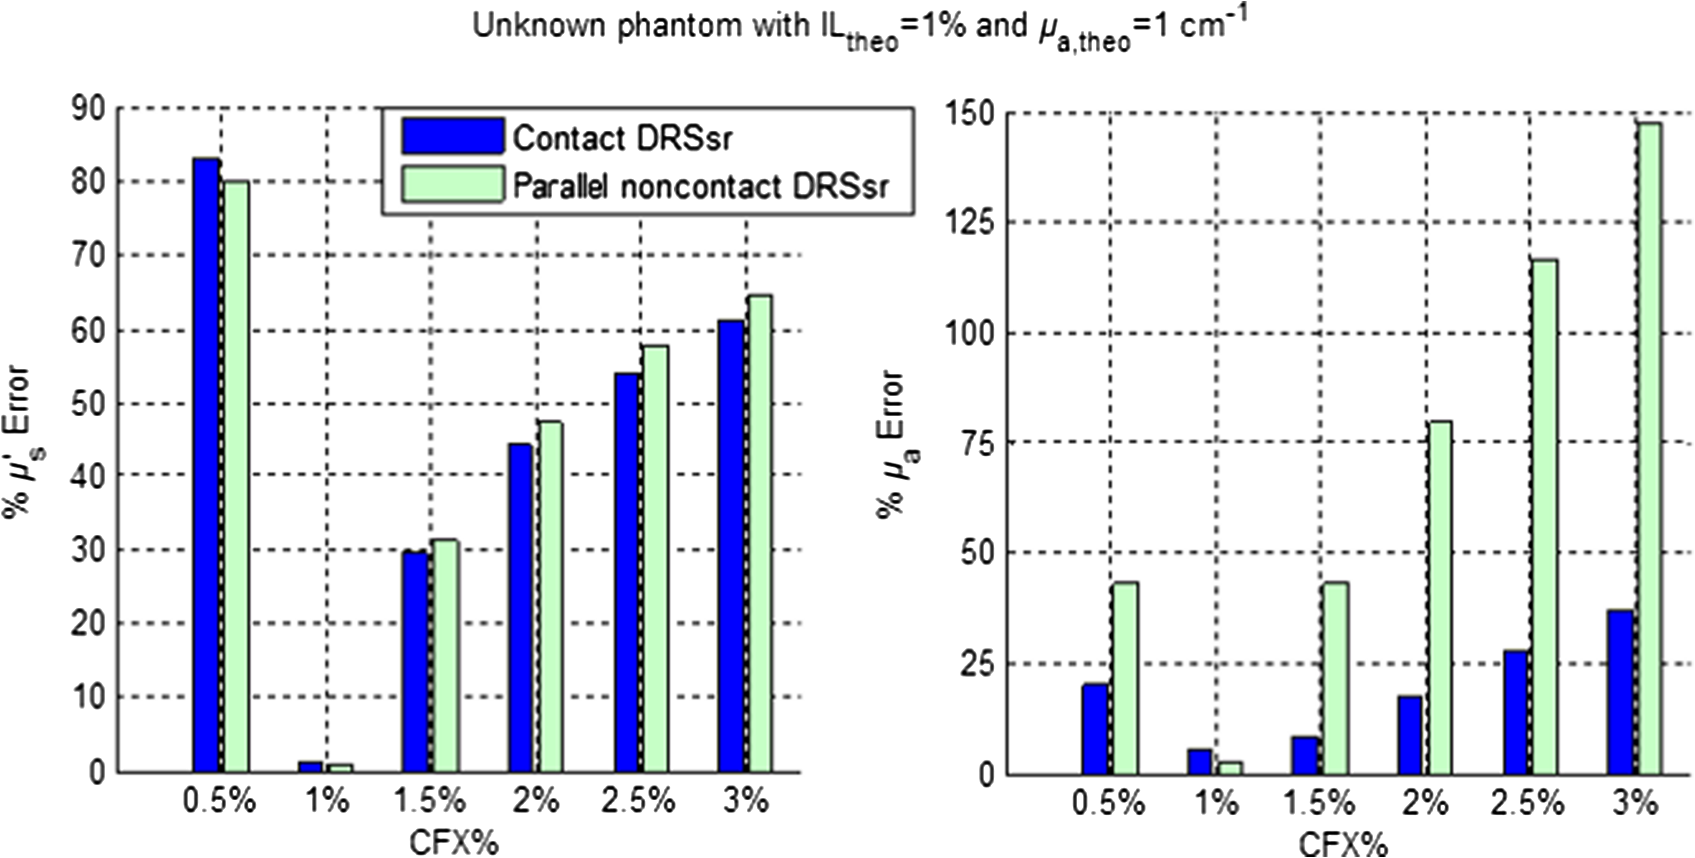 Estimation of unknown optical properties is best achieved for noncontact DRSsr because of its robust CF-reference base. Correspondingly, contact DRSsr displays a slightly higher error because of the vulnerability to experimental noise of its CF-reference base (see Fig. 9). When comparing optical properties estimation of phantoms having (even further from ) and the same , the average relative errors shown in Fig. 12 are obtained. Fig. 12Average relative percentage errors over the working spectrum of optical properties estimation for different unknown phantoms with and , 2, and . 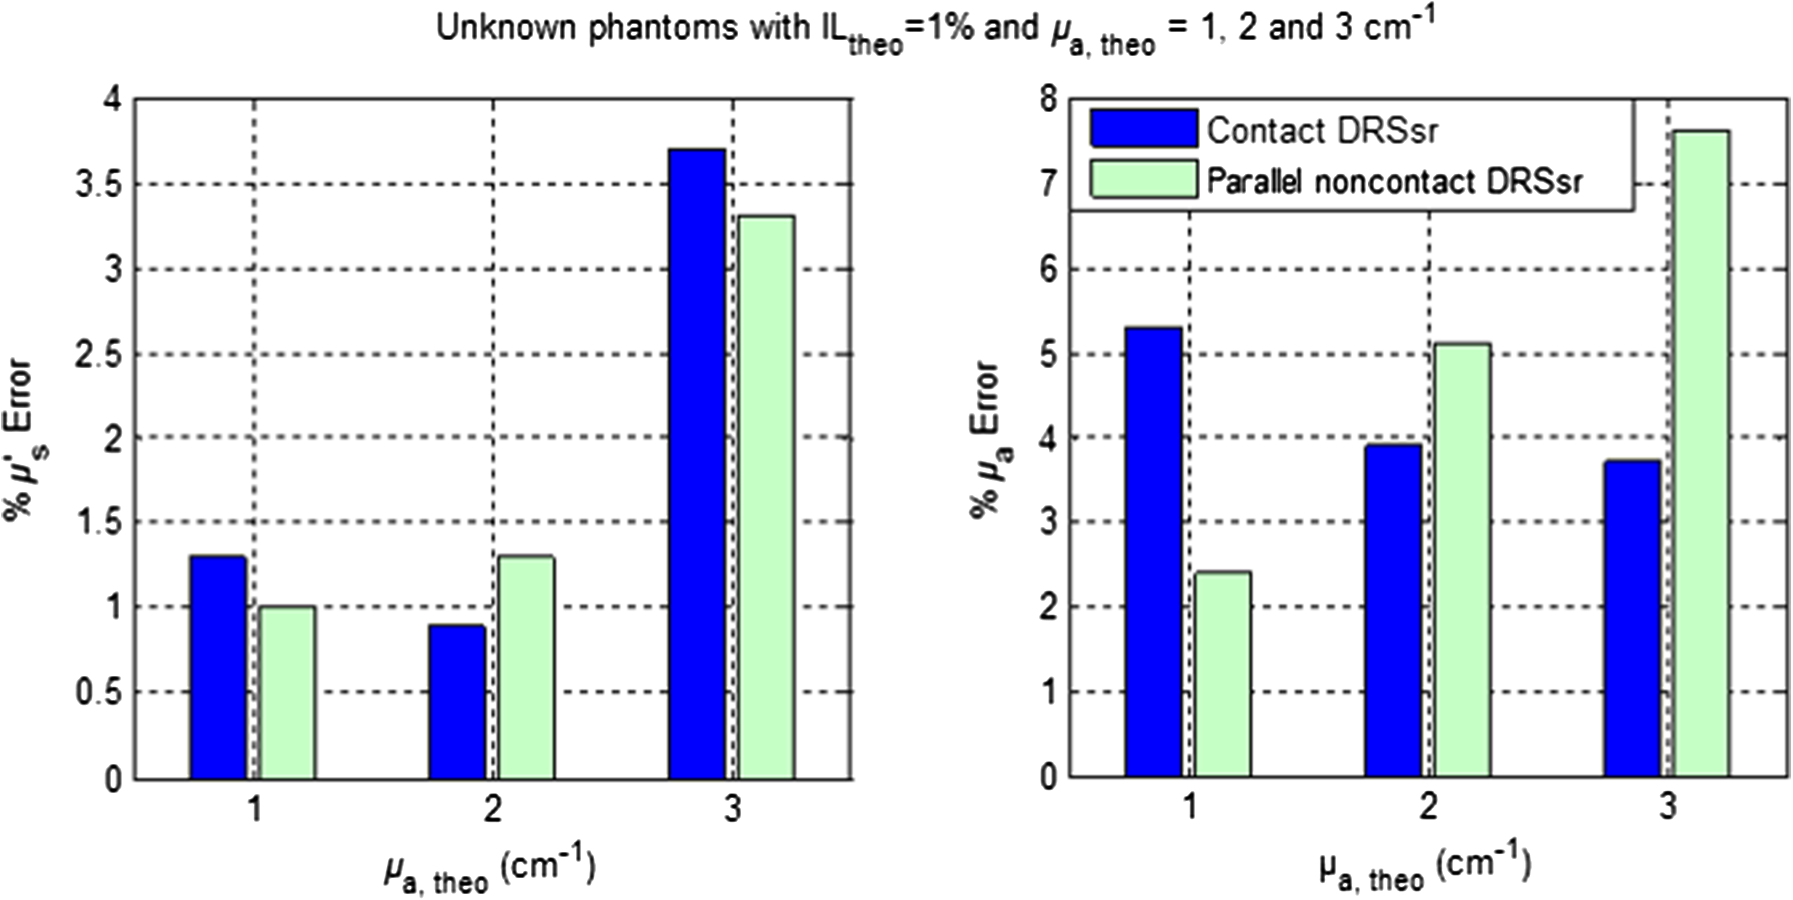 All errors are considered below 4% for both probe-based DRSsr setups as a result of the -based ACA-Pro algorithm. For those properties that concern the error, it is seen that for contact DRSsr it varies little, while for the noncontact setup it increases proportionally to the deviation from . However, all errors are below 8% for both probe-based DRSsr setups. 6.3.InterpolationTo validate the interpolation method of ACA-Pro, we built a CF two-reference base set with two reference phantoms (having common and and 1.5%) and used it to estimate the optical properties of an unknown phantom with in an aqueous blue pigment solution. Recall from Sec. 5.1 that interpolated estimations are calculated when the noninterpolated estimation lies between two neighboring . Figure 13 shows absorption estimations with interpolated between CF0.5% and CF1.5% and noninterpolated compared to the ideal absorption estimation obtained with the noninterpolated . Results are shown not only for the contact and noncontact probe-based DRSsr setups, but also for the CCD-based DRSsr setup (Fig. 4) for an extended validation of ACA-Pro. Fig. 13Absorption estimation with interpolated (), noninterpolated (), and ideal () CFs for a phantom having and characteristic of blue pigment depicted in dash-dot lines. (a) Contact DRSsr. (b) Parallel noncontact DRSsr. (c) Folded CCD-based DRSsr. 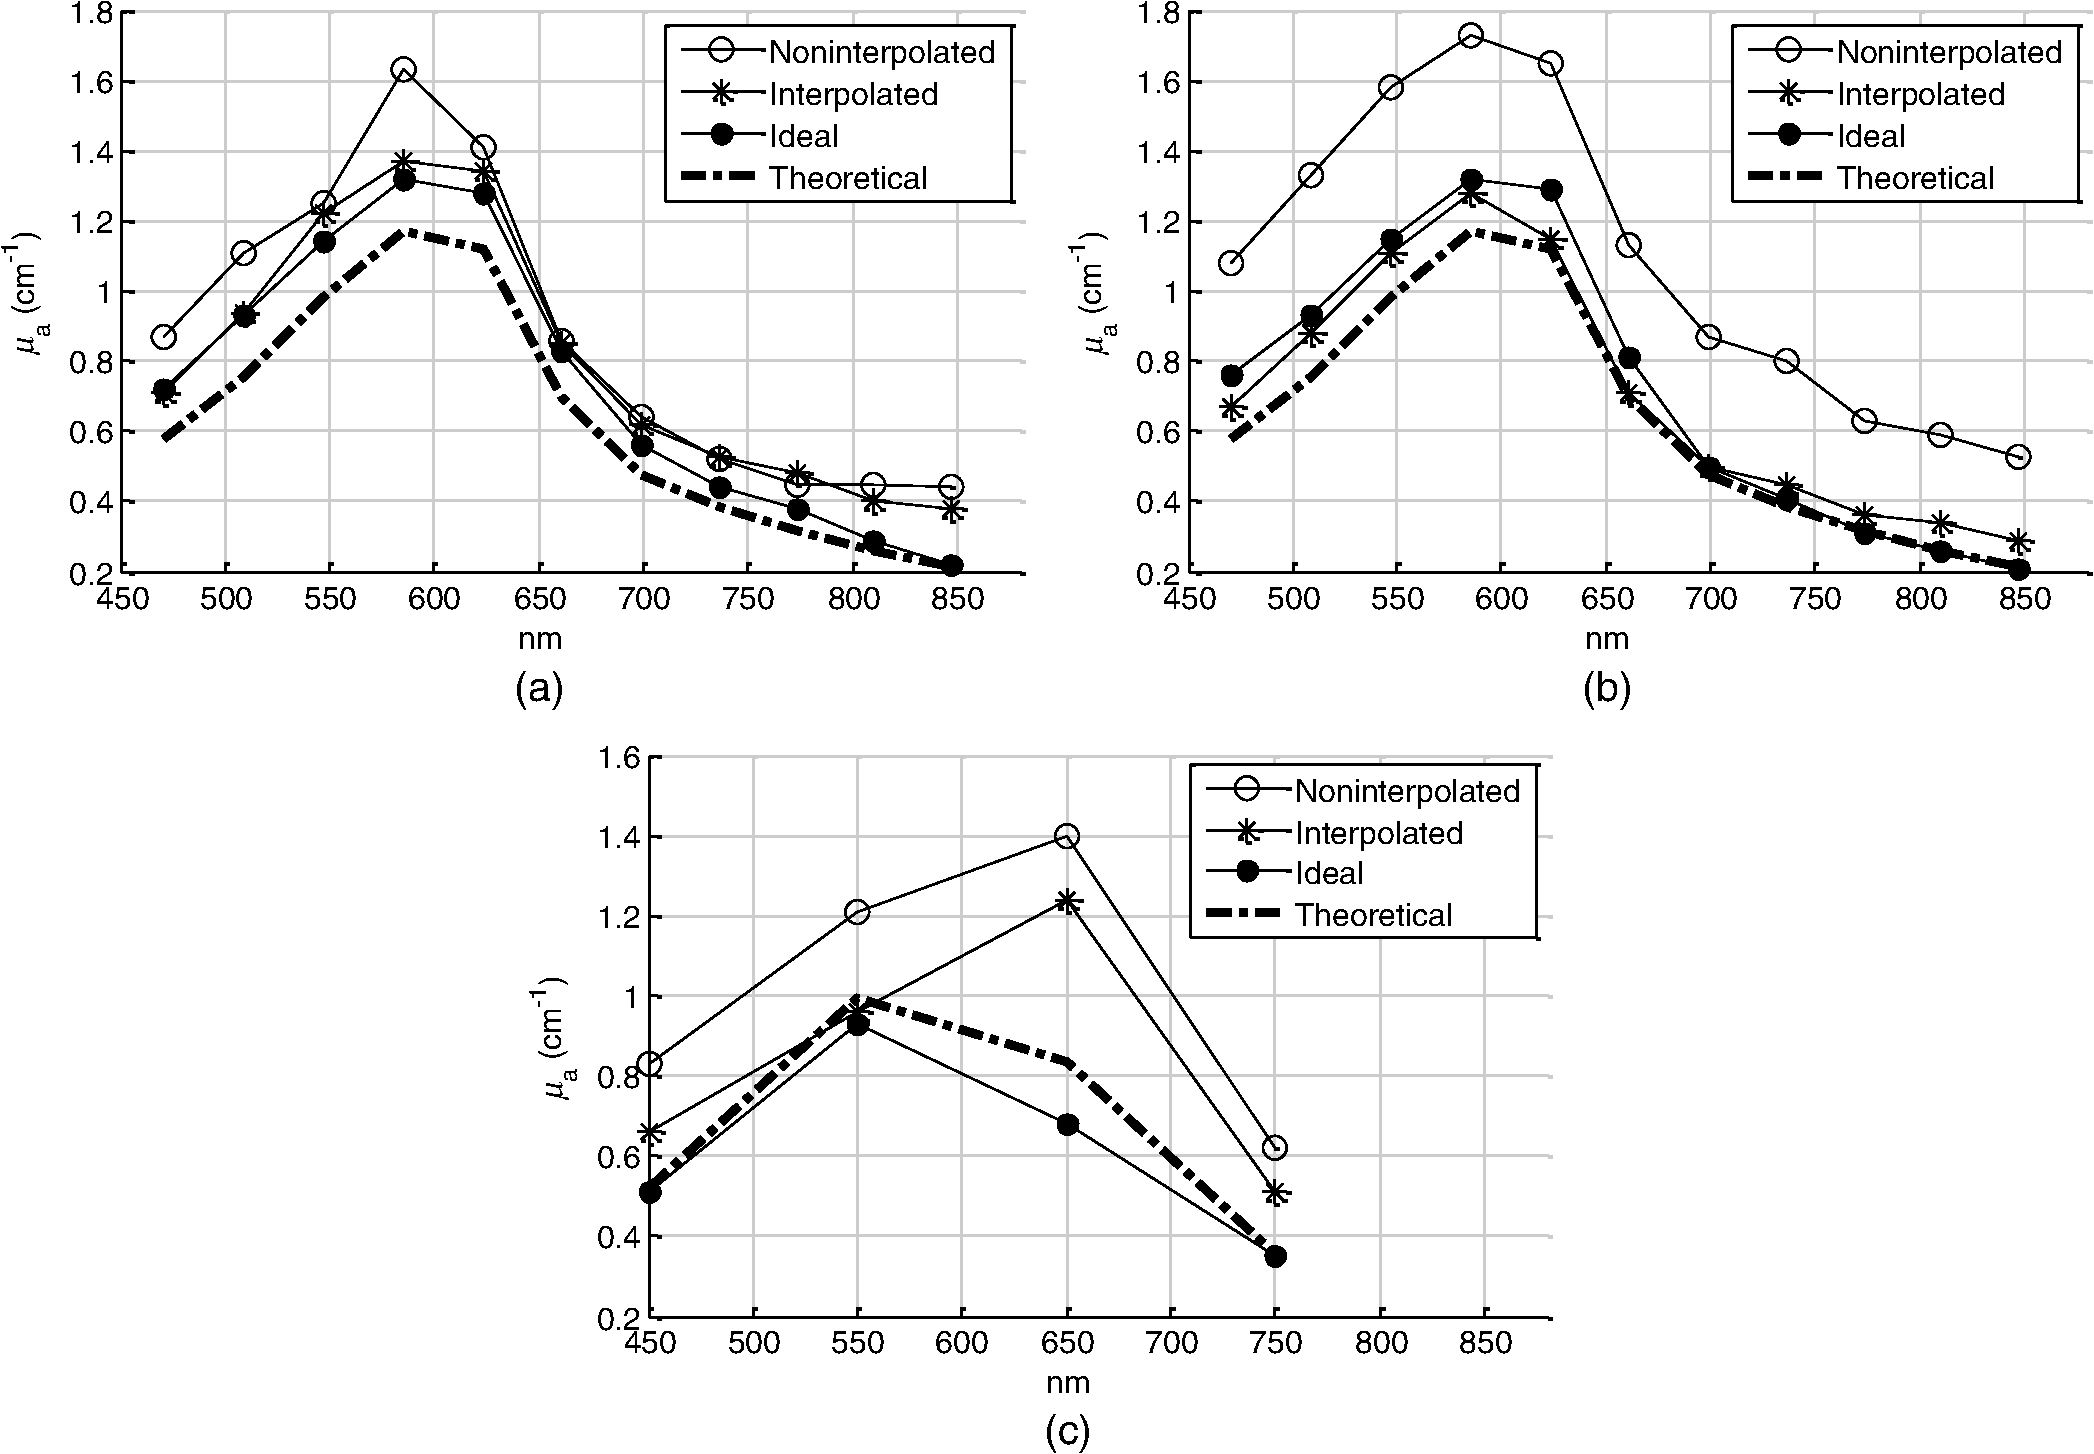 Figure 14 summarizes the average relative percentage error for both optical properties and the three setups: contact, (parallel) noncontact, and (folded) CCD-based DRSsr. Keep in mind that these errors are not impartial because only (filters) are considered for the CCD-based setup while are considered for the probe-based setups, reducing the weight of a single error. Fig. 14Average relative percentage error for noninterpolated (), interpolated () and noninterpolated ideal () estimations of optical properties of a phantom with and aqueous blue pigment.  The results validate the interpolation strategy of the ACA-Pro algorithm in all considered setups since it improves the accuracy of optical properties when compared to noninterpolated estimations. A more detailed analysis of estimations (left Fig. 14) obtained with the interpolated of the contact DRSsr setup shows an exception for which the noninterpolated estimation is slightly better. This is clearly related to the discontinuity of the contact reference base between and ) which is mostly visible with signals measured by (see Fig. 9). To improve this effect, as mentioned earlier, the Monte Carlo simulation should be refined at these low scattering values. 6.4.Correction of Instrumental Variations in Contact Spatially Resolved Diffuse Reflectance Spectroscopy MeasurementsThe extension of the ACA-Pro calibration approach between various experiments considers the use of a single measurement of a common homogeneous material that characterizes instrumental conditions to calibrate from variations that occur between different experiments (see Sec. 5.2). To illustrate this calibration algorithm, we consider the contact DRSsr setup only. In this study, a severe experimental variation is simulated by deliberately provoking a change in the signal intensities of and to affect the sensitivities of both and estimation. This is done by decentering the spectrometer fiber from the detection fiber bundles and . A solid piece of white resin25 having stable and homogeneous unknown optical properties is measured under contact conditions and used to characterize experimental conditions before and after the decentralization of fibers. A reference phantom having at 600 nm and is used. To show the validation of the correction strategy in the estimation, three different phantoms with common at 600 nm and , 2%, and 3% are used. To show the validation of the estimation, two different phantoms with and at 600 nm and a common are used. Figure 15 shows and of the different phantoms (different colors and shapes) with the noncorrected signals (empty shapes) and corrected signals (black-filled shapes). Estimations under the same experimental conditions of the CF six-reference base are illustrated with slashed black lines while theoretical optical properties are represented with black dotted lines. Fig. 15Estimations of (a) of phantoms with different , 2%, and 3% and common . (b) of phantoms with and and common . Different phantoms are represented with different colors. Measurements are taken under the same experimental conditions/fiber positions (slashed black lines) or different to the ones set to build the CF six-reference base. The latter are corrected (filled shapes) or noncorrected (black-filled shapes). The legend is given for one phantom, but the same line type code applies to all other phantoms. (a) Reduced scattering coefficient. (b) Absorption coefficient.  Figure 16 sums up the average (over the whole spectrum) relative errors of optical properties estimations shown in Fig. 15. Fig. 16Average relative percentage errors with noncorrected and corrected signals from measurements taken under different and same experimental conditions to those of the CF six-reference base.  Figures 15 and 16 show the accuracy improvement in both optical properties estimation of corrected measurements with respect to noncorrected measurements. Estimations with corrected measurements lie much closer than the noncorrected ones to those taken under the same experimental conditions. These results validate the correction strategy of ACA-Pro for experimental conditions variations. For estimation, we note that relative errors with the interpolation strategy increase with [see Fig. 16(a)]. To better understand this effect, [calculated according to Eq. (6)] for all is shown in Fig. 17. Notice that because of the decentralization of and , and decrease by while other nondecentralized fibers’ signals remain close to 1. Nevertheless, an unexpected alteration of is noticed (see Fig. 17), most probably related to the surface heterogeneities of the solid material. Fig. 17ratio of signals taken with centralized and decentralized and fibers to model different experimental conditions.  Therefore, the estimation degradation noticed with increasing IL(%) [see Fig. 16(a)] is related to the high sensitivity of to being at a close distance from the source (see Sec. 4.2). This points out the sensitivity of the calibration step to and thereby the importance of its robustness to avoid the erroneous alteration of signals. To ensure a robust unaffected by the surface heterogeneities of the solid material, measurements could be repeated at different sites and averaged. Alternatively, a better protocol, ensuring measurement repeatability, could be established. We developed a new measurement protocol through which the probe is not placed in direct contact with the material but away from it. Following the same decentralization procedure for and , we calculated the ratio of signals between centralized and decentralized measurements. Figure 18 shows the improved results. It is clear that repeatability of measurements is achieved and that changes are only due to expected experimental variations ( and decentralization). Fig. 18ratio of signals taken with centralized and decentralized and fibers and an optimized measurement protocol.  To summarize, we have simulated an extreme change (unlikely to occur naturally) in experimental conditions by decentralizing certain fibers and reducing their signal to to test the capability of our strategy to correct from experimental variations. The obtained estimation results validate the correction approach. This work has demonstrated that the adoption of a solid material, measured only once to characterize each experimental condition, has the potential to allow the use of a single reference base for optimal optical properties estimation. 7.ConclusionWe have presented an exhaustive comparison of the ACA-Pro calibration approach with contact and noncontact measurement modalities of DRSsr and two different detectors: a probe and a CCD. The main advantage of ACA-Pro lies in the use of a unique Monte Carlo-based LUT with which measurements, taken with the different systems, are compared to derive optical properties. This was achieved through the compensation of the different nonmodeled illumination profiles at short distances provoked by the components of the noncontact architectures. Intralipid phantoms with a wide range of scattering and absorption coefficients comparable to that of biological tissues, have been measured to validate the ACA-Pro algorithm. Errors for contact and noncontact probe-based DRSsr setups remained below 4% and 8% for and , respectively. Moreover, two strategies were developed to reduce the number of measurements and thus the manufacturing of liquid phantoms. The first is related to the use of interpolation between some reference measurements with different scattering coefficients. The results of this strategy, integrated in the ACA-Pro algorithm, were shown for all considered DRSsr setups with a probe or a CCD detector. The second deals with the correction of intensity changes between measurements taken under different experimental conditions. For this purpose, we proposed the use of a single measurement characterizing each experimental condition. We considered the measurement to be taken on a solid, optically stable, and homogeneous material. The latter has the potential to substitute the constant use of liquid intralipid phantoms after a first instrumental calibration and bypass related problems such as temporal instability of optical properties, tedious and constant fabrication, short-term conservation at low temperatures, and demanding manipulation. We illustrated the potential of this strategy with contact DRSsr measurements and with an improved measurement protocol. This approach poses the base for the development of a less demanding comparison technique between measurements taken at different time periods and subject to slight experimental variations. In conclusion, we have developed a new calibration strategy ACA-Pro that allows the estimation of optical properties of any DRSsr setup with a single LUT and a few intralipid reference phantoms measured only once. These reference measurements correct from the instrumental effects that are not modeled by the LUT used. Additionally, ACA-Pro corrects from the instrumental variations that occur between experiments taken at different time periods with a single measurement of a common solid material that characterizes individual experimental conditions. ReferencesJ. Qin and R. Lu,
“Hyperspectral diffuse reflectance imaging for rapid, noncontact measurement of the optical properties of turbid materials,”
Appl. Opt., 45
(32), 8366
–8373
(2006). http://dx.doi.org/10.1364/AO.45.008366 PMEAE3APOPAI 0967-33340003-6935 Google Scholar
G. Zonios and A. Dimou,
“Modeling diffuse reflectance from semi-infinite turbid media: application to the study of skin optical properties,”
Opt. Express, 14
(19), 8661
–8674
(2006). http://dx.doi.org/10.1364/OE.14.008661 OPEXFF 1094-4087 Google Scholar
G. Zonios and A. Dimou,
“Modeling diffuse reflectance from homogeneous semi-infinite turbid media for biological tissue applications: a Monte Carlo study,”
Biomed. Opt. Express, 2
(12), 3284
–3294
(2011). http://dx.doi.org/10.1364/BOE.2.003284 BOEICL 2156-7085 Google Scholar
C.-C. Yu et al.,
“Quantitative spectroscopic imaging for non-invasive early cancer detection,”
Opt. Express, 16
(20), 16227
–16239
(2008). http://dx.doi.org/10.1364/OE.16.016227 OPEXFF 1094-4087 Google Scholar
G. M. Palmer and N. Ramanujam,
“Monte Carlo-based inverse model for calculating tissue optical properties. Part I: theory and validation on synthetic phantoms,”
Appl. Opt., 45
(5), 1062
–1071
(2006). http://dx.doi.org/10.1364/AO.45.001062 APOPAI 0003-6935 Google Scholar
T. H. Pham et al.,
“Quantifying the absorption and reduced scattering coefficients of tissuelike turbid media over a broad spectral range with noncontact Fourier-transform hyperspectral imaging,”
Appl. Opt., 39
(34), 6487
–6497
(2000). http://dx.doi.org/10.1364/AO.39.006487 APOPAI 0003-6935 Google Scholar
P. Thueler et al.,
“In vivo endoscopic tissue diagnostics based on spectroscopic absorption, scattering, and phase function properties,”
J. Biomed. Opt., 8
(3), 495
–503
(2003). http://dx.doi.org/10.1117/1.1578494 JBOPFO 1083-3668 Google Scholar
X. Zhong, X. Wen and D. Zhu,
“Lookup-table–based inverse model for human skin reflectance spectroscopy: two-layered Monte Carlo simulations and experiments,”
Opt. Express, 22
(2), 1852
–1864
(2014). http://dx.doi.org/10.1364/OE.22.001852 OPEXFF 1094-4087 Google Scholar
N. Rajaram, T. H. Nguyen and J. W. Tunnell,
“Lookup table-based inverse model for determining optical properties of turbid media,”
J. Biomed. Opt., 13
(5), 050501
(2008). http://dx.doi.org/10.1117/1.2981797 JBOPFO 1083-3668 Google Scholar
S. F. Bish et al.,
“Handheld diffuse reflectance spectral imaging (DRSI) for in-vivo characterization of skin,”
Biomed. Opt. Express, 5
(2), 573
–586
(2014). http://dx.doi.org/10.1364/BOE.5.000573 BOEICL 2156-7085 Google Scholar
A. Koenig et al.,
“Diffuse reflectance spectroscopy: a clinical study of tuberculin skin tests reading,”
Proc. SPIE, 8592 85920S
(2013). http://dx.doi.org/10.1117/12.2002314 PSISDG 0277-786X Google Scholar
H. J. Van Staveren et al.,
“Light scattering in lntralipid-10% in the wavelength range of 400–1100 nm,”
Appl. Opt., 30
(31), 4507
–4514
(1991). http://dx.doi.org/10.1364/AO.30.004507 APOPAI 0003-6935 Google Scholar
S. L. Jacques,
“Optical properties of biological tissues: a review,”
Phys. Med. Biol., 58
(11), R37
(2013). http://dx.doi.org/10.1088/0031-9155/58/11/R37 PHMBA7 0031-9155 Google Scholar
I. V. Meglinski and S. J. Matcher,
“Quantitative assessment of skin layers absorption and skin reflectance spectra simulation in the visible and near-infrared spectral regions,”
Physiol. Meas., 23
(4), 741
(2002). http://dx.doi.org/10.1088/0967-3334/23/4/312 Google Scholar
O. Kim et al.,
“Reflectance spectrometry of normal and bruised human skins: experiments and modeling,”
Physiol. Meas., 33
(2), 159
(2012). http://dx.doi.org/10.1088/0967-3334/33/2/159 PMEAE3 0967-3334 Google Scholar
V. Venugopalan, J. You and B. Tromberg,
“Radiative transport in the diffusion approximation: an extension for highly absorbing media and small source-detector separations,”
Phys. Rev. E, 58
(2), 2395
(1998). http://dx.doi.org/10.1103/PhysRevE.58.2395 JBOPFO 1083-3668 Google Scholar
F. Bevilacqua,
“Local optical characterization of biological tissues in vitro and in vivo,”
(1998). Google Scholar
R. Bays et al.,
“Clinical determination of tissue optical properties by endoscopic spatially resolved reflectometry,”
Appl. Opt., 35
(10), 1756
–1766
(1996). http://dx.doi.org/10.1364/AO.35.001756 APOPAI 0003-6935 Google Scholar
B. S. Nichols et al.,
“A quantitative diffuse reflectance imaging (QDRI) system for comprehensive surveillance of the morphological landscape in breast tumor margins,”
PLoS One, 10
(6), e0127525
(2015). http://dx.doi.org/10.1371/journal.pone.0127525 POLNCL 1932-6203 Google Scholar
T. Igarashi, K. Nishino and S. K. Nayar,
“The appearance of human skin: a survey,”
Found. Trends Comput. Graphics Vision, 3
(1), 1
–95
(2007). http://dx.doi.org/10.1561/0600000013 Google Scholar
F. Foschum, M. Jäger and A. Kienle,
“Fully automated spatially resolved reflectance spectrometer for the determination of the absorption and scattering in turbid media,”
Rev. Sci. Instrum., 82
(10), 103104
(2011). http://dx.doi.org/10.1063/1.3648120 RSINAK 0034-6748 Google Scholar
B. Cletus et al.,
“Temperature-dependent optical properties of intralipid measured with frequency-domain photon-migration spectroscopy,”
J. Biomed. Opt., 15
(1), 017003
(2010). http://dx.doi.org/10.1117/1.3290820 Google Scholar
S. Prahl, Optical Phantoms, ECE532 Biomedical OpticsOregon Graduate Institute,1998). Google Scholar
F. Foschum et al.,
“Surface layering effect of diluted intralipid,”
Proc. SPIE, 9538 95381A
(2015). http://dx.doi.org/10.1117/12.2183761 PSISDG 0277-786X Google Scholar
Soloplast, “Résine gts pro,”
(2015) http://www.soloplast-vosschemie.fr/resine-gts-pro.htm October ). 2015). Google Scholar
BiographyVeronica Sorgato is finishing her PhD in biomedical optics entitled “Novel multispectral imaging technique for the wide-field quantification of optical properties” at CEA (Atomic Energy and Alternative Energies Commission, Grenoble, France). She started the PhD in October 2013 after graduating with an MSc degree in biomedical engineering and a BSc degree in electronic engineering. Michel Berger works as an engineer at CEA (Atomic Energy and Alternative Energies Commission, France) and has expertise in design, characterization, and implementation of optical systems. For more than 15 years, he has worked on optical systems for clinical or preclinical applications, such as fluorescence reflectance imaging, continued diffuse optical tomography, time-resolved diffuse optical tomography, and spatial resolved diffuse reflectance spectroscopy. Charlotte Emain worked 2 years (2010 to 2012) at Teem Photonics in the composition of lasers. Since 2012, she has worked as an optical technician in the LISA laboratory of CEA (Atomic Energy and Alternative Energies Commission, France). She has an expertise in optical instrumental design and setup assembly. Christine Vever-Bizet, a CNRS research scientist, after finishing her PhD in biophysics worked in the Pharmaceutical Louis Pasteur University (Strasbourg, France) and in the Biophysics Laboratory of the MNHN (Paris, France). Her research was devoted to the study of tumor cell or virus photoinactivation. Since 2004, she has joined the Pierre and Marie Curie University (Paris, France) where her studies are focused on fluorescence diagnosis based on the autofluorescence modifications of the extracellular matrix proteins. Jean-Marc Dinten is a senior scientist at the Biology and Health Division in CEA-LETI. For more than 20 years, he has been developing medical image processing and reconstruction algorithms associated with the development of innovative x-rays and optical imaging systems. He now heads the Imaging Readout Systems Laboratory, which develops new optical imaging systems for health and biology applications. Geneviève Bourg-Heckly holds a PhD in physics. After 12 years of professional experience in laser and medical imaging industries, she joined the Pierre and Marie Curie University (Paris, France) in 1993 to develop projects in biomedical optics. Her research interests are in the field of noninvasive diagnosis methods based on optical spectroscopy and imaging. Over the last years, her studies have mainly focused on the development of single-photon and multiphoton endomicroscopy. Anne Planat-Chrétien has been project manager in the field of optical imaging applied to biology and health since 2000 at CEA-LETI (France). She is a PhD engineer in image processing modeling, simulation, and algorithms. During the last decade, she has extended her expertise to system analysis, tests monitoring, and system characterization fields. Currently, she is leading the thematic on deep reconstruction of endogenous properties of biological tissues for both clinical and preclinical applications. |