
|
|
1.IntroductionAdvances in super-resolution microscopy have enabled finer biological features to be visualized/resolved at resolutions far beyond the optical diffraction limit.1 There are three main types of super-resolution microscopy techniques: stimulated emission depletion microscopy (STED) and its derivatives based on targeted modulation of the fluorescent state,2–6 stochastic optical reconstruction microscopy/(fluorescence) photoactivation localization microscopy (STORM/(f)PALM) based on single molecule localization (SML),7,8 and (saturated) structured-illumination microscopy [(S)SIM] based on frequency domain expansion with Moiré interference.9,10 STORM/(f)PALM requires acquisition of thousands of frames to accumulate sufficient single molecule localizations for reconstructing a super-resolution image. One way to accelerate the temporal resolution is to have much more single emitters within one focal spot at on state simultaneously, but the increased molecule density leads to dramatic challenges for localizing single molecules with ideal precision and efficiency.11 Super-resolution optical fluctuation imaging (SOFI) resolves the fluorescent molecules through their emission fluctuation statistics. Instead of localizing single molecules like STORM/(f)PALM, SOFI extracts subdiffraction information from computing the correlation statistics, temporal cumulants or spatiotemporal cross-cumulants, and stochastic fluorescence fluctuations of recorded raw images.12,13 Several unique strengths make SOFI an attractive super-resolution technique for living samples. First of all, SOFI requires only a few hundreds of frames with moderate signal-to-noise ratio (SNR) to reconstruct a super-resolution image, which enables SOFI to image much faster than STORM and PALM.14,15 This is because SOFI allows much higher excited molecule densities within diffraction limited regions than STORM or PALM.14 Second, benefitting from its three-dimensional (3-D) point spread function (PSF) modulation, SOFI exhibits the inherent 3-D super-resolution capability.16 Third, the implementation of SOFI is technically simple and flexible for various platforms, e.g., wide-field, total internal reflection fluorescence microscope, and even spinning-disk confocal microscope, which ensures its broad applicability.17 SOFI has developed rapidly over the past few years. On algorithm development, Dertinger et al.18 have implemented interpolation and Fourier reweighting into SOFI to improve the spatial resolution without sacrificing the field-of-view. Deng et al.19 have developed spatial covariance reconstructive, aiming to improve both spatial and temporal resolution of SOFI. Geissbuehler et al.20 have developed balanced SOFI (bSOFI) to map additional fluctuation parameters in SOFI; they have also achieved 3-D live-cell SOFI using multiplane imaging techniques.21 Kisley et al.22 have combined SOFI with FCS together to produce fluorescence correlation spectroscopy SOFI (fcsSOFI), which can simultaneously provide super-resolution imaging and diffusion dynamics within porous nanomaterials. Stein et al.23 have solved the “pixelation” problem of SOFI using Fourier-transform-based interpolation Fourier-SOFI. Vandenberg et al.24 have presented a strategy to estimate the uncertainty associated with a particular SOFI measurement based on statistical resampling, which can improve the SNR of SOFI images. Jiang et al.25 have developed a modified SOFI algorithm to enhance the temporal resolution of SOFI. On the development of fluorescent labeling to enhance SOFI, Dedecker et al.13 have pioneered photochromic stochastic optical fluctuation imaging for dual-color live-cell imaging and developed several fluorescent proteins, such as pcDronpa2, rsGreen0.8, rsGreen1, and so on, for SOFI multimodality super-resolution imaging.26,27 We have reported an inverse multiplexing scheme, termed joint tagging SOFI,28 to improve the spatiotemporal resolution and fidelity of SOFI. We also presented a monomeric green reversibly switchable fluorescent protein termed Skylan-S, which features high brightness, photostability, and contrast ratio, for live-cell SOFI.29 Cho et al.30 have strategically utilized Förster resonance energy transfer effect in SOFI to achieve direct SOFI. Watanabe et al.31 have developed a fast blinking quantum dot termed the blinking enhanced dot to improve the temporal resolution of SOFI by an order of magnitude, thereby realizing real-time super-resolution. In addition, on the illumination approaches of SOFI, based on the random laser speckle illumination, S-SOFI has been demonstrated to achieve SOFI nanoscopy with nonblinking fluorescent tags.32 Recently, we also demonstrated two-photon SOFI (2PLS-SOFI) via two-photon light-sheet illumination for 3-D deep-tissue imaging.33 These techniques have vastly expanded the application of SOFI. Due to the statistical fluctuation analysis nature of SOFI, it poses unique requirements for the imaging devices. However, no evaluation of the performance of different imaging devices for SOFI has been reported so far. In this paper, we aim at evaluating the performance of scientific-grade complementary metal oxide semiconductor (sCMOS) and electron multiplying charge coupled device (EMCCD), two types of detectors popularly employed in SOFI imaging. EMCCD has been widely used in super-resolution optical microscopy, whereas sCMOS is just beginning to gain popularity on account of its improved performance. Our simulation and experimental results demonstrate that sCMOS outperforms EMCCD in most SOFI applications. The fast imaging rate, large pixel number, and high detection sensitivity of the intensity fluctuation make sCMOS-based SOFI an attractive approach for large field-of-view, high spatiotemporal super-resolution imaging. 2.Materials and Methods2.1.Numerical SimulationsThe simulations were implemented using custom-built codes in MATLAB 2013a (Mathworks Inc.). A resolution test object featuring the spatial frequencies increase from outer circle to inner circle was generated for subsequent evaluations. The test object consists of 40 lines with different angles. Although SOFI tolerates higher excited molecule density than PALM/STORM, it also fails to reconstruct faithful images at ultrahigh density regime. The central region of the test object was removed owing to its ultrahigh spatial frequency, thus avoiding severe artifacts induced by SOFI processing. The spatial frequency of the test object ranges from to . The distribution of spatial frequency decreases from the inner circle () to outer circle (). The image sequence was generated with multiple blinking points distributed on the test object. The blinking statistics obeys the power law distribution, i.e., , where is the probability density and denotes the power law exponent. In the simulations, the exponents for on and off blinking are 1.5 and 1.9, respectively. Shot noise, read noise, and fixed pattern noise were also selectively added to the generated image sequence. The SOFI processing was implemented using the bSOFI toolbox developed by Marcel Leutenegger.20 The cross-correlation evaluation was performed using the custom-built MATLAB program. To estimate the fidelity of SOFI reconstruction under different situations, we have calculated the cross-correlation coefficients between the simulated SOFI reconstruction and the test object convolved with corresponding PSFs. We converted the image to the polar coordinate first, and take 360 deg with each radius, corresponding to one spatial frequency. The correlation values for different situations were calculated using MATLAB R2013a (MathWorks). We evaluated the performance of the SOFI reconstructed images based on the calculation of multiple correlation values along the circular directions at multiple radial values of the test object. Finally, the curve showing the correlation value versus spatial frequency was plotted to estimate the SOFI imaging performance. 2.2.Data ProcessingA subpixel drift-correction algorithm based on discrete Fourier transforms and nonlinear optimization in a self-reorganized code written in MATLAB 2013a was used to correct for drift of raw data during image acquisition.34 High-order spatiotemporal crosscumulants between adjacent pixels was calculated during SOFI processing. The nonlinear brightness response in SOFI images can be linearized and the spatial resolution can be further improved linearly with the cumulant order after balancing. In this paper, fourth-order cross-cumulant balanced SOFI (bSOFI) was applied to 1200 frames using the shortest accessible lag time.20,28 The pixel sizes of average images were interpolated the same as the fourth-order SOFI images. 2.3.Cell Culture, Transfection, and FixationCos-7 cells were plated on a glass bottomed dish and cultured in Dulbecco’s modified eagle medium supplemented with 10% fetal bovine serum for 2 days. For optimal microtubule imaging, cells were preextracted with extracting buffer containing 0.1 M piperazine-1,4-bisethanesulfonic acid (PIPES), 1 mM ethylene glycol tetraacetic acid (EGTA), , and 0.2% Triton X-100 for 1 min. Cells were then fixed in phosphate-buffered saline (PBS) with 4% paraformaldehyde (PFA) and 0.1% glutaraldehyde (GA) for 15 min at room temperature. After fixation, cells were permeabilized with 0.5% Triton X-100 for 5 min, washed with PBS and quenched for 7 min with 0.1% sodium borohydride (), then washed again and blocked with 5% bovine serum albumin and 0.1% Triton X-100 for 30 min. Biotin conjugated antialpha tubulin antibody (Abcam#ab74696) was diluted in the blocking buffer and incubated for 1 h at room temperature. Cells were washed three times from the primary antibody with PBS. Streptavidin conjugated Qdots 705 (Invitrogen) were diluted in the same blocking buffer and incubated with cells for 1 h at room temperature. Samples were stored at 4°C before imaging. 2.4.Imaging System and AcquisitionFor comparison of SNR between sCMOS and EMCCD in SOFI imaging, a commercial optical microscopy system (Ti-E; Nikon, Japan) with a high-NA oil objective (, NA 1.45 Nikon with internal magnification lenses in the microscope system) was used for imaging acquisition, as described in Sec. 4.1. A 473-nm laser (MXL-III-473, CNI laser, China) was used to excite Qdots 525. A band-pass filter (500 to 550 nm) was placed before an EMCCD camera (Andor iXon DU-897) and scientific complementary metal-oxide-semiconductor (sCMOS, Andor Zyla 4.5). The maximum power near the back pupil of the objective was about 10 mW for the 473-nm laser in Fig. 7. The excitation intensity for the 473-nm laser is about on specimen. The same commercial optical microscopy system (Ti-E; Nikon, Japan) with a high-NA oil objective (, NA 1.49 Nikon with internal magnification lenses in the microscope system) was used to compare SOFI performance between sCMOS and EMCCD for microtubule imaging in Sec. 4.2. A 488-nm fiber laser (MPB Communications, 200 mW) was used to excite the microtubule labeled with Qdots 705. A polychromatic mirror set (Di01-R405/488/561/635-Dichroic and FF01-446/523/600/677-Emission) was used before the EMCCD (Andor iXon DU-897) and sCMOS (Hamamatsu ORCA-Flash 4.0). The maximum power near the back pupil of the objective was about 15 mW for the 488-nm laser in Fig. 8. The excitation intensity for the 488-nm laser is about on specimen. 3.Simulation Results3.1.Comparison of Super-Resolution Optical Fluctuation Imaging Performances on Different Optical Pixel SizesIn this simulation, we compared the effect of pixel sizes on SOFI imaging. We assumed a fluorescence wavelength of 625 nm and a numerical aperture (NA) of 1.4 with different pixel sizes. SOFI images were reconstructed based on the auto (cross-) correlation or cumulants of the intensity fluctuation. For example, the second-order autocorrelation function is given by12,35 where is the constant molecular brightness, is the time-dependent fluctuation of the molecule, denotes the time-averaged correlation value, and represents the PSF of the system.The two-dimensional detector was employed to record the fluorescence fluctuation. The final SOFI image result can thus be expressed with the calculation of corresponding pixel-wise cumulants (correlations). For example, the second-order SOFI pixel value can be expressed as where denotes the ’th blinking emitter, and is the fluorescence fluctuation on the pixel over time .As shown in Fig. 1, multiple blinking emitters distributed on a simulated resolution test object () with different pixel sizes were generated for SOFI reconstruction. Due to the optical diffraction, the averaged image is blurred compared to the test object [Figs. 1(a)–1(c)]. Subsequently, we implemented third-order SOFI processing for super-resolution image reconstruction of the raw data with different pixel sizes. As can be seen, the third-order SOFI image [Figs. 1(e)–1(g)] can significantly enhance the spatial resolution. However, a close-up look at the dense region reveals that the SOFI result obtained with smaller pixel size (65 nm) has better resolving capability than the counterpart obtained with larger pixel size (160 nm) shown in Figs. 1(e)–1(g).18 The cross-section profiles confirm that smaller pixel size exhibits higher resolution enhancement than larger ones in SOFI imaging [Fig. 1(h)]. We estimated that the spatial resolutions of the third-order SOFI with pixel sizes of 65, 108, and 160 nm are 110, 150, and 155 nm, respectively. Fig. 1Simulations and comparison of SOFI reconstructions with different optical pixel sizes. (a)–(c) The averaged conventional images of the test object with pixel sizes of 65, 108, and 160 nm, respectively. Insets: magnified regions. (d) The test object. Dotted circles indicate the positions of different spatial frequencies. (e)–(g) Third-order SOFI images with a pixel size of 65, 108, and 160 nm, respectively. Insets: magnified regions. (h) Cross sections indicated by the white lines in (c)–(g). (i) Correlation value versus spatial frequency for (e)–(g), respectively. (j) Simulation of the curve representing cut-off frequency (spatial resolution) as a function of the pixel size; 500 frames were simulated for the SOFI reconstruction. This simulation is performed with shot noise included and fixed photon budget ( photons for each frame) for different pixel sizes; 500 photons are detected from a single molecule in the bright state per time unit. In our simulations, the SNR is about 3 when 40- to 50-nm pixel sizes were used. 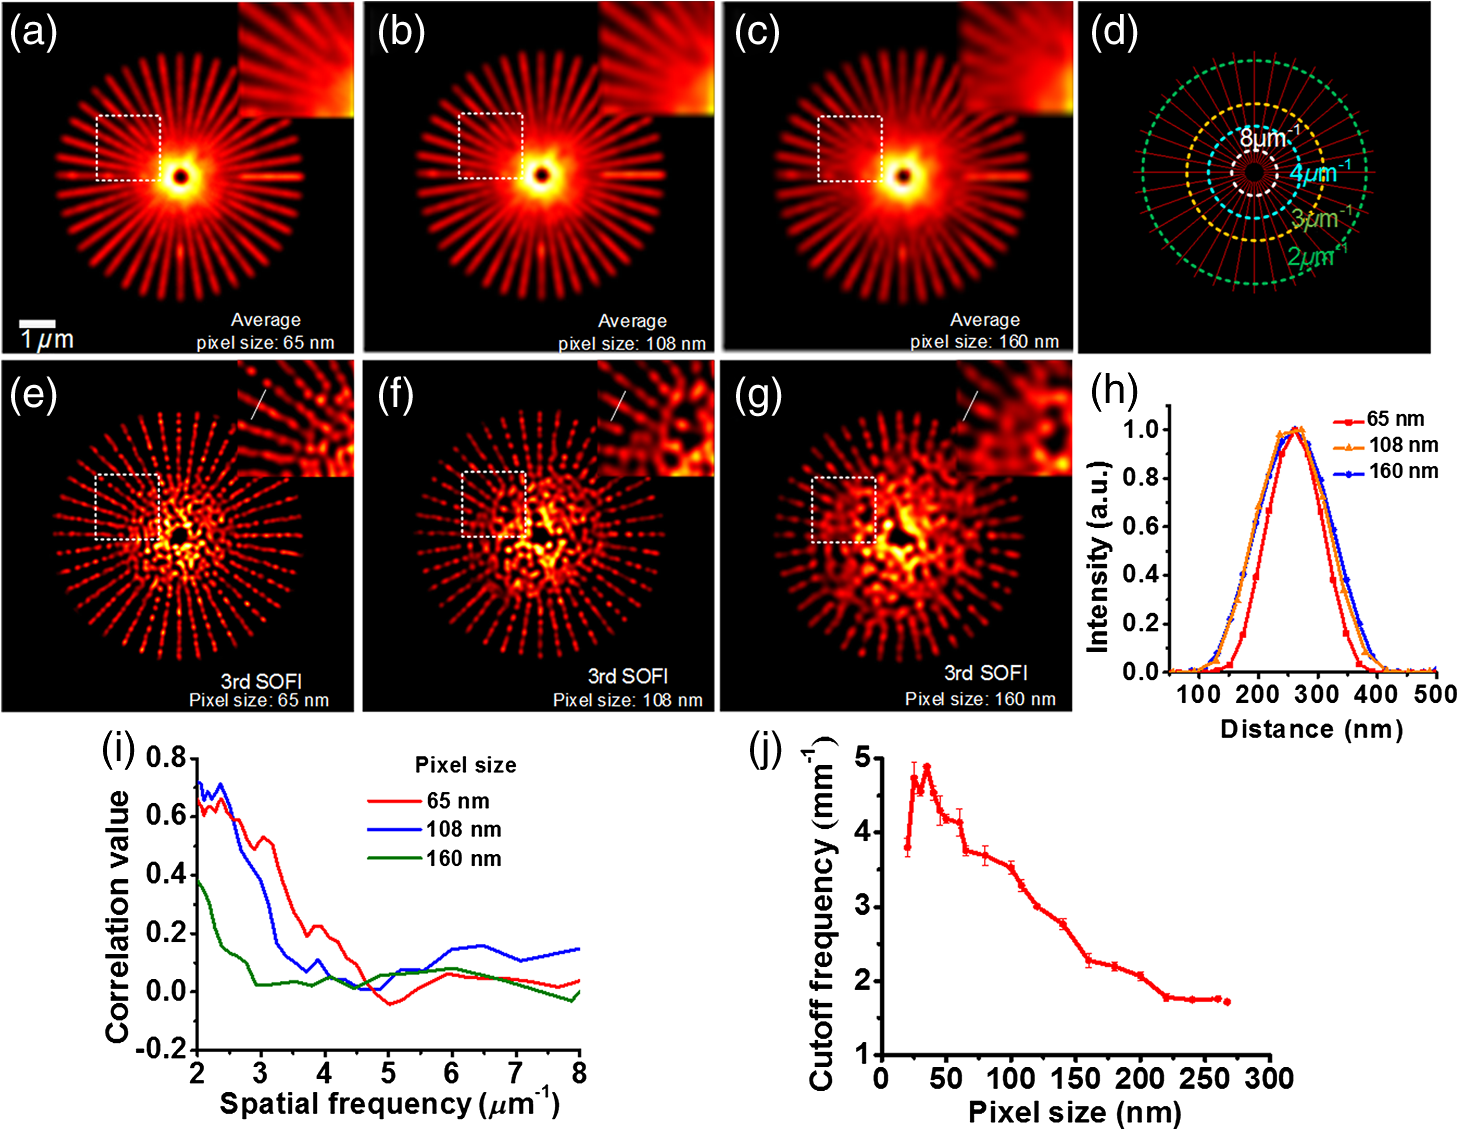 The cross-correlation values between the SOFI reconstructed image and the original image were calculated to estimate the SOFI performance. The correlation values were calculated between the third-order SOFI reconstructed images and the target convolved with the third-order SOFI PSF. As can be seen in Fig. 1(i), the image with the pixel size of 160 nm presents poor correlation with the target. With the reduction of pixel size, the correlation value enhances accordingly. The image with 65-nm pixel size presents a high correlation relationship with the target. The cut-off frequency is defined as the spatial frequency when the correlation coefficient drops to 0.2. The value of cut-off frequency is used for evaluating the performance of SOFI imaging in the simulation. The corresponding cut-off frequencies were estimated to be 3.8, 3.2, and for pixel sizes of 65, 108, and 160 nm, respectively. We simulated the curve investigating the relationship between the cut-off frequency and pixel sizes. As can be seen in Fig. 1(j), the best SOFI result can be obtained with pixel sizes of to 50 nm. When increasing the pixel sizes, the cut-off frequencies drop monotonically. When further reducing the pixel sizes (), the cut-off frequency also decreases due to lower SNR (less photons being collected) for smaller pixel sizes. Note that the optimal pixel size obtained here is dependent on the SNR of the generated image sequences. In this simulation, the SNR is about 3 when 40- to 50-nm pixel sizes were used. 3.2.Comparison of Super-Resolution Optical Fluctuation Imaging Performances on Different Frame RatesThe frame rate of a detector also influences SOFI reconstruction, especially in live-cell applications. In general, sCMOS is able to achieve more than (fps) with a large field-of-view (), much faster than EMCCD. A filamentous network mimicking the cytoskeleton in a living cell was generated for this simulation [Fig. 2(a)]. In order to simulate the dynamic motion of the cytoskeleton in a living cell, the simulated network structure was continuously rotated for 1 deg counterclockwise per second (rotation occurs every frame). We first compared reconstructed SOFI performances with the same frame number but different frame rates. The frame number used for SOFI reconstruction is 100 frames. The frame rates are 100 and 33 fps, respectively. The reconstructed super-resolution images were obtained by the second-order SOFI processing using 100 raw frames. SOFI images obtained with 100 fps exhibit better continuity and improved spatial resolution compared with the counterpart obtained with 33 fps [Figs. 2(b)–2(e)]. Due to the designed sample movement, the low frame rate images show an obvious filamentous split artifact [Figs. 2(c) and 2(e)], which is caused by the threefold image acquisition time during image collection. This suggests that the slow acquisition speed can lead to a larger artifact from the inevitable sample movement in live-cell SOFI imaging. Fig. 2Comparison between SOFI imaging with different frame rates. Hundred frames are used for SOFI reconstruction. The simulation was performed with shot noise included, the collected photon numbers for each frame were dependent on frame rates. (a) Averaged conventional image of a simulated filamentous network. (b) Second-order SOFI image obtained with 100-fps frame rate and 1-s acquisition time. (c) Second-order SOFI image obtained with 33-fps frame rate and 3-s acquisition time. (d) and (e) Magnified regions indicated by the white dotted box in (b) and (c). (f) Cross sections indicated by the white dotted lines in (a), (d), and (e). Scale bars: Upper panel: . Lower panel: . 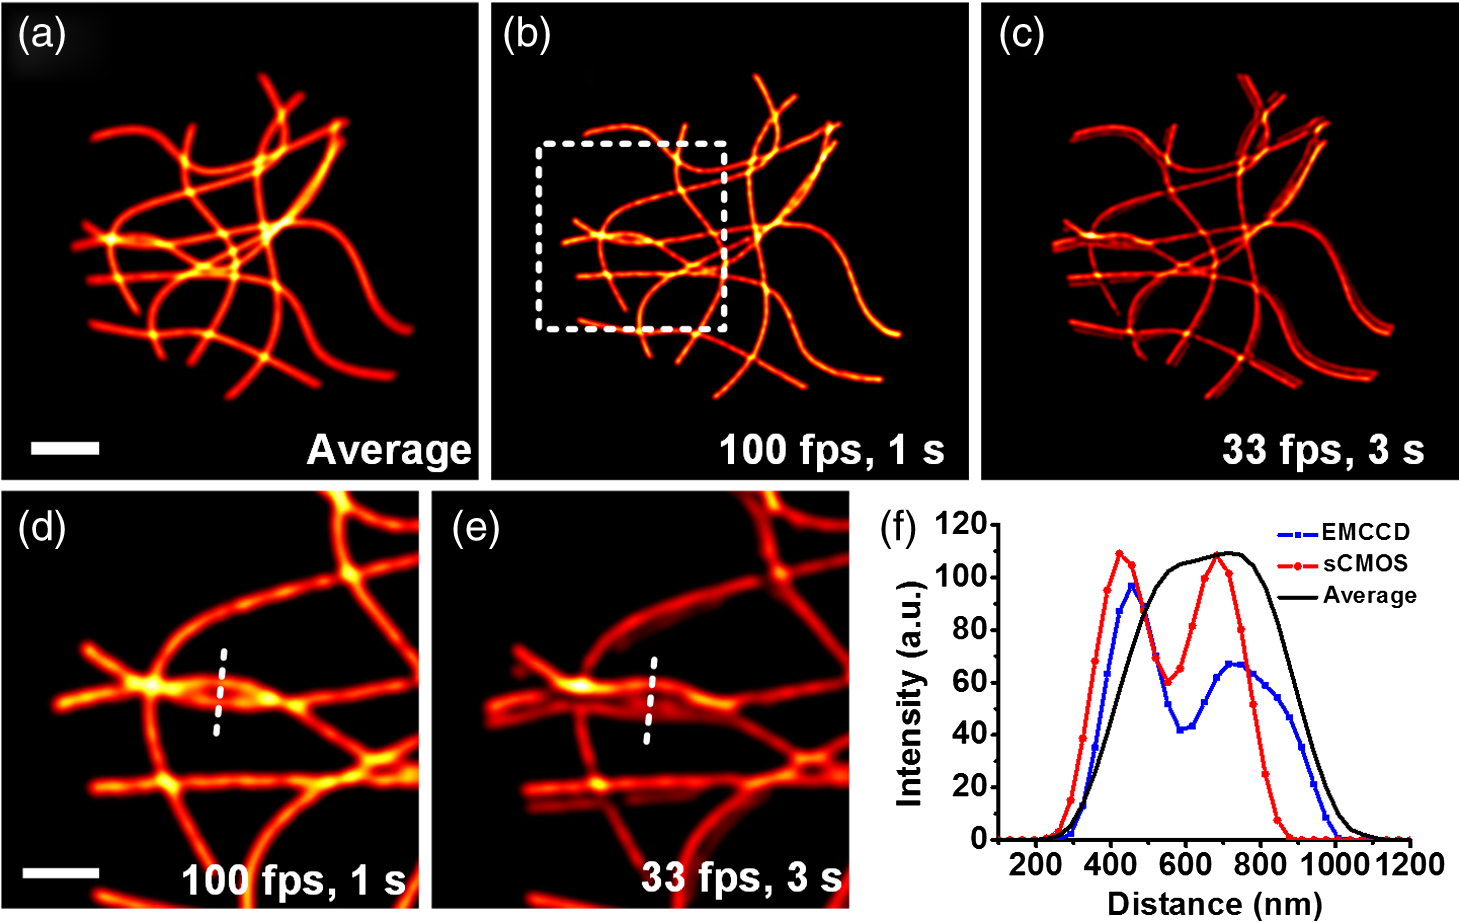 In Fig. 3, the comparison of SOFI reconstruction with different frame rates at the same acquisition time was simulated. In this simulation, the acquisition time for different frame rates was always set to 1 s. The rotation of the simulated filamentous network was , with the rotation occuring in each image frame. The frame rates range from 10 fps to 600 fps. As can be seen, the SNRs of raw image frames decline with the increase of frame rates. However, the SOFI reconstruction results for high frame rates present better performance than the results for low frame rates. During the image acquisition time of 1 s, the collected image numbers for low frame rates are insufficient for reliable SOFI reconstruction. For high frame rates, although the SNRs of collected images decrease, the SOFI reconstructed results exhibit better performance with sufficiently collected image numbers. Fig. 3Comparison of SOFI imaging with different frame rates at constant acquisition time of 1 s. (a)–(e) Generated single frame images of a simulated filamentous network with frame rates of 10, 33, 100, 200, and 600 fps, respectively. (f)–(j) Second-order SOFI images of the simulated filamentous network with frame rates of 10, 33, 100, 200, and 600 fps, respectively. (k) Cross sections indicated by the white dotted lines in (f)–(j). This simulation is performed with shot noise and read noise included for different frame rates. The collected photons for each frame decrease linearly with the increase of frame rates. 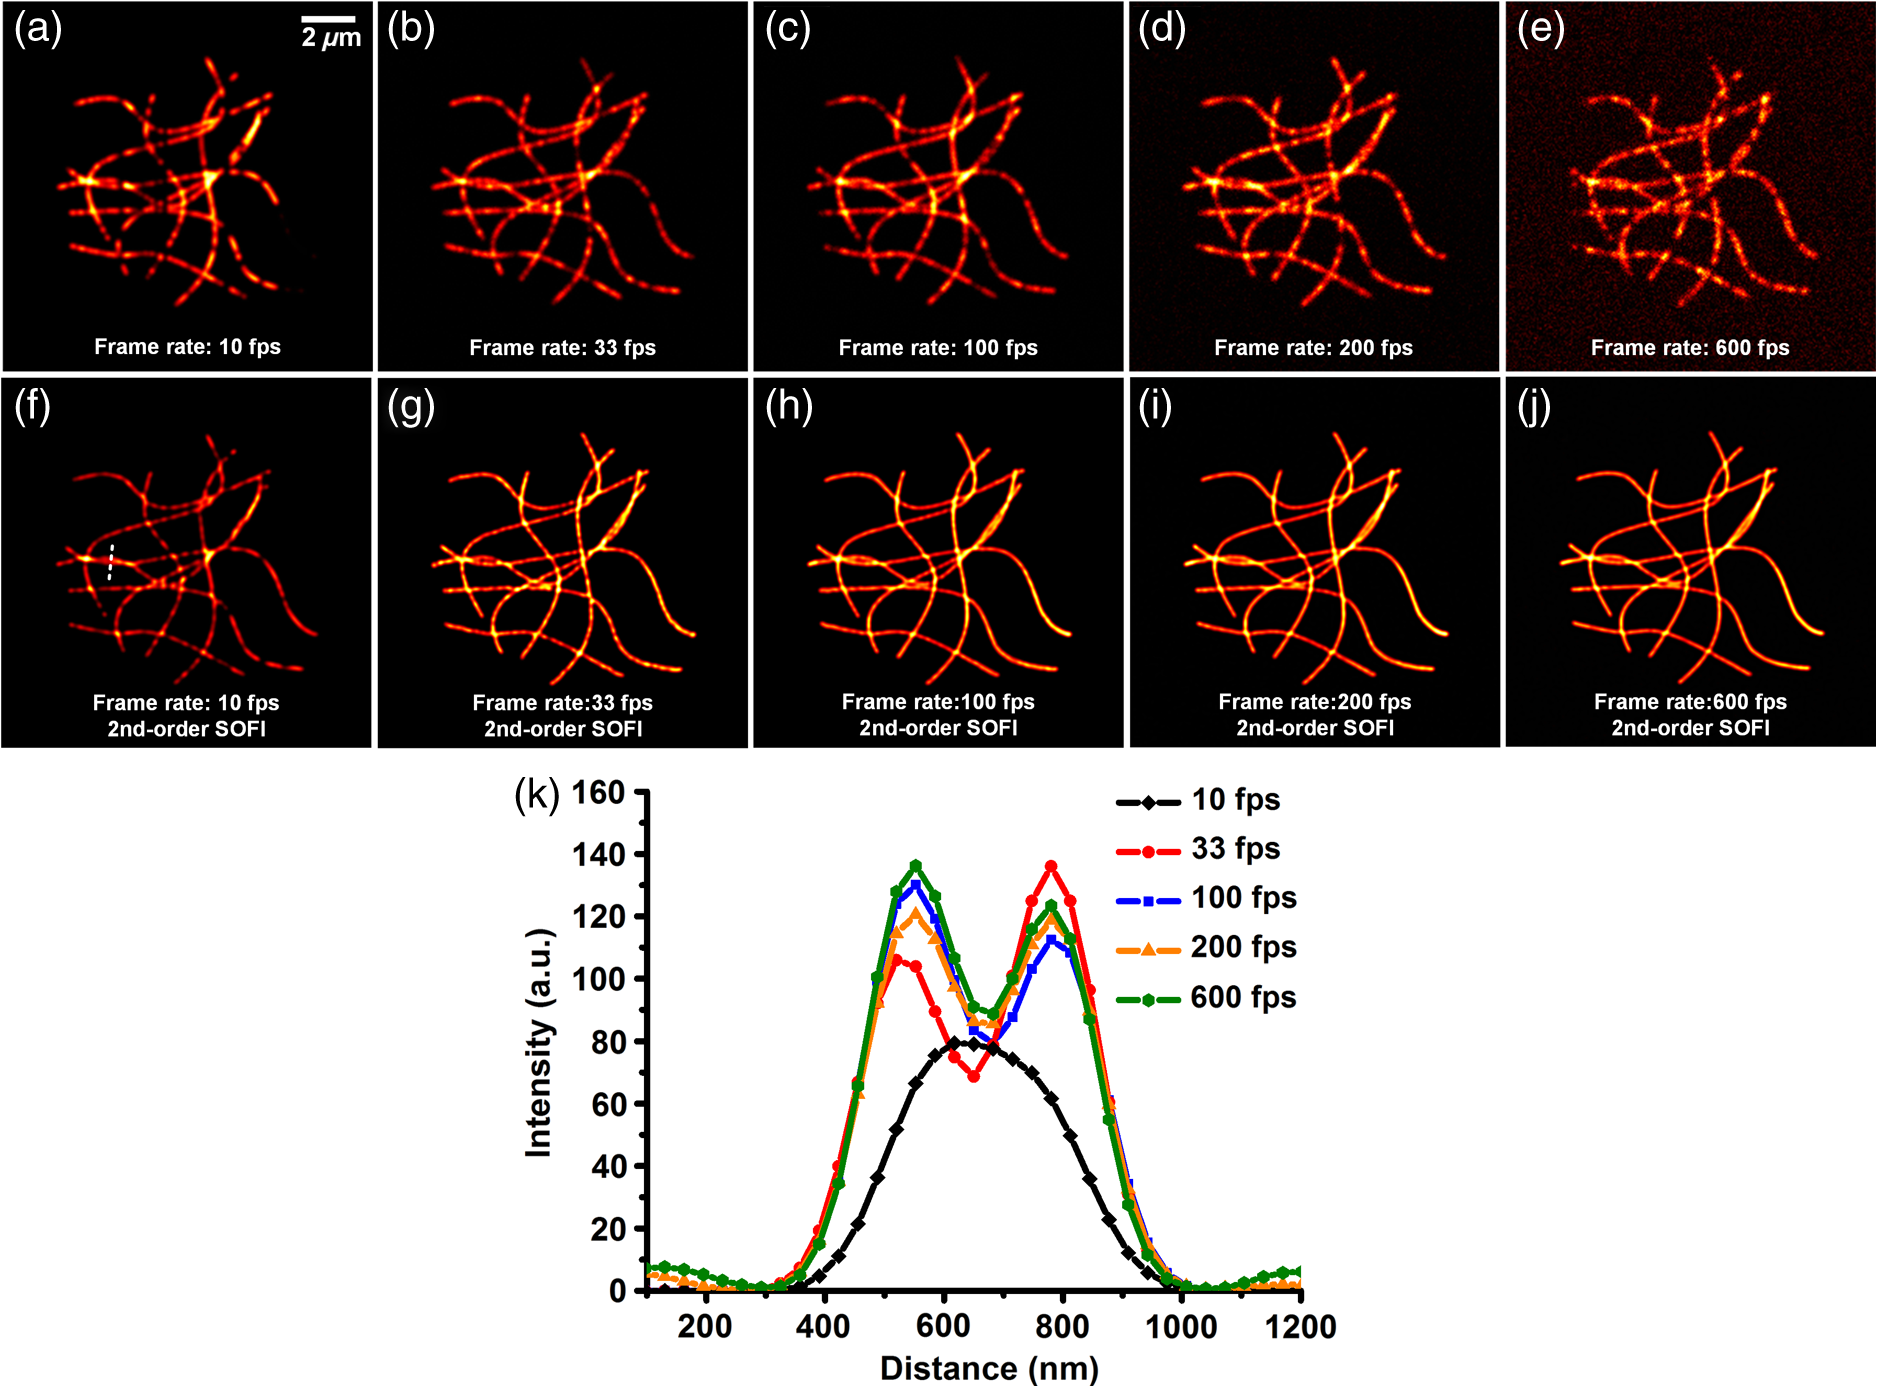 3.3.Comparison of Super-Resolution Optical Fluctuation Imaging Performances Using sCMOS and EMCCD with the Same Optical Pixel Size and the Same Frame RateIn this simulation, we evaluated the influences of multiple types of noise on the quality of SOFI images. A comparison between sCMOS and EMCCD with different noise parameters was implemented as shown in Fig. 4. As sCMOS and EMCCD encompass distinct noise levels at different photon numbers, we conducted this simulation based on the parameters from the elaborate experimental studies by Huang et al.36,37 In the simulation, both pixel-independent (shot noise) and pixel-dependent noises (including fixed pattern noise and read noise) were taken into account.38 Shot noise follows Poisson distribution, while pixel-dependent noise commonly follows Gaussian distribution. Pixel-dependent noise is more significant in sCMOS compared with EMCCD, as the variance, offset, and gain vary from pixel to pixel in sCMOS. For example, as the read noise is independent on photon numbers, the read noise levels for sCMOS and EMCCD are set at 1.5 and , respectively. The fixed pattern noise for sCMOS ranges from 0.4 to as the photon number increases from 1 to 1500, whereas, for EMCCD, it ranges from 0.07 to as photon number increases from 1 to 1500. Details of the generation of the noise in accordance with the experimental noise distributions can be found in Ref. 39. Fig. 4Dependence of the shot noise, read noise, and fixed pattern noise on the photon number for sCMOS (a) and EMCCD (b). The shot noise and fixed pattern noise increase with the photon number for both sCMOS and EMCCD, whereas the read noise is independent of photon number. The sCMOS detector exhibits less shot noise compared with the EMCCD. However, read noise and fixed pattern noise of sCMOS are both larger than that of EMCCD. 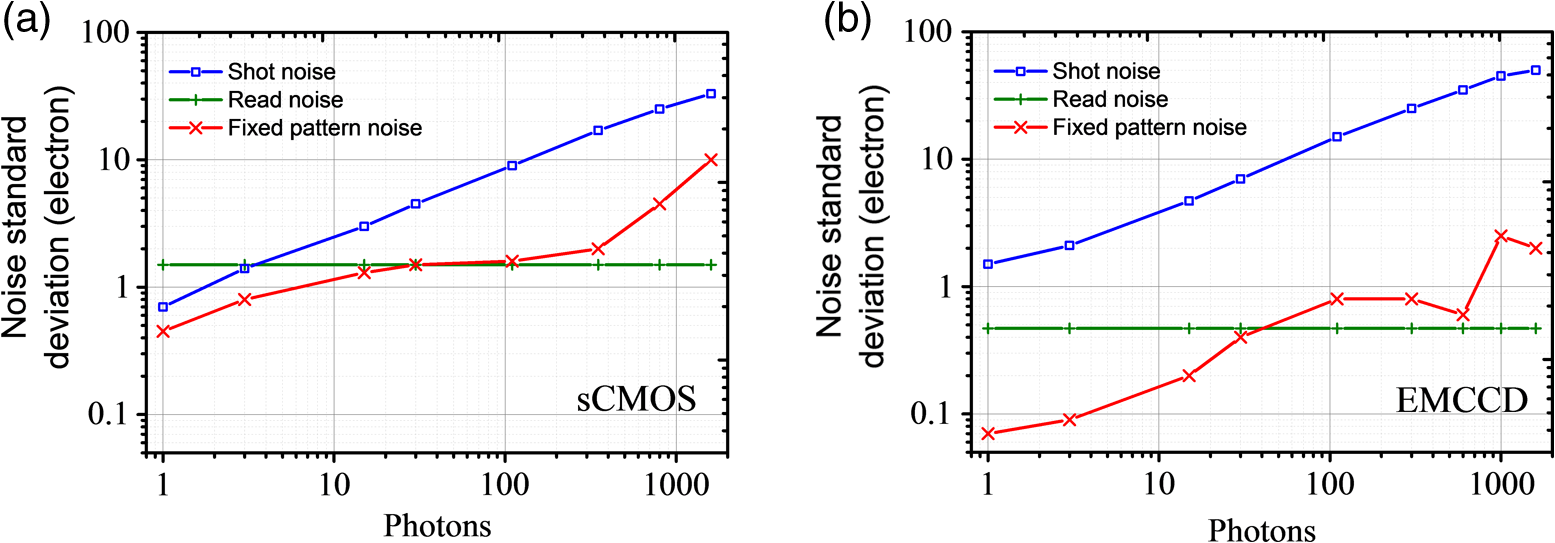 To evaluate the effect of noise on the performance of sCMOS and EMCCD for SOFI imaging, the simulation was conducted for different photon numbers, ranging from 1 to 1500 photons per emitter. As shown in Fig. 5(a), the resolution test object features multiple spatial frequencies at different radial distances. We calculated the corresponding spatial frequency values when the correlation value equals 0.2 to evaluate the frequency transfer capability of sCMOS and EMCCD under different SNRs. The curve describing the cut-off spatial frequency versus SNR is shown in Fig. 5(b). In order to exclude the influence of different pixel sizes for sCMOS and EMCCD, we set the pixel size as 65 nm for both detectors. As can be seen, at both low and high SNR regimes, sCMOS and EMCCD have very similar performances. The differences of noise levels for sCMOS and EMCCD do not have significant influence on SOFI performance. Fig. 5(a) Third-order SOFI image of the resolution rest object using sCMOS camera. Dotted circles indicate the positions of different spatial frequencies. (b) Cut-off frequency vs. SNR for sCMOS and EMCCD. Shot noise, read noise, and fixed pattern noise were taken into account for evaluating the performance of SOFI imaging. The fluorescent wavelength was 625 nm, and a objective with numerical aperture of 1.4 was used in the simulation. 100 frames were simulated for SOFI reconstruction. The quantum efficiencies for sCMOS and EMCCD are 72% and 90%, respectively.  In Fig. 6, we compare SOFI imaging with different gain features for sCMOS and EMCCD. In EMCCD, the gain for each pixel is almost constant. In contrast, the pixels are read out independently for sCMOS. Therefore, the gain for each pixel is different. In this simulation, we set the gain for sCMOS as a random value between 9 and 11 for each pixel, and the gain for EMCCD was set as a constant of 10. From the third-order SOFI reconstructed images in Figs. 6(c) and 6(d) as well as the curve in Fig. 6(e), we can see that the gain differences between sCMOS and EMCCD do not significantly influence the imaging performances of SOFI reconstruction. Fig. 6Comparison of SOFI imaging with different gains for sCMOS and EMCCD. (a) and (b) Generated single frame images of sCMOS and EMCCD. (c) and (d) Third-order SOFI images of sCMOS and EMCCD. (e) Correlation value versus spatial frequency curve with different gains. In this simulation, the gain for EMCCD is set constant as 10. The gain for sCMOS is set as a random value between 9 and 11. 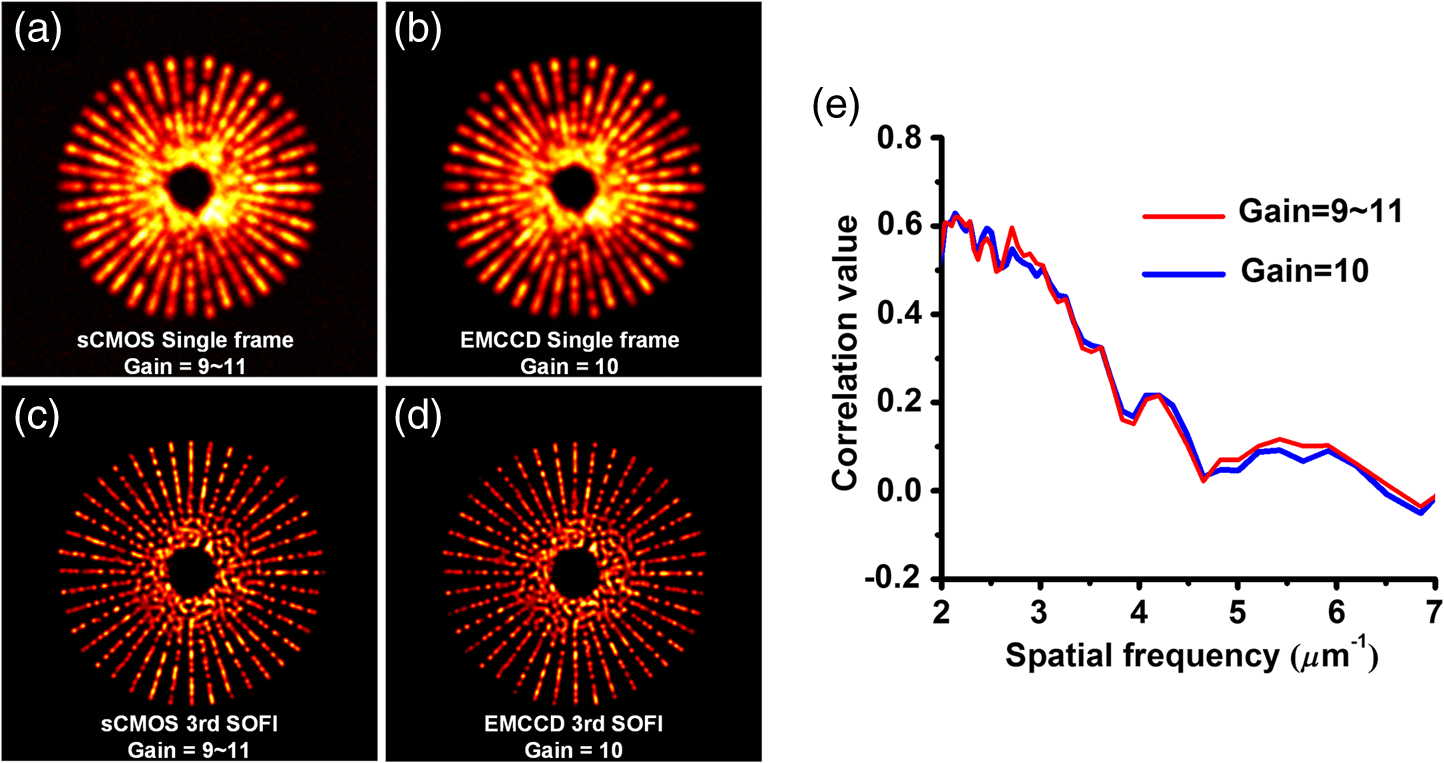 4.Experimental Results4.1.Comparison of the Signal-to-Noise Ratio Between sCMOS and EMCCDAlthough the SNR does not crucially affect the SOFI image quality, it is still a practical consideration to have a reasonable SNR. Unlike STORM/(F)PALM, which normally need to localize single molecule localizations precisely, SOFI does not require such high SNRs.14 We compared the SNR for sCMOS and EMCCD using Qdots 525 particles (Fig. 7). Practically, an SNR of 3 is commonly considered as the lower limit for accurate detection in SML, while for SOFI smaller SNRs may still be acceptable.14 Here, the SNR is defined as where is the signal, is the background, and is the standard deviation of the background. Here, the SNR for 10 and 600 fps roughly correspond to and , respectively.Fig. 7Comparison of SNRs between sCMOS and EMCCD. Upper panel: images with different frame rates using sCMOS and EMCCD on the same Qdot 525 particles. Scale bar: . Lower panel: the SNR values as a function of the frame rate. The EMCCD and sCMOS were cooled to and 0°C, respectively.  In Fig. 7, we can see that the SNR of sCMOS is consistently lower than that of EMCCD. However, for sCMOS, an acceptable SNR can also be achieved for SOFI reconstruction when the frame rate is over 600 fps using relative low illumination intensity. One should note that Qdots are much more photostable than organic dyes and fluorescent proteins, and it is quite difficult to saturate Qdots, practically. Therefore, better SNRs can be practically obtained using higher illumination intensity even for very fast frame rates. Moreover, the data transfer mechanism of sCMOS enables it to have a faster frame rate and larger field-of-view in comparison to EMCCD. Considering the fact that the SNR of sCMOS is only slightly less than EMCCD, we can conclude that sCMOS is more suitable for SOFI when both spatial and temporal resolution are equally important, as SOFI is not critical to SNR.14 Thus, using high brightness probes, e.g., Qdots and Skylan-S, a high spatiotemporal resolution of live-cell SOFI with sCMOS can be obtained.28,29 4.2.Comparison of Super-Resolution Optical Fluctuation Imaging Performance Between sCMOS and EMCCDFor the direct comparison of SOFI performance between sCMOS and EMCCD, the microtubule of COS 7 cell labeled with Qdots 705 on the same region was captured using both sCMOS and EMCCD detector. A total of 1200 frames of raw data (Hamamatsu ORCA Flash 4.0, , about 100 fps in sCMOS and Andor iXon DU-897, , about 20 fps in EMCCD) were obtained for the fourth-order balanced SOFI reconstruction (a mathematical inversion of an equation of second, third, and fourth-order SOFI results together with deconvolution) without drift correction processing. Here, we have used the same optical magnification of 150 (microscopic objective: ; relay lens: ) for the two detectors. As shown in Fig. 8, the SNR in EMCCD was higher than sCMOS. However, because SOFI is insensitive to noise, and because of the higher frame rate of sCMOS (less sample drift), sCMOS SOFI performs even better than the EMCCD counterpart in spatial resolution. Meanwhile, much smoother microtubule structures with improved signal to background ratio can be achieved using sCMOS SOFI with fivefold better temporal resolution and 2.64-fold larger field-of-view compared with the EMCCD SOFI result. Fig. 8Comparison of SOFI performance between sCMOS and EMCCD. (a) Average of 1200 sCMOS raw data. (b) Fourth-order sCMOS SOFI result. (c) Average of 1200 EMCCD raw data. (d) Fourth-order EMCCD SOFI result. (e)–(h) Magnified regions indicated by the white box in (a)–(d), respectively. (i) and (j) Cross sections (the solid lines were fitted using Gaussian fitting) indicated by the white arrows in (e) and (f) and (g) and (h), respectively. Scale bar: in (a)–(d) and in (e)–(h). The EMCCD () and sCMOS were cooled to and 0°C, respectively.  5.Discussions and ConclusionsTaking advantage of the high-order spatiotemporal statistical analysis of blinking emitters on each pixel, SOFI can offer super-resolution imaging without the requirement of high SNR and massive frame numbers for image reconstruction. Aside from dark noise, EMCCD and sCMOS feature distinct pixel correlation noise arising from their unique data read-out mechanisms. For EMCCD, the frame is first transferred to another region of the CCD chip, then read out line by line. As the pixels are read out sequentially, neighboring pixels being read out sequentially may contain correlation noise, which is termed as clocking noise of the EMCCD.40 This effect should be more pronounced within the horizontal of the CCD, than that of vertical, which may lead to slightly lower resolution horizontally comparing with vertical resolution. However, we did not find evidence of such neighboring pixel correlation-induced resolution difference in the published literature. In contrast, the pixels are read out independently for sCMOS. Therefore, the gain for each pixel is different, which may lead to an amplified gain difference in SOFI with sCMOS, as the fluorescence intensity is nonlinearly modulated in SOFI. We have compared the difference in SOFI caused by a random gain for each pixel (for sCMOS) versus a constant gain (for EMCCD). Recently, the availability of some new generation sCMOS cameras, such as Andor Zyla 4.5 and Hamamatsu Flash 4.0, offers faster readout speed using camera link, better sensitivity, and smaller pixel size (). With these characteristics, sCMOS exhibits better performance in SOFI than EMCCD in many cases. It should be noted that, although SOFI is insensitive to SNR in general, the application of very dim fluorescent molecules is inappropriate for SOFI when the , as the correlation noise overwhelms the signal. Thus, for dyes or fluorescent proteins with very low fluorescent brightness when intensity/illumination is controlled to be very low, EMCCD may work for SOFI but not sCMOS. Recently, Hamamatsu has announced a new sCMOS camera (ORCA Flash 4.0 V2) featuring with peak quantum efficiency (QE) of , which holds great potential in further improving the SOFI performance at low light level. Although, in principle, one can further increase the magnification ratio by adding further relay lens into the system to match the corresponding pixel size of an EMCCD camera with that of sCMOS, this is out of the scope of this paper. This is because: (1) the addition of further lenses can induce significant aberration to the imaging system, which degrades the PSF, making the comparison biased; (2) the field-of-view is further compromised when increasing the magnification ratio; and (3) one of the advantages for SOFI is that it does not require specific instrumentation. Thus, we limit the experimental comparison to the direct comparison of installing EMCCD versus sCMOS camera at the imaging plane of the microscope system. SOFI is an important super-resolution technique for its compatibility to wide-field fluorescence microscopy, which does not require specific instrumentation compared with STED/RESOLFT and (S)SIM nanoscopy. Furthermore, SOFI tolerates relative lower signal to background ratio with reduced acquisition time compared with single molecule localization methods (such as PALM/STORM);14,17 therefore, the technical simplicity makes SOFI the method preferred by biologists to easily extend their current research projects to super-resolution imaging.13 Although both EMCCD and sCMOS have been used for SOFI, their performances have not been compared and quantitatively analyzed. Based on the distinct factors of these two types of detectors, such as pixel size, noise characteristics, frame rate, and pixel numbers, we have compared their performances with simulations, and quantitative results are obtained by first analyzing each factor, and then synthesis of all the factors. We further compared their performances experimentally by interchanging EMCCD and sCMOS at the imaging plane. This paper may help the biologists to choose a proper detector in order to upgrade a wide-field microscope to SOFI super-resolution microscopy. From the quantitative analysis and simulations, guidance may be provided on the future development of the imaging detectors tailored or better suited for SOFI. In this paper, we quantitatively compared the performance of sCMOS and EMCCD for SOFI using both simulations and experiments. The results show that fast SOFI super-resolution images can be obtained using probes with high brightness, such as Qdots, organic dyes, and some bright fluorescent proteins,17,29 which was also demonstrated by Zeng28 and Geissbuehler.41 In the simulations, we showed the better SOFI performance by using a smaller pixel size and faster frame rate for image acquisition. In the experiments, we achieved better resolution enhancement using sCMOS-collected image sequence for SOFI reconstruction. The high frame rate, increased pixel number, and small pixel size of sCMOS make it suitable for live-cell imaging with large field-of-view in blinking/fluctuation-based super-resolution microscopy in many cases. In particular, the high pixel numbers of sCMOS gives it the capability of imaging whole cells with high resolution by virtue of SOFI reconstruction. In addition, the pixel-dependent noise in sCMOS presents no more significant contribution to the degradation of SOFI image quality compared with EMCCD. Therefore, taking into account the pixel size, SNR, pixel number, and frame rate, apart from very dim labeling probes and slow dynamics of the imaging structure with a small field-of-view, sCMOS can be a better alternative for fast, large field-of-view live-cell SOFI imaging. AcknowledgmentsWe thank Professor Pingyong Xu and Xi Zhang (Chinese Academy of Sciences) for the helpful discussion, Dr. Chunyan Shan (Peking University) for sample preparation, Mian Wei and Amit Lal (Peking University) for proofreading the manuscript. This paper was supported by the National Natural Science Foundation of China (31327901, 21390412, and 61475010), the National Instrument Development Special Program (2013YQ03065102), and the “863” National High-tech Research and Development Program (SS2015AA020406). ReferencesS. W. Hell,
“Far-field optical nanoscopy,”
Science, 316
(5828), 1153
–1158
(2007). http://dx.doi.org/10.1126/science.1137395 SCIEAS 0036-8075 Google Scholar
S. W. Hell and J. Wichmann,
“Breaking the diffraction resolution limit by stimulated emission: stimulated-emission-depletion fluorescence microscopy,”
Opt. Lett., 19
(11), 780
–782
(1994). http://dx.doi.org/10.1364/OL.19.000780 OPLEDP 0146-9592 Google Scholar
A. Chmyrov et al.,
“Nanoscopy with more than 100,000 ‘doughnuts’,”
Nat. Methods, 10
(8), 737
–740
(2013). http://dx.doi.org/10.1038/nmeth.2556 1548-7091 Google Scholar
W. Yu et al.,
“Super-resolution deep imaging with hollow Bessel beam STED microscopy,”
Laser Photonics Rev., 10
(1), 147
–152
(2016). http://dx.doi.org/10.1002/lpor.201500151 Google Scholar
X. Chen and P. Xi,
“Hundred-thousand light holes push nanoscopy to go parallel,”
Microsc. Res. Tech., 78
(1), 8
–10
(2015). http://dx.doi.org/10.1002/jemt.v78.1 MRTEEO 1059-910X Google Scholar
X. Yang et al.,
“Mirror-enhanced super-resolution microscopy,”
Light Sci. Appl., 5 e16134
(2016). http://dx.doi.org/10.1038/lsa.2016.1134 Google Scholar
M. J. Rust, M. Bates and X. Zhuang,
“Sub-diffraction-limit imaging by stochastic optical reconstruction microscopy (STORM),”
Nat. Methods, 3
(10), 793
–796
(2006). http://dx.doi.org/10.1038/nmeth929 1548-7091 Google Scholar
E. Betzig et al.,
“Imaging intracellular fluorescent proteins at nanometer resolution,”
Science, 313
(5793), 1642
–1645
(2006). http://dx.doi.org/10.1126/science.1127344 SCIEAS 0036-8075 Google Scholar
M. G. Gustafsson,
“Nonlinear structured-illumination microscopy: wide-field fluorescence imaging with theoretically unlimited resolution,”
Proc. Natl. Acad. Sci. U. S. A., 102
(37), 13081
–13086
(2005). http://dx.doi.org/10.1073/pnas.0406877102 Google Scholar
E. H. Rego et al.,
“Nonlinear structured-illumination microscopy with a photoswitchable protein reveals cellular structures at 50-nm resolution,”
Proc. Natl. Acad. Sci. U. S. A., 109
(3), E135
–E143
(2012). http://dx.doi.org/10.1073/pnas.1107547108 Google Scholar
X. Chen et al.,
“Study of RNA polymerase II clustering inside live-cell nuclei using Bayesian nanoscopy,”
ACS Nano, 10
(2), 2447
–2454
(2016). http://dx.doi.org/10.1021/acsnano.5b07257 ANCAC3 1936-0851 Google Scholar
T. Dertinger et al.,
“Fast, background-free, 3D super-resolution optical fluctuation imaging (SOFI),”
Proc. Natl. Acad. Sci. U. S. A., 106
(52), 22287
–22292
(2009). http://dx.doi.org/10.1073/pnas.0907866106 Google Scholar
P. Dedecker et al.,
“Widely accessible method for superresolution fluorescence imaging of living systems,”
Proc. Natl. Acad. Sci. U. S. A., 109
(27), 10909
–10914
(2012). http://dx.doi.org/10.1073/pnas.1204917109 Google Scholar
S. Geissbuehler, C. Dellagiacoma and T. Lasser,
“Comparison between SOFI and STORM,”
Biomed. Opt. Express, 2
(3), 408
–420
(2011). http://dx.doi.org/10.1364/BOE.2.000408 BOEICL 2156-7085 Google Scholar
X. Chen et al.,
“Three dimensional multimodal sub-diffraction imaging with spinning-disk confocal microscopy using blinking/fluctuation probes,”
Nano Res., 8
(7), 2251
–2260
(2015). http://dx.doi.org/10.1007/s12274-015-0736-8 1998-0124 Google Scholar
T. Dertinger et al.,
“SOFI-based 3D superresolution sectioning with a widefield microscope,”
Opt. Nanosc., 1
(2), 2
(2012). http://dx.doi.org/10.1186/2192-2853-1-2 Google Scholar
T. Dertinger et al.,
“Advances in superresolution optical fluctuation imaging (SOFI),”
Q. Rev. Biophys., 46
(2), 210
–221
(2013). http://dx.doi.org/10.1017/S0033583513000036 QURBAW 0033-5835 Google Scholar
T. Dertinger et al.,
“Achieving increased resolution and more pixels with superresolution optical fluctuation imaging (SOFI),”
Opt. Express, 18
(18), 18875
–18885
(2010). http://dx.doi.org/10.1364/OE.18.018875 OPEXFF 1094-4087 Google Scholar
Y. Deng et al.,
“Spatial covariance reconstructive (SCORE) super-resolution fluorescence microscopy,”
PLoS One, 9
(4), e94807
(2014). http://dx.doi.org/10.1371/journal.pone.0094807 POLNCL 1932-6203 Google Scholar
S. Geissbuehler et al.,
“Mapping molecular statistics with balanced super-resolution optical fluctuation imaging (bSOFI),”
Opt. Nanosc., 1
(1), 1
–7
(2012). http://dx.doi.org/10.1186/2192-2853-1-4 Google Scholar
S. Geissbuehler et al.,
“Live-cell multiplane three-dimensional super-resolution optical fluctuation imaging,”
Nat. Commun., 5 5830
(2014). http://dx.doi.org/10.1038/ncomms6830 NCAOBW 2041-1723 Google Scholar
L. Kisley et al.,
“Characterization of porous materials by fluorescence correlation spectroscopy super-resolution optical fluctuation imaging,”
ACS Nano, 9
(9), 9158
–9166
(2015). http://dx.doi.org/10.1021/acsnano.5b03430 ANCAC3 1936-0851 Google Scholar
S. C. Stein et al.,
“Fourier interpolation stochastic optical fluctuation imaging,”
Opt. Express, 23
(12), 16154
–16163
(2015). http://dx.doi.org/10.1364/OE.23.016154 OPEXFF 1094-4087 Google Scholar
W. Vandenberg et al.,
“Model-free uncertainty estimation in stochastical optical fluctuation imaging (SOFI) leads to a doubled temporal resolution,”
Biomed. Opt. Express, 7
(2), 467
–480
(2016). http://dx.doi.org/10.1364/BOE.7.000467 BOEICL 2156-7085 Google Scholar
S. Jiang et al.,
“Enhanced SOFI algorithm achieved with modified optical fluctuating signal extraction,”
Opt. Express, 24
(3), 3037
–3045
(2016). http://dx.doi.org/10.1364/OE.24.003037 OPEXFF 1094-4087 Google Scholar
B. Moeyaert et al.,
“Green-to-red photoconvertible Dronpa mutant for multimodal super-resolution fluorescence microscopy,”
ACS Nano, 8
(2), 1664
–1673
(2014). http://dx.doi.org/10.1021/nn4060144 ANCAC3 1936-0851 Google Scholar
S. Duwé et al.,
“Expression-enhanced fluorescent proteins based on enhanced green fluorescent protein for super-resolution microscopy,”
ACS Nano, 9
(10), 9528
–9541
(2015). http://dx.doi.org/10.1021/acsnano.5b04129 ANCAC3 1936-0851 Google Scholar
Z. Zeng et al.,
“Fast super-resolution imaging with ultra-high labeling density achieved by joint tagging super-resolution optical fluctuation imaging,”
Sci. Rep., 5 8359
(2015). http://dx.doi.org/10.1038/srep08359 SRCEC3 2045-2322 Google Scholar
N. A. Hosny et al.,
“Super-resolution imaging strategies for cell biologists using a spinning disk microscope,”
PloS One, 8
(10), e74604
(2013). http://dx.doi.org/10.1371/journal.pone.0074604 POLNCL 1932-6203 Google Scholar
S. Cho et al.,
“Simple super-resolution live-cell imaging based on diffusion-assisted Forster resonance energy transfer,”
Sci. Rep., 3 1208
(2013). http://dx.doi.org/10.1038/srep01208 SRCEC3 2045-2322 Google Scholar
T. M. Watanabe et al.,
“Real-time nanoscopy by using blinking enhanced quantum dots,”
Biophys. J., 99
(7), L50
–L52
(2010). http://dx.doi.org/10.1016/j.bpj.2010.07.036 BIOJAU 0006-3495 Google Scholar
M. Kim et al.,
“Superresolution imaging with optical fluctuation using speckle patterns illumination,”
Sci. Rep., 5 16525
(2015). http://dx.doi.org/10.1038/srep16525 SRCEC3 2045-2322 Google Scholar
X. Chen et al.,
“Two-photon light-sheet nanoscopy by fluorescence fluctuation correlation analysis,”
Nanoscale, 8 9982
–9987
(2016). http://dx.doi.org/10.1039/C6NR00324A NANOHL 2040-3364 Google Scholar
M. Guizar-Sicairos, S. T. Thurman and J. R. Fienup,
“Efficient subpixel image registration algorithms,”
Opt. Lett., 33
(2), 156
–158
(2008). http://dx.doi.org/10.1364/OL.33.000156 OPLEDP 0146-9592 Google Scholar
T. Dertinger et al.,
“Superresolution optical fluctuation imaging (SOFI),”
Nano-Biotechnology for Biomedical and Diagnostic Research, 17
–21 Springer, Dordrecht, The Netherlands
(2012). Google Scholar
Z.-L. Huang et al.,
“Localization-based super-resolution microscopy with an sCMOS camera,”
Opt. Express, 19
(20), 19156
–19168
(2011). http://dx.doi.org/10.1364/OE.19.019156 OPEXFF 1094-4087 Google Scholar
F. Long, S. Zeng and Z.-L. Huang,
“Localization-based super-resolution microscopy with an sCMOS camera part ii: experimental methodology for comparing sCMOS with EMCCD cameras,”
Opt. Express, 20
(16), 17741
–17759
(2012). http://dx.doi.org/10.1364/OE.20.017741 OPEXFF 1094-4087 Google Scholar
F. Long, S. Zeng and Z. Huang,
“Effects of fixed pattern noise on single molecule localization microscopy,”
Phys. Chem. Chem. Phys., 16
(39), 21586
–21594
(2014). http://dx.doi.org/10.1039/C4CP02280G PPCPFQ 1463-9076 Google Scholar
Zeng Z.,
“Source codes,”
(2015) https://github.com/zhipingzeng/sCMOS-SOFI/tree/master/SourceCodes December ). 2015). Google Scholar
D. Dussault and P. Hoess,
“Noise performance comparison of ICCD with CCD and EMCCD cameras,”
Proc. SPIE, 5563 195
–204
(2004). http://dx.doi.org/10.1117/12.561839 PSISDG 0277-786X Google Scholar
T. Dertinger et al.,
“Superresolution optical fluctuation imaging with organic dyes,”
Angew. Chem. Int. Ed., 49
(49), 9441
–9443
(2010). http://dx.doi.org/10.1002/anie.201004138 Google Scholar
BiographyXuanze Chen received his BS in honor school (major in electronic information engineering) from Nanjing Normal University, Nanjing, China in 2013. Currently, he is working as a PhD candidate in Peking University. His current research interests focus on live-cell super-resolution microscopy and its applications in cell biology, such as super-resolution optical fluctuation imaging (SOFI), Bayesian nanoscopy and single molecule light-sheet fluorescence microscopy. Zhiping Zeng received his BS degree in optical information science and technology and MS degree in optical engineering from Fujian Normal University in 2009 and 2012, respectively. Currently, he is working as a PhD candidate in Peking University. His current research interests include SOFI and the related biomedical applications. Rongqin Li received her BS in school of life science from Sichuan University, Chengdu, Sichuan, China in 2012. Currently, she is working as a PhD candidate in Peking University. Her current research interests focus on super-resolution correlative light and electron microscopy and fluorescence nanoparticle application in cell biology. Boxin Xue received his BS in department of physics from Peking University, Beijing, China in 2012. Currently, he is working as PhD candidate in Peking University. His current research interests focus on developing novel optical manipulation methods, investigating the application of reflected light-sheet microscopy and developing new algorithms for single-molecule localization-based super-resolution methods. Peng Xi is an associate professor in Peking University, China. His current research interest is focused on super-resolution fluorescence microscopy. He has published over 40 scientific papers in peer-reviewed journals such as Light. Sci. Appl., ACS Nano, etc. He is a senior member of OSA. He is on the editorial board of several SCI-indexed journals: Scientific Reports, Microscopy Research and Techniques, Micron, and Chinese Optics Letters. Yujie Sun pursued his PhD degree in University of Pittsburgh. Advised by Professor Gilbert C. Walker, he focused on studies about mechanical properties of biopolymer and synthetic polymeric materials at macroscale and nanoscale using Atomic Force Microscopy. After achieving his PhD, he joined in Dr. Yale E. Goldman’s group at the University of Pennsylvania, School of Medicine. As a member of the Pennsylvania Muscle Institute and Nano/Bio Interface Center, he worked with an interdisciplinary team to solve the puzzle about how molecular motor works using single molecule fluorescence and manipulation techniques. In 2011, he joined in the Biodynamic Optical Imaging Center (BIOPIC), Peking University, as an assistant professor. At BIOPIC, he has been developing advanced single molecule imaging and manipulation techniques to study gene regulation in the cell. |


