
|
|
1.IntroductionOptical microscopy is fundamental to biological and medical research. Recent advances in optical imaging techniques and image-processing algorithms are yielding critical information of biological significance. For example, stochastic optical reconstruction microscopy allows identifying molecules of size below the diffraction limit.1 Partial-wave spectroscopic microscopy permits quantifying the statistics of nanoscale refractive index (RI) fluctuations in a label-free medium.2 Upon implementing multiple illuminations and applying inverse algorithms, three-dimensional (3-D) structures of biological samples can be retrieved from microscope images.3 In the past, experimental techniques have been mandatory in the development of any proposed new optical imaging techniques. However, experiments may entail high costs, lengthy delays, and measurement noise or uncertainties. An adjunct (or even an alternative) approach is to use a rigorous, robust computer simulation tool. Our group developed the open-source software, Angora, which is essentially a “microscope in a computer.”4,5 Angora implements the finite-difference time-domain (FDTD) solution of Maxwell’s equations6 to compute with nanometer resolution the optical electromagnetic field scattered by a nondispersive sample. Via rigorous integral transforms, Angora then propagates this field through an array of apertures and lenses to ultimately synthesize full-color pixels at the microscope’s image plane. However, many biological samples are dispersive, i.e., media having a wavelength-dependent RI. For example, red blood cells selectively absorb light with different wavelengths, and highly dispersive staining agents and metallic biosensors are widely used to create image contrast. In order to accurately simulate the microscopy of such biological samples, we have extended Angora to model dispersive media. Here, we first introduce the FDTD modeling of Drude and Lorentz dispersions in Angora and validate the module. Then, we illustrate how this tool can facilitate the development of optical imaging techniques. 2.Theory2.1.Modeling of DispersionIsotropic, linear dispersion of media can be described by Lorentz and/or Drude models. Lorentz model has been proposed to describe the resonance of nuclei-bounded electrons in dielectrics, and the Drude model has been used to model the transport of free electrons in metals. For a Lorentz medium with pole-pairs, the complex-valued frequency-dependent permittivity, , can be expressed as6 where represents the pole-pair number ranging from 1 to , represents the relative permittivity at infinite frequency, is relative permittivity of the th Lorentz pole-pair at zero frequency minus that at infinite frequency, represents the undamped frequency of the th Lorentz pole-pair, and represents the damping factor of the th Lorentz pole-pair.For a Drude medium with poles, the complex permittivity can be expressed as where represents the pole number changing from 1 to , represents the undamped frequency of the th Drude pole, and represents the relaxation time of the th Drude pole. Examples of the wavelength-dependent permittivity profiles of Lorentz and Drude media are shown in Figs. 1(a) and 1(b), respectively.Fig. 1Relative permittivity profiles of media modeled by (a) a single Lorentz pole-pair and (b) a single Drude pole. 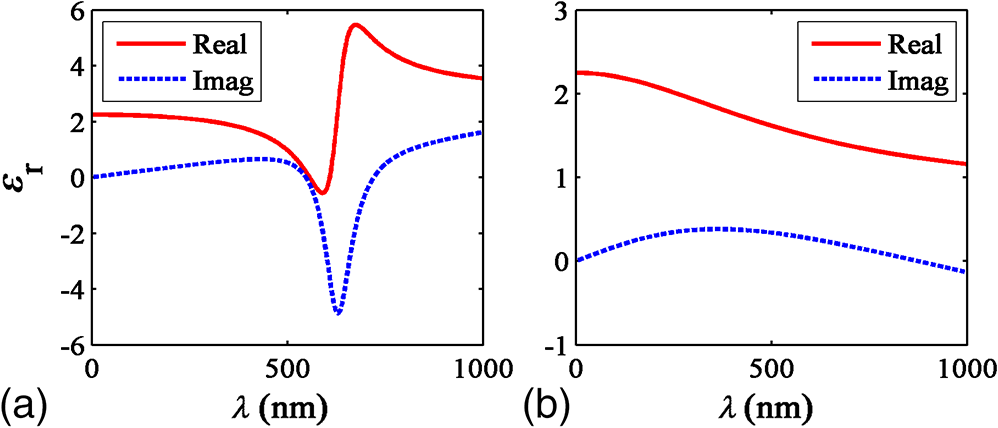 Mathematically, Drude poles can be considered as special cases of Lorentz pole-pairs when is small and is large. Consequently, it is possible to combine the expressions for Lorentz and Drude models. For a combined Lorentzian/Drude model with pole-pairs, the complex permittivity can be rewritten as whereThis combination simplifies the implementation of Lorentz and Drude models in FDTD. 2.2.Finite-Difference Time-Domain ImplementationThe combined Lorentz/Drude model was integrated into the FDTD algorithm by introducing polarization current and updating at each time step.6 To update at the ()st time-step where Here, is the FDTD time-step, and is the vacuum permittivity.To update the electric field at ()st time-step where and is the electric conductivity.Compared to FDTD implementation without dispersion, this implementation utilizes electric field at two time steps before and introduces extra a time-marching variable (), thus requiring more computational time and memory. For a material modeled with no dispersion, updating and storing each -field requires 11 floating-point operations and three words of memory, while for a material modeled with one Drude/Lorentz pole pair, this needs 17 floating-point operations and seven words of memory. 2.3.Components of Angora’s Optical Microscopy Simulation SystemIn order to model an optical microscope and computationally synthesize images of a sample, Angora employs four system components (Fig. 2): (1) an illumination component that injects a light source (point source, plane wave, focused beam, partially coherent light, and so on) as an electromagnetic wave into the scattering space; (2) a scattering component, where the object of interest interacts with the impinging electromagnetic field via time-marching of the full-vector Maxwell’s curl equations within a 3-D nanometer-resolution FDTD space lattice; (3) a collection component that integrates/transforms the FDTD-computed scattered electromagnetic field from the near zone to the far field; and (4) a refocusing component that redirects the scattered electromagnetic field in the optical far-field onto a virtual image plane and synthesizes the microscope image of the object color pixel by color pixel. 3.Methods and Materials3.1.Angora SimulationsAs stated above, the Angora computational microscopy software employs FDTD at its heart to compute optical interactions with arbitrary material samples using the full-vector Maxwell’s equations solved on a 3-D nanometer-resolution space lattice. All simulations in this paper were performed using Angora.4,7 FDTD has become one of the most popular numerical methods to solve Maxwell’s equations for electromagnetic wave interactions with material structures. With FDTD, the continuous 3-D electromagnetic field is projected onto a pair of discrete spatially interleaved lattices: one for the electric field vector components and one for the magnetic field vector components. FDTD is initialized by mapping the spatially inhomogeneous material properties of the sample to be imaged onto these dual lattices. Then, via Maxwell’s curl equations, FDTD time-marches all of the electric and magnetic field vector components in the interaction volume, thereby closely emulating the naturally occurring electromagnetic wave propagation and scattering processes. Compared to other numerical techniques such as the finite-element method and the method of moments, FDTD allows models of significantly greater complexity, i.e., number of vector field components, to be implemented. Currently, FDTD’s simulation horizon is on the order of one-trillion () vector field components when run on a national-class supercomputer such as Blue Waters at NCSA and Mira at Argonne National Laboratory. 3.1.1.Far-field scattering by a 320-nm diameter dispersive microsphere in free spaceIn order to evaluate Angora’s accuracy when applied to calculate light scattered from dispersive media, we first modeled far-field scattering by a single dispersive microsphere in infinite free space (Fig. 3). The microsphere, assumed to have a diameter of 320 nm and an electric conductivity , was placed at the center of a 3-D cubic-cell FDTD space lattice of uniform cell size terminated on all sides by a 5-cell-thick convolutional perfectly matched layer absorbing outer boundary. For all the simulations in this paper, cell sizes were selected to be sufficiently small so that numerical dispersion can be ignored and the courant number was 0.98. The 320-nm diameter microsphere was illuminated by a broadband optical plane wave (wavelength range to 800 nm). To assess the accuracy of the modeling procedure, the normalized scattered optical electric field in the far zone was computed as a function of angle and wavelength and compared with the exact Mie series.8 The microsphere medium was characterized by three distinct dispersion models: triple-Drude, triple-Lorentz, and Drude-Lorentz, as shown in columns 1, 2, and 3 of Table 1, respectively. Using 100-CPU processors (Intel Sandybridge E2670) and 8 GB of memory, these three simulations took 1 h to finish. Table 1Model parameters for the dispersive media used in the validation studies. ωp has a unit of rad/s and δp has a unit of s−1. For the Drude model, δp=1/τp.
3.1.2.Imaging of a single 1-μm diameter gold microsphere on a glass slideAngora’s complete computational imaging procedure was tested by comparing its synthesized microscope image of a -diameter gold microsphere on a glass slide (RI to that obtained using a laboratory microscope. The Drude + double-Lorentz model parameters assumed for gold9 are listed in column 4 of Table 1. The FDTD space lattice employed uniform cubic cells of size . The microsphere was illuminated by a broadband plane wave ( to 700 nm) from above, and its reflection microscope images were calculated at 30 discrete wavelengths within this range. A full-color image of the gold microsphere was then synthesized from these images via CIE color-matching functions.10 Using 100 CPU processors and 64 GB of memory, this simulation took 5 h to finish. 3.1.3.Imaging of a pair of 60-nm-diameter gold nanospheres in infinite free spaceThis involved an investigation of how Angora might be applied to distinguish between pairs of closely spaced (but noncontacting) gold nanoparticles (GNPs) located either parallel or transverse to the propagation direction of the illuminating optical wave. Here, the midpoint in space between the adjacent nanospheres was placed at the center of an open-region 3-D FDTD space lattice employing uniform cubic cells of size (indicated to be sufficiently fine by convergence studies). The collection numerical aperture (NA) was set as 0.6. The nanosphere pairs were illuminated by a broadband plane wave ( to 750 nm), and their reflection microscope images were calculated at 30 discrete wavelengths within this range. Full-color images of the nanosphere pairs were then synthesized from these images via CIE color matching functions. Using 100-CPU processors and 1 GB of memory, these simulations took 15 min to finish. 3.2.Laboratory Measurements3.2.1.Gold nanosphere sample preparationA glass slide was treated with a plasmon cleaner (PELCO easiGlow, Ted Pella, Redding, California) for 1 min to clean the surface. Prior to depositing, the gold nanosphere solution (1000 nm spherical nanoparticles, Nanopartz, Loveland, Colorado) was vortexed for 3 min at maximum speed to avoid clustering. A droplet of gold nanosphere solution was then pipetted gently onto the glass slide and air dried for later measurement. 3.2.2.Microscopy equipment and proceduresExperimental data were collected using a custom built Epi-illumination spectral microscope.11 Specifically, visible light from a xenon lamp (66902 100W, Oriel Instruments, Stratford, Connecticut) was spectrally tuned to a single wavelength by an acousto-optic tunable filter (HIS-300, Gooch & Housego, Orlando, Florida) before illuminating a sample. A objective lens (, LUCPlanFL N, Olympus, Center Valley, Pennsylvania) was used for illumination and collection of the backscattered light. Images were acquired using a CMOS camera (Hamamatsu ORCA-Flash 2.8, Bridgewater, New Jersey). Two electronic apertures (62281, Newport Corporation, Irvine, California) in the illumination and collection portions of the light path conjugate to the objective back focal plane allowed adjustment of the illumination and collection NA of the system. The instrument was controlled with a custom software interface developed in MATLAB® (MathWorks, Natick, Massachusetts). Spectral data were acquired by tuning the AOTF over a range of desired wavelengths and acquiring an image with the camera at each one, yielding a spectral data cube (). 4.Results4.1.Comparison of the Angora-Computed Far-Field with Mie TheoryScattering from a dispersive material sphere can be precisely modeled by the Mie theory8 one illuminating wavelength at a time. This permitted validation of Angora’s FDTD kernel by comparing it to the Mie theory on its computed far-zone scattered electric field for the 320-nm diameter microsphere of Fig. 3. These results are summarized in Fig. 4. Fig. 4(a, b, c) Triple-Drude dispersion assumed for the 320-nm-diameter microsphere of Fig. 3; (d, e, f) triple-Lorentz dispersion; (g, h, i) Drude–Lorentz dispersion. (a, d, g) Complex permittivity versus for each case; (b, e, h) for , Angora versus Mie results for the far-zone scattered electric field versus at ; (c, f, i) Angora versus Mie results for the far-zone backscattered electric field versus .  Figure 4(a) shows the wavelength-dependent complex permittivity of the triple-Drude dispersion of column 1 of Table 1 initially assumed for the 320-nm diameter microsphere. Figure 4(b) shows for a single wavelength of 532 nm the corresponding Angora versus Mie comparison of the computed far-zone scattered electric field (normalized by the distance, , from the microsphere) over the range of angles , to 180 deg. Figure 4(c) compares the Angora versus Mie computed far-zone scattered electric field in the backscattering direction (, ) over the wavelength range to 800 nm. Figures 4(d)–4(f) show results by analogy to those of Figs. 4(a)–4(c) but for the case of the triple-Lorentz dispersion of column 2 of Table 1 assumed for the 320-nm diameter microsphere. Figures 4(g)–4(i) show results again by analogy to those of Figs. 4(a)–4(c) but for the case of the Drude–Lorentz dispersion of column 3 of Table 1 assumed for the 320-nm-diameter microsphere. In each case shown in Fig. 4, the Angora-computed far-zone scattered electric field matches very well with the Mie theory, with the mean percent error over all angles or wavelengths below 1%. 4.2.Comparison with Experiment of the Angora-Synthesized Image of a Gold Microsphere on a Glass SlideFigure 5 shows full-color bright-field reflection images over the wavelength range to 700 nm of a -diameter gold microsphere on a glass slide, as synthesized by Angora [Fig. 5(a)] and as obtained by experiment [Fig. 5(b)]. For the Angora model, gold was assumed to have the Drude + double-Lorentz model parameters listed in column 4 of Table 1, resulting in the complex permittivity profile versus graphed in Fig. 5(c). Fig. 5Bright-field full-color reflection images of a -diameter gold microsphere on a glass slide (a) synthesized by Angora and (b) experimentally obtained; (c) complex-valued permittivity profile of gold in the optica range assumed in the Angora model; (d) comparison of Angora-computed and experimentally measured wavelength-dependent spectra at the center pixels of the microsphere.  In this study, all image intensities were normalized by reflection from the air–glass interface. In addition, RGB images were reconstructed from the spectral components of the Angora-synthesized and experimentally measured reflection microscope images using CIE color matching functions. We see that, despite experimental imperfections primarily due to the gold microsphere having a slightly nonspherical shape, the color image synthesized by Angora agreed well with that obtained experimentally. Furthermore, a good match was observed between the Angora-computed and experimentally measured wavelength-dependent center pixel spectra of the gold microsphere [Fig. 5(d)]. On the basis of the analytical and experimental comparisons reviewed above, we conclude that, with the incorporation of multipole dispersion modeling into its FDTD kernel, Angora can now accurately simulate light scattering from a dispersive sample and, furthermore, accurately synthesize microscope images of samples having known dispersions. 4.3.Angora Studies of Pairs of 60-nm-Diameter Gold Nanoparticles Aligned either Transverse or Parallel to the Incident IlluminationThis section discusses an example that indicates how Angora can facilitate the development of optical imaging technologies for biological and medical research. GNPs have been exploited for biorelated applications from sensing and diagnosis12,13 to cancer treatment.14,15 While optical imaging techniques were used to localize and quantify GNPs,16 detailed information about GNPs’ quantity and location under diffraction limits are missing. More fundamental to this problem is how to distinguish a single GNP from two GNPs close to each other. Thus, an imaging technique that can distinguish them would provide additional GNP information under diffraction limits and hence benefit the investigation of diverse biological processes. Here, we propose to use bright-field white-light microscopy to achieve this goal and Angora simulations for synthesizing and analyzing the microscope images. In order to investigate whether and how we can distinguish a single GNP from a pair of adjacent GNPs located within one diffraction-limited spot by bright-field white-light microscopy, the most straightforward method is to perform numerical simulations for both cases and compare their images. To this end, we applied Angora to synthesize bright-field microscope images of a single 60-nm-diameter gold nanosphere and a pair of 60-nm-diameter gold nanospheres having a variable orientation relative to the illumination direction. Angora-synthesized microscope images at discrete wavelengths were transformed to RGB color images by CIE color matching functions. Each of these images was then normalized by its maximum intensity. Referring to the first row of Angora-synthesized images in Fig. 6, we found that, for a pair of 60-nm-diameter gold nanospheres located within one diffraction-limited spot along the -axis in a transverse () plane relative to the -directed illumination, the pair’s image color is indistinguishable from that of a single 60-nm-diameter gold nanosphere, regardless of the distance between two nanospheres. Furthermore, upon comparing the spectrum at the pixel located midway between the two gold nanospheres with the spectrum at the center of a single nanosphere, we see from Fig. 7(a) that, while the amplitude of the spectrum is greater than that of a single nanosphere, the shape of the spectrum is quite similar. Increasing the distance between the nanosphere pair having this transverse orientation does not significantly alter the amplitude or shape of their center-pixel spectrum. Fig. 6Angora-synthesized bright-field full-color reflection images of a single gold nanosphere or a pair of gold nanospheres located along the -axis (first row) and along the -axis (second row). The numbers represent the distance in nm between the adjacent surfaces of the nanospheres in each pair. 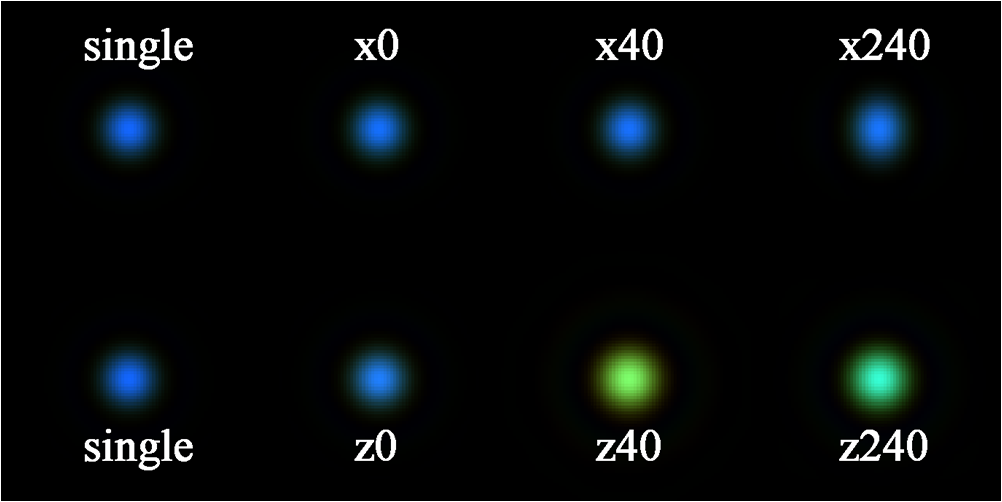 Fig. 7Comparison of Angora-computed wavelength-dependent center-pixel spectra of a single gold nanosphere or a pair of gold nanospheres (a) located along the -axis and (b) located along the -axis. The numbers represent the distance in nm between the adjacent surfaces of the nanospheres in each pair.  In marked contrast, as shown in the second row of images in Fig. 6, we found that if the pair of 60-nm-diameter gold nanospheres is located along the -axis, i.e., parallel to the illumination, the pair’s image color differs significantly from that of a single 60-nm-diameter nanosphere. Furthermore, as shown in Fig. 7(b), both the amplitude and shape of the pair’s spectrum vary significantly as the -distance between the adjacent nanosphere surfaces changes. We believe that this contrasting spectral behavior originates from interference of the scattered light between the pair of nanospheres. Due to the moderate NA of 0.6 used in this study, the observed interference phenomenon would be collected optimally by the aperture if the pair were located along the -axis than if located along an plane. Since the spectral frequency of the interference is dependent upon the optical path difference, i.e., the distance between the two nanospheres, the change of spectral shape would only appear when the nanosphere pair is positioned along the -direction of illumination. In addition, for the nanosphere pair located along the -axis, the upper nanosphere would perturb the field illuminating the nanosphere below it. Altogether, by analyzing Angora-synthesized microscope images and center-pixel spectra, we have established that it is theoretically possible to distinguish a pair of gold nanospheres within a diffraction-limited spot from a single nanosphere merely based on bright-field spectroscopic microscope images. It is now clear that bright-field microscope images and center-pixel spectra of nanospheres aligned along the direction of illumination can be distinguished more readily from a single nanosphere than when located in a plane transverse to the illumination. This observation should provide useful guidance for the development of more accurate spectroscopic microscopy techniques for imaging GNPs. 5.DiscussionThis paper reports the further development of the open-source computational microscopy software, Angora, a “microscope in a computer,” to permit accurate modeling of samples having complicated dispersion properties. This now allows the computational synthesis of microscope images of most common biological samples. We first described means to integrate media dispersion into the FDTD Maxwell’s equations solver that forms the heart of Angora, and then discussed the results of both analytical and experimental validations. We then reported a demonstration of how Angora can facilitate the development of optical imaging techniques with a case study. While commercial FDTD software has incorporated Lorentz/Drude dispersion to model limited type of optical modalities,17 open-source FDTD packages have not offered the convenience of simulating optical images of dispersive materials.18,19 To the best of our knowledge, Angora, with a full range of built-in models of optical modalities, is the first open-source FDTD software that enables simulating optical images of dispersive samples. Overall, now upgraded to rigorously model optical interactions with complex dispersive media, Angora can facilitate the development of new optical imaging techniques for most common biorelated materials. Angora retains all of its previous favorable characteristics: (1) high accuracy and robustness, afforded by its FDTD Maxwell’s equations solver and the rigorous integral transforms used to propagate the FDTD-computed near fields all the way to synthesize full-color pixels at the image plane; (2) great flexibility in modeling samples since the optical properties of inhomogeneous sample media are directly mapped onto a uniform spatial grid having a resolution selected by the modeler; (3) great flexibility in modeling optical sources (e.g., partially coherent light and focused laser beams) and microscopy methods (e.g., bright field, dark field, and phase contrast); (4) free of noise and experimental artifacts so that sources of experimental errors can be more readily spotted and evaluated; and (5) portability to processor arrays ranging from laboratory clusters to national-class supercomputers, thereby allowing a steady increase in modeling capability as the availability of computer resources improves. We believe that Angora, available to anyone, anywhere, via free download, can become an important adjunct to laboratories engaged in the advancement of optical microscopy. AcknowledgmentsThis study was supported by the National Institutes of Health (NIH) (R01CA155284, R01CA165309, and R01EB016983) and the National Science Foundation (NSF) (EFRI-1240416). The FDTD simulations were made possible by a computational allocation from the Quest high-performance computing facility at Northwestern University. ReferencesM. J. Rust, M. Bates and X. Zhuang,
“Sub-diffraction-limit imaging by stochastic optical reconstruction microscopy (STORM),”
Nat. Methods, 3
(10), 793
–796
(2006). http://dx.doi.org/10.1038/nmeth929 1548-7091 Google Scholar
L. Cherkezyan et al.,
“Interferometric spectroscopy of scattered light can quantify the statistics of subdifractional refractive-index fluctuations,”
Phys. Rev. Lett., 111 033903
(2013). http://dx.doi.org/10.1103/PhysRevLett.111.033903 PRLTAO 0031-9007 Google Scholar
L. Tian, J. Wang and L. Waller,
“3D differential phase-contrast microscopy with computational illumination using an LED array,”
Opt. Lett., 39 1326
–1329
(2014). http://dx.doi.org/10.1364/OL.39.001326 OPLEDP 0146-9592 Google Scholar
I. R. Capoglu,
“ANGORA: a free software package for finite-difference time-domain (FDTD) electromagnetic simulation,”
(2012) http://www.angorafdtd.org , ( April 2012). Google Scholar
D. Zhang et al.,
“Advances in computational microscopy are facilitating accurate screening techniques for multiple early-stage human cancers,”
in Imaging and Applied Optics 2015, OSA Technical Digest,
(2015). Google Scholar
A. Taflove and S. C. Hagness, Computational Electrodynamics: the Finite-Difference Time-Domain Method, 3rd ed.Artech, Norwood, MA
(2005). Google Scholar
I. R. Capoglu et al.,
“The microscope in a computer: image synthesis from three-dimensional full-vector solutions of Maxwell’s equations at the nanometer scale,”
Prog. Opt., 57 1
–91
(2012). http://dx.doi.org/10.1016/B978-0-44-459422-8.00001-1 POPTAN 0079-6638 Google Scholar
A. Ishimaru, Wave Propagation and Scattering in Random Media, 2 Academic Press, New York
(1978). Google Scholar
G. Wiederrecht, Handbook of Nanoscale Optics and Electronics, Academic Press, New York
(2010). Google Scholar
Commission Internationale de l’Eclairage Proceedings, 1931, Cambridge University Press, Cambridge
(1932). Google Scholar
J. Chandler et al.,
“High-speed spectral nanocytology for early cancer screening,”
J. Biomed. Opt., 18
(11), 117002
(2013). http://dx.doi.org/10.1117/1.JBO.18.11.117002 JBOPFO 1083-3668 Google Scholar
K. Saha et al.,
“Gold nanoparticles in chemical and biological sensing,”
Chem. Rev., 112
(5), 2739
–2779
(2012). http://dx.doi.org/10.1021/cr2001178 CHREAY 0009-2665 Google Scholar
J. Shi et al.,
“A fluorescence resonance energy transfer (FRET) biosensor based on graphene quantum dots (GQDs) and gold nanoparticles (AuNPs) for the detection of mecA gene sequence of Staphylococcus aureus,”
Biosens. Bioelectron., 67 595
–600
(2015). http://dx.doi.org/10.1016/j.bios.2014.09.059 BBIOE4 0956-5663 Google Scholar
H. Xiaohua et al.,
“Cancer cell imaging and photothermal therapy in near-infrared region by using gold nanorods,”
J. Am. Chem. Soc., 128 2115
–2120
(2006). http://dx.doi.org/10.1021/ja057254a JACSAT 0002-7863 Google Scholar
L. C. Kennedy et al.,
“A new era for cancer treatment: gold-nanoparticle-mediated thermal therapies,”
Small, 7
(2), 169
–183
(2011). http://dx.doi.org/10.1002/smll.v7.2 SMALBC 1613-6810 Google Scholar
R. A. Sperling et al.,
“Biological applications of gold nanoparticles,”
Chem. Soc. Rev., 37
(9), 1896
–1908
(2008). http://dx.doi.org/10.1039/b712170a CSRVBR 0306-0012 Google Scholar
S. Tanev, V. V. Tuchin and J. Pond,
“Simulation and modeling of optical phase contrast microscope cellular nanobioimaging,”
Proc. SPIE, 7027 702716
(2015). http://dx.doi.org/10.1117/12.822518 Google Scholar
A. F. Oskooi et al.,
“MEEP: a flexible free-software package for electromagnetic simulations by the FDTD method,”
Comput. Phys. Commun., 181 687
–702
(2010). http://dx.doi.org/10.1016/j.cpc.2009.11.008 CPHCBZ 0010-4655 Google Scholar
P. Klapetek and M. Valtr,
“Near-field optical microscopy simulations using graphics processing units,”
Surf. Interface Anal., 42 1109
–1113
(2010). http://dx.doi.org/10.1002/sia.v42:6/7 SIANDQ 0142-2421 Google Scholar
BiographyDi Zhang received his BS degree in electrical engineering from Beijing Jiaotong University, China, in 2009. He is currently working toward his PhD in biomedical engineering at Northwestern University, Evanston, Illinois, USA. His research interests include computational electromagnetics for modeling light interaction with biological tissue and optical imaging techniques for early stage cancer detection. Ilker Capoglu received his PhD degree in electrical and computer engineering from the Georgia Institute of Technology, Atlanta, USA, in 2007. He has since been employed as a postdoctoral fellow in the Biomedical Engineering Department of Northwestern University, Evanston, Illinois, USA. His research interests are time-domain methods in numerical electromagnetics, numerical modeling of electromagnetic wave propagation in multilayered media, numerical electromagnetic simulation of optical systems, and numerical simulation of the scattering of light from inhomogeneous/random media. Yue Li received her BS degree in materials physics from Shanghai Jiao Tong University, Shanghai, China, in 2013. She is currently pursuing a PhD in applied physics at Northwestern University, Evanston, Illinois, USA. Her research focuses on correlative microscopy to reveal the nanostructure of biological samples in their native states. Lusik Cherkezyan is a postdoctoral fellow in the Department of Biomedical Engineering at Northwestern University, Illinois, USA, where she also received her PhD. Her work focuses on the use of physics and engineering principles for the study of biological systems. In particular, she is interested in the technology development for the spectroscopic quantification of biomaterials at nanometer scales. Her work has been published in multiple high-profile journals, including Physical Review Letters, BMC Cancer, Optics Letters, and Endoscopy. John Chandler received BS degrees in mechanical engineering and materials science and engineering from the University of Washington in 2011. Since then, he has been a PhD student in the biomedical engineering department at Northwestern University. He is conducting research on spectroscopic and super-resolution microscopy techniques supported by an NSF Graduate Research Fellowship. Graham Spicer received BS degrees in physics and chemical engineering from Carnegie Mellon University, Pittsburgh, Pennsylvania, USA, in 2013. He is currently pursuing a PhD in chemical engineering from Northwestern University, Evanston, Illinois, USA. His current research interests include the use of optical coherence tomography to study tissue ultrastructure and implanted biomaterials for the staging of breast cancer. Hariharan Subramanian received his PhD in biomedical engineering from Northwestern University and is currently a research professor of biomedical engineering at Northwestern University. He is the cofounder and chief technology officer of NanoCytomics ( www. nano-cytomics.com), an in vitro medical diagnostic company developing screening strategies for different types of cancers (e.g., lung, colon, and prostate). He has considerable experience in biomedical optics, cancer biology, and clinical research with numerous publications appearing in leading peer-reviewed journals. Allen Taflove is a professor in the Department of Electrical Engineering and Computer Science of Northwestern University, Evanston, Illinois, USA. Since 1972, he has pioneered finite-difference time-domain computational solutions of Maxwell’s equations, for which he received the 2014 IEEE Electromagnetics Award. His major publication Computational Electrodynamics: The Finite-Difference Time-Domain Method is the seventh most-cited book in physics. Vadim Backman is the Walter Dill Scott professor of biomedical engineering at Northwestern University and a program leader at the Robert H. Lurie Comprehensive Cancer Center in Chicago, Illinois, USA. An internationally renowned expert in biomedical optics, he develops revolutionary nanoscale imaging technologies that allow researchers to explore previously intractable questions in biology, disease diagnosis, and progression, with a focus on detecting cancer at its earliest and most treatable stages. |


