

|
|
1.IntroductionMelanoma is the most aggressive type of skin cancer, characterized by radial and then vertical growth phases. During the latter, the tumor becomes thicker and develops dense neovascularization that has been correlated with poor prognosis and overall survival, tumor ulceration, and increased rate of recurrence.1 The high melanin pigmentation results in strong visible-light absorption, so that optical imaging techniques are limited to probing only near the tumor surface, which is inadequate to evaluate the microvascular density. A potential solution lies with optical coherence tomography (OCT), a noninvasive optical imaging technique that enables three-dimensional (3-D) depth-resolved cross-sectional imaging of subsurface tissue microstructure at spatial resolution approaching optical microscopy by detecting backscattered light using the principle of low coherence interferometry.2 OCT is commonly performed at the central wavelengths of or , and the latter choice is more appropriate for this study because of decreasing melanin absorption in the near-infrared (NIR). In addition to high absorption, melanin exhibits light scattering, due to its granular structure in the melanoma cells (melanocytes). To reduce the light-attenuating effects of scattering in tissue, the use of optical clearing agents (OCAs) has been investigated.2 OCA is typically a hyperosmotic fluid with an optical refractive index of , which decreases refraction mismatch at microscopic interfaces in cells and tissues. The effects of OCA have been reported mainly in healthy in vivo and tumor ex vivo tissues,2 in an effort to improve the imaging performance of laser speckle contrast imaging,3 photoacoustic microscopy,4 confocal microscopy,5,6 and OCT.3,7 However, clearing has not been explored to aid in vivo melanoma optical diagnostics. Here, the effects of optical clearing in a preclinical melanoma model in vivo are investigated for the first time using NIR-OCT, together with white-light diffuse reflectance spectroscopy (DRS)8 as an independent measure of changes in tissue optical properties. 2.Materials and Methods2.1.Melanoma Model and Imaging PreparationsB16F10 pigmented murine melanoma cells were purchased from American Type Culture Collection and cultured in Dulbecco modified Eagle’s medium supplemented with 10% fetal bovine serum and antibiotics at 37°C and 5% . Cutaneous melanoma was induced by intradermal injection of cells in the flank of six- to seven-week-old nude mice (J:NU homozygous, Jackson Labs) using a 30G needle. The mice were kept in microisolator cages with access to food and water ad libitum. All procedures were approved by the Institutional Animal Care Committee (University Health Network, Toronto, Canada: AUP protocol 4401.1). Diffuse reflectance and OCT imaging were performed four to seven days after tumor cell injection, during the vertical growth phase when the tumors were in diameter and 1 to 2 mm in depth. The mice were anesthetized using 5% isoflurane and maintained using 2% isoflurane delivered through a mask. The animal was placed, on a heating pad to maintain body temperature, on a three-axis micropositioning stage. The paw on the tumor-bearing side was immobilized to the stage to reduce movement due to respiration. Immediately prior to imaging and OCA application, the stratum corneum of the skin overlying the normal skin or tumor was removed by tape stripping in order to improve the transdermal penetration of the clearing agent. The OCA comprised a 19:1 mixture of polyethylene glycol (PEG-400) and 1,2-propanediol9 and was applied topically prior to the start of imaging. The skin was then covered with gauze soaked with clearing agent until the next imaging session. Although the tumor cells were injected into the dermis, some tumors developed more superficially than others, so that the OCA diffusion time throughout the tumor varied between animals. A typical example is shown in Fig. 1: in this mouse, part of the tumor was located in the dermis and part was subcutaneous. 2.2.Diffuse Reflectance MeasurementsAs described above, OCA was applied over the normal skin or melanoma after tape stripping. The tissue was then massaged for 1 min to enhance diffusion.9 The first diffuse reflectance measurement was acquired after OCA application but before tissue massage, and then every 15 min for up to 90 min. Diffuse reflectance measurements were acquired using a fiber optic reflectance probe with source–collector fiber separation;8 although somewhat dependent on tissue optical properties, the typical sampling depth at this source–detector separation is quite superficial, typically . The probe tip (1.5 mm diameter) was placed in gentle contact with the tissue surface and the full reflectance spectrum between 450 and 650 nm was collected in . DRS and OCT imaging were performed in different experimental setups to avoid changing the probe and OCT position when acquiring the data. In both setups, the tumor was fixed to minimize bulk tissue motion due to, for example, breathing. Hence, different groups of mice were used to avoid double application of OCA in the same animal. 2.3.Optical Coherence Tomography ImagingThe swept-source OCT system has been described previously.10 Briefly, images were acquired with a 36 kHz Fourier domain OCT system utilizing a short-cavity swept laser source based on a tunable polygon filter, with a sweep range of 110 nm centered at 1310 nm. The axial and lateral resolutions in tissue were 8 and , respectively. OCT imaging was performed immediately following tape stripping, OCA application, and 1 min of massage, and then every 30 min during optical clearing. Each imaging session took 3 min for collecting structural images for speckle variance (SV) analysis to highlight the microvasculature; the SV technique has been described elsewhere11 and is based on decorrelation between successive B-scans due to movement of blood cells. SV images were then processed to obtain depth-encoded microvasculature maps of the tumor and surrounding tissues. Since there was little prior experience in OCT imaging of melanoma, we deliberately varied some of the experimental parameters, such as using glass or plastic slides in contact with the tissue surface during the image acquisition, to test for the consistency of the speckle variance optical coherence tomography (svOCT) results. We noted some biological variability between animals in the growth pattern, and hence depth, of the tumors due to unavoidable differences in the tumor cell microinjection and animal-to-animal variations in biological response. Data from a total of six mice are reported in this initial proof-of-principle study. OCT structural images were acquired in SV mode with 760 B-scans taken over a surface area (interscan separation of ); to enable interframe comparison required for svOCT analysis,11 eight repeat B-scans were acquired at each position. The svOCT algorithm then calculates the interframe intensity variance from the same spatial location,11 with the contrast arising from differences in time-varying speckle properties. Thus, we define where is the number of B-scans acquired at the same spatial location within a 3-D volume ( for this study), is the intensity of the ()’th pixel of the ‘th B-scan, is the axial coordinate, is the lateral coordinate, and is the mean intensity of pixels from consecutive B-scans. This procedure was then repeated for all spatial locations within the 3-D volume.In Eq. (1), if B-scans are acquired faster than the stationary solid-tissue decorrelation time, then the value of () for these pixels approaches zero, thereby suppressing the tissue signal in the resulting SV image. Here, the B-scan acquisition time was set to 25 ms: this was fast enough that signals from stationary tissues did not decorrelate between frames (thus, ), while being sufficiently slow to ensure complete interframe decorrelation for pixels representing vascular blood (thus, high ).12 Several postprocessing procedures were applied to prepare the microvascular 3-D data sets for depth encoding and for presentation as en-face microvascular images. These included
In addition to comparing the resulting depth-encoded svOCT microvascular maps, the clearing effect was quantified using spatial texture analysis of OCT image speckles.13 Specifically, regions of interest (ROIs) within the overlying skin and underlying tumor regions were selected within same cross-sectional OCT images at different time points after application of the clearing agent. The ROI for skin started at the top pixel below the tissue surface. Tumor ROIs were selected manually for each mouse, depending on the tumor depth location. All ROIs were , corresponding to a physical size of in laterally. Histograms of signal intensity distributions within each ROI were then fitted using a least-squares method with the gamma distribution function.14 where and are considered as the shape and scale parameters, respectively, of the gamma distribution. Furthermore, the ratio represents the mean of the distribution, essentially the average signal brightness within a given ROI. This ratio has been shown in high-frequency ultrasound to be related to changes in the tissue scattering properties15 and, in the context of OCT, has proved a useful metric for differentiation between normal and tumor tissues in vivo.13 Thus, in order to estimate the tissue clearing effect, the ratio should decrease for the superficial overlying skin regions but increase for the deeper-lying tumor regions. This would then enable quantification of the change in the depth-of-imaging metric due to clearing.3.ResultsFigure 1 shows the visible effects of optical clearing, with the superficial layers of the skin becoming more transparent and the melanoma pigmentation becoming more visible. 3.1.Diffuse Reflectance MeasurementsThe first measurement (0 min) for both normal skin and melanoma was taken immediately after the application of the OCA in order to minimize variations in optical coupling of the probe and the tissue surface. As seen in Fig. 2(a), normal skin showed around variation in diffuse reflectance across this spectral range over time after OCA application. The reflectance decreased in the first 15 min and then increased at 30 min, followed by decrease up to 90 min. These changes in the signal may be associated with tissue dehydration/rehydration. Figure 2(c) shows the corresponding diffuse reflectance measurements in experimental melanoma. At 15 and 30 min into the clearing, the diffuse reflectance decreased overall by compared to the initial value. The clearing reached its maximum effect at 45 min, at which time the reflectance had decreased by . The reflectance then increased at the 60 min time point, possibly due to a physiological response to reestablish hydration, after which the reflectance decreased again at 75 and 90 min [as also seen in normal skin in Fig. 2(b), although to a lesser extent]. Fig. 2Diffuse reflectance of [(a) and (b)] normal skin and [(c) and (d)] cutaneous melanoma during optical clearing, normalized by the initial value in each case. (a) through (c) Normalized diffuse reflectance spectra, and (b) through (d) changes in reflectance at several wavelengths as a function of the clearing time. 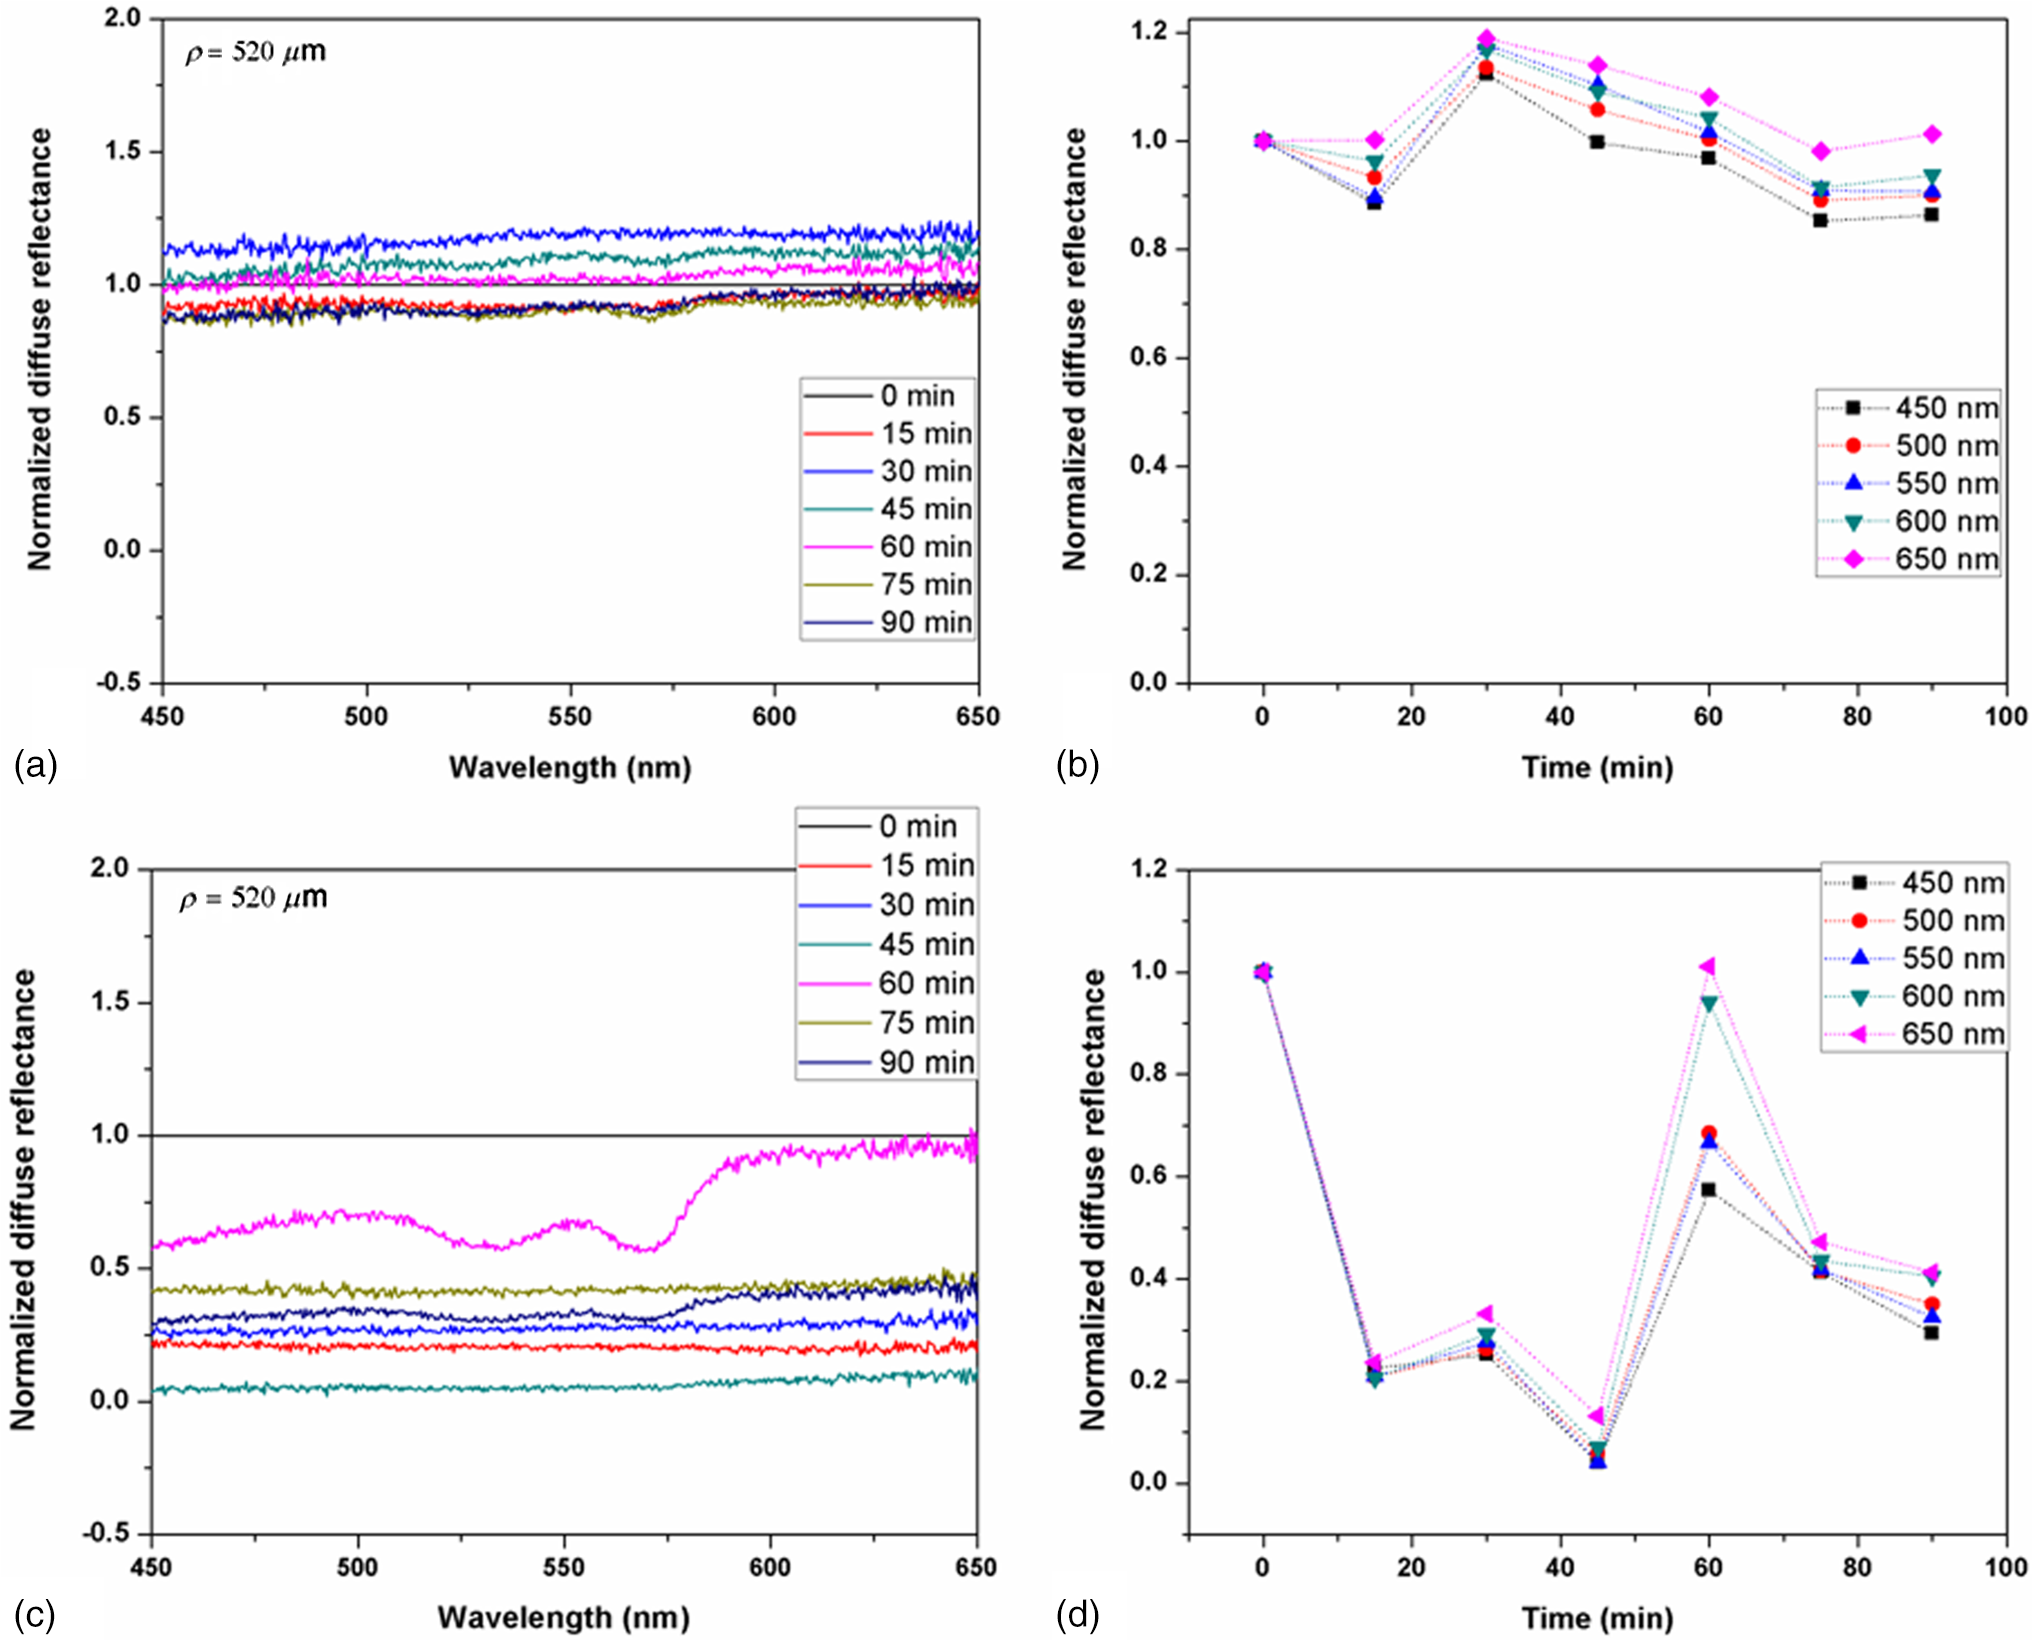 In terms of spectral changes in the diffuse reflectance with clearing, it can be seen that in normal skin [Fig. 2(b)], the reflectance change was nearly uniform across this 200 nm spectral range, except for a slightly greater effect at shorter wavelengths. Since there is a gradient of concentration of OCA into the tissue with topical application, the clearing particularly affects the short wavelengths that have smaller penetration in tissue. Longer application times are required to clear deeper tissue layers. The same behavior was observed for melanoma in the first 45 min. In this particular example, at around 60 min clearing, the characteristic spectral signature of oxyhemoglobin (the double dip at around 540 and 575 nm corresponding to peaks in the absorption spectrum) becomes apparent in the tumor, indicating that the probe is detecting light that has propagated through a well-vascularized region of tissue. This effect is washed out at the longer times, probably due to small changes in the probe-sampling position during the measurement. Quantitative interpretation of these data is also limited by the fact that the source-to-detector fiber separation in the diffuse reflectance probe is only , which is not enough to sample the full tumor thickness of 1 to 2 mm. Nevertheless, the diffuse reflectance data do suggest that topical application of OCA does clear melanoma tissue in vivo. Clearing agents match the refractive index in the tissue, decreasing the light scattering. Most of the agents studied have a refractive index around 1.4, which is optimal for soft tissue. However, melanin granules present in melanoma have a refractive index around 1.7,16 so that the clearing matches the soft tissue but not the melanin granules. Thus, OCA improves the light penetration in melanoma but does not completely eliminate the scattering interfaces. 3.2.Optical Coherence Tomography ImagesB-mode structural images acquired immediately and at 250 min after OCA application are shown in Fig. 3, where it can be seen that immediately after OCA application, only the superficial region of the tumor was visible, down to a depth of . At the later clearing times, the subcutaneous tumor became visible down to [Fig. 3(b)]. The average intensity gradient with depth before and after OCA application showed the same behavior. The tissue surface has high initial signal and, after OCA application, becomes more transparent and a higher signal is obtained from deeper tissue layers [Fig. 3(c)]. Fig. 3Example of B-mode OCT imaging of optical clearing in melanoma in vivo. (a) Photograph of the tumor at the skin surface. (b) Structural B-mode images at 0 (upper) and 250 min (lower) of topical application of OCA, taken through the dark spot seen in (a), which is indicated on the OCT images by the blue arrows. The increased OCT imaging depth (green arrow) due to the clearing is apparent. (c) Average intensity gradient with depth of an area in B-scan (dot lines) before and after OCA application.  SV analysis provided tissue microvasculature images immediately after and at 120 and 250 min following OCA application, as exemplified in Figs. 4 and 5. Prior to clearing, svOCT showed the vascular network in the superficial skin and tumor layers, as also observed in the structural B-mode images. After 120 min of clearing, larger and deeper vessels became more visible; this improved further by 250 min. For example, as seen in the bottom-right panel, the microvascular network down to the depth is beginning to emerge at . The disorganization of the tumor neovasculature is also apparent (Fig. 4). Fig. 4En-face depth-encoded svOCT projections at 0, 120, and 250 min after topical application of OCA for melanoma. Melanoma stimulates angiogenesis, so that more vessels are seen, even prior to clearing. With clearing, the top layers of the tumor become more transparent, allowing visualization of the disorganized deeper tumor microvasculature, to a depth of to at 120 min and to at 250 min.  Fig. 5Normal skin en-face depth-encoded svOCT projections at 0, 120, and 250 min after topical application of OCA. In the normal skin, small vessels in a regular pattern are seen before clearing. Larger vessels start to appear with clearing, probably localized under the skin in depth.  Comparing normal skin and melanoma, it is possible to observe larger vessels in the tumor due to angiogenesis. The vascular network is also related to the age of the mice. In this study, the mice were six to seven weeks old, suitable for tumor development but only presenting small and regular vessels in normal skin (Fig. 5). In addition, diffusion of OCA may differ between normal skin and melanoma: due to its rapid growth, melanoma tissue is poorly organized, so likely the diffusion of the OCA within it is greater. To better quantify the effects of optical clearing on imaging the deeper features of the melanoma microvasculature, Fig. 6 shows examples of histograms of the svOCT pixel intensity in ROIs of the overlying skin and the underlying tumor tissue, together with the corresponding ratios obtained from fitting Eq. (2) to the OCT structural image data. Note the shift in the signal histograms toward smaller-intensity values with optical clearing in the skin, indicating reduced backscattering of the light (as more photons now reach deeper tissue layers). Conversely, in the underlying tumor, the corresponding signals become stronger, again indicating that more light is now able to penetrate to the deeper tissues. Fig. 6Structural OCT image pixel intensity distributions of melanoma and normal skin for the ROIs shown in the insets (): (a) and (b) at time 0, and (c) and (d) after 250 min of clearing with physical massage of the tissue. The blue lines show fits to the gamma distribution function of Eq. (2) and the resulting ratios. The centers of the ROIs for skin and melanoma were selected at depths of 65 and below the tissue surface, respectively. Both ROIs were ().  Figure 7 summarizes the ratios before and after clearing data for the six mice, where the imaging conditions, periods of OCA application, and depth of the tumors varied between animals, as indicated. Fig. 7Summary of the changes with optical clearing in the ratio in skin overlying melanoma (green) and in melanoma (red). Note that the ratio before clearing divided by the ratio after clearing is plotted, so that values (red horizontal line) indicate a reduction in signal intensity (as in the skin) and values represent signal intensity increase (as in tumor). The ROIs for the skin were selected below the tissue surface. Tumor ROIs were selected manually for each mouse depending on the tumor depth, which is indicated above each data point. Both ROIs were pixels, corresponding to a physical size of . The clearance times and mouse number are indicated along the abscissa axis. Triangles indicate that OCT imaging was done without covering the tissue surface; circles indicate a thin plastic covering and squares indicate that the tissue surface was covered with a glass coverslip. These data serve to demonstrate that the changes with optical clearing are relatively insensitive to the exact OCT imaging conditions.  The overall trends show that the ratio in the skin increased consistently with clearing (average ), while the ratio consistently decreased in the melanoma (average ). As per our conjecture, the surface tissues are becoming more transparent, allowing greater depth of penetration of the light into the underlying tumor tissue. Covering the tissue surface during imaging did not appear to make a substantial difference to these ratios, indicating robustness in the measurements and analysis. There was also no systematic trend apparent with increasing clearing time, likely due to the biological variability in the model. However, systematic time dependence was indeed observed in single mice, as illustrated by the example shown in Fig. 8. In this case, increasing loss of signal intensity with clearing time was apparent in the skin, as was better tissue visualization at the 400 to layer in the tumor, as also seen in the corresponding increased brightness of the microvasculature. Figure 9 shows that the image contrast and resolution at this depth in tumor are also improved by the optical clearing. There was minimal change in the ratio at the deeper layer in the tumor, indicating that the OCA did not reach this depth even after 4 h of OCA application. Fig. 8Example of the time course of optical clearing in one mouse: in 5 skin (0 to —squares) and in tumor at two different depths (ROIs at 400 to 520 circles and 750 to triangles).  Fig. 9Example of the improvement in svOCT image quality within melanoma as a result of optical clearing. (a) Depth-encoded en-face projection of microvasculature after 250 min clearing. (b) The area within the white dashed rectangle in (a) is shown at three different time points during clearing; the arrows indicate the apparent reduction in its measured width (black line). (c) Corresponding normalized speckle variance intensity across the diameter of this vessel and its cross-section.  The shape of the cross-sectional profile through the blood vessel in Fig. 8(b), with the flat-top appearance and sharp edges at the 250 min time point, suggests that the effect of clearing may be due to altered optical properties of the tissue (thus improving imaging contrast / resolution) and/or physiological response of the vessel to the OCA. 4.Discussion and ConclusionsMelanoma is a skin cancer that originates in the melanocytes present in the epidermal basal layers. Its dark pigmentation poses a significant challenge for optical techniques, due to high absorption and scattering. Jacques17 estimated the melanin absorption coefficient in moderately pigmented adult skin with 10% volume fraction of melanosomes to range from at 755 nm to at 1064 nm. However, absorption is not the only factor influencing the light distribution in tissue due to melanin. Sergeev et al.18 estimated melanin scattering using the finite-difference time-domain method for individual cells, noting its high index of refraction relative to the surrounding cell components: the resulting scattering coefficient was about three to five times higher at 830 nm in melanotic (7% volume concentration of melanin granules) than amelanotic cells.r18 One would expect that this difference would decrease with wavelength. OCA works by matching the refractive index of soft tissue components with that of the extracellular fluid, reducing the tissue scattering. Different clearing effects have been reported for different agents and routes of delivery.2 For example, PEG-400 has been investigated in combination with chemical enhancers such as thiazone and 1,2-propanediol. Although these enhancers improved the diffusion of the OCA into skin, deep clearing was achieved only when tissue massage was also applied.9 Tape stripping, which removes the stratum corneum, also improves penetration into skin and overcomes diffusion limitations reported for OCA effectiveness in diseases as fibroma, pigmented nevus, and seborrheic keratosis.19 Yu and collaborators quantified the optical transmittance, reflectance, and absorption of normal skin and observed that, for the range from 400 to 1370 nm, the reflectance decreased by after OCA application as a result of reduced scattering.20 White-light DRS was used in the present study to estimate for the first time the clearing effect on melanoma and to compare it to normal skin. The normal skin spectrum showed of variation in diffuse reflectance, with the signal decreasing in the first 15 min, followed by an increase at 30 min. Similar results were obtained by Wen and collaborators using glycerol as the clearing agent in rat skin in vivo. They observed that, at some concentrations, there was an increase in diffuse reflectance at 30 min.21 Genina and collaborators22 also reported clearing effects in skin in vivo and proposed that the optical properties do not change monotonically, due to the interplay of OCA and water diffusion effects in tissuer22. This may also explain the changes that were observed in our reflectance measurements for both normal skin and melanoma. In the measurements performed in melanoma, marked decreases in the diffuse reflectance signal (average , maximum ) were observed, likely due to a combination of changes in microstructural disorganization in tumor tissue and scattering and absorption of melanin granules. In normal skin, a refractive index of 1.4 is optimal for index matching, but this is not the case for melanoma. Melanin granules have a refractive index of ,16 so they still have significant light scattering even after OCA application. In this case, not only the soft tissue refractive index but also the refractive index and absorption properties of melanin granules themselves need to be investigated. Due to these multiple factors, it is difficult to describe the whole effect of OCA in melanoma using only DRS, although this technique does semiquantitatively validate the changes in melanoma optical properties with clearing. As in most solid tumors, growth of melanoma is characterized by an initial avascular radial phase followed by a vascular vertical (depth) phase. In the former, there is typically horizontal growth penetrating the epidermis, while in the latter phase, there is vertical vascular invasion in which the lesion thickens and penetrates the lower dermis. Over time, a rich but poorly organized vascular network forms and the risk of metastatic spread increases. Consequently, high intratumoral micro vessel density is related to important clinical factors such as poor prognosis, overall survival rate, and increased relapse rate.23–27 Hence, there is an unmet need for noninvasive imaging that can visualize the microvasculature network of melanomas. Optical techniques should, in principle, meet this need, but are compromised by the high absorption and scattering of melanin. In OCT imaging, the light attenuating effects of melanin (absorption + scattering) are reduced by the use of NIR light at 1310 nm. The imaging performance (contrast/resolution/imaging depth) was further improved by optical clearing, so that the effective depth of high-resolution imaging of tumor microvasculature in pigmented melanoma was approximately doubled, up to depths that may be relevant to imaging of human tumors. The contrast resolution of blood vessel imaging was also improved throughout the imaging depth up to . In the murine experimental model, melanoma cells are injected intradermally and are able to migrate to the epidermis or to the subcutaneous tissue layers. In the early stages, a thin normal skin layer overlays the tumor, making it more difficult to reach the tumor either by imaging or treatment. Additionally, the stratum corneum protects the skin (and the underlying tumor), preventing the diffusion of topical applied agents. Hence, tape stripping was used to remove the stratum corneum and improve the transdermal diffusion of OCA into the tumor. By contrast, human melanoma originates in the epidermal basal membrane and migrates to the epidermis surface during its first phase. Thus, the tumor is directly accessible to a topically applied agent without the need for tape stripping technique. In the initial stage, the tumor is localized in the epidermis, the most superficial skin layer that is in depth.28 Later, the tumor starts to invade the dermis and subcutaneous tissue as an expanding mass, with associated risk of metastases.29,30 Hinz and collaborators31 investigated OCT and ultrasound imaging to assess the thickness of different melanocytic skin lesions in patients, including two melanoma cases. OCT was able to image up to 770 and in depth for superficial and cutaneous melanoma, respectively. In the mouse model used here, we were able to image vessels up to deep. Based on human melanoma development, this would be significant for diagnosis of tumors in the epidermis and at the papillary dermis stage. Hence, the combination of optical clearing and NIR svOCT imaging is promising for clinical applications, such as evaluating melanoma prognosis, which depends on the tumor thickness and microvascular network density. To our knowledge, this is the first time that a technique for in vivo imaging of the microvasculature in cutaneous melanoma has been successfully described. Optical clearing may also facilitate the use of light-based treatments of melanoma, such as photodynamic therapy (PDT). While very effective in other skin tumors, particularly basal cell carcinoma,32,33 PDT has been largely unsuccessful to date in treating melanoma in patients due to the limited light penetration.34,35 Two-photon PDT with femtosecond pulsed NIR lasers,36 which may be a useful approach in melanoma, should also be enhanced by the use of optical clearing. OCT, including in particular Doppler OCT of tumor vasculature, has already been described for monitoring PDT treatment responses, both in preclinical tumor models and in patients (PDT) treatment.37–39 Hence, this may also represent a useful clinical application of the technique described here. Although PDT is still not established for pigmented tumors, our DRS measurements have shown that tissue clearing improves the light penetration in melanoma, which may translate into improved PDT responses. Treatment of nonpigmented but thicker tumors that have incomplete PDT response could similarly benefit from the use of optical clearing. It may also be useful to use DRS to help plan PDT treatments and monitor the tumor response, since it can be implemented rather easily in different tumor sites such as surface and endoscopic lesions and intraoperatively. We are also investigating the addition of whitening agents such as kojic acid, an anti-tyrosinase agent that inhibits melanin synthesis,40 as a means to further improve NIR-OCT imaging and PDT of melanoma to complement the use of optical clearing in optical diagnostics and treatment of tumors, both pigmented and nonpigmented. AcknowledgmentsThis study was supported through a joint research program between Universidade de São Paulo, Brazil, and University of Toronto (L.P., C.K., V.B., B.C.W.), and by the Canadian Institutes of Health Research and the Ministry of Science and Education, Russian Federation (V.D., I.A.V.). L. Pires was also supported by a scholarship from the National Council of Scientific and Technological Development CNPq–Science Without Borders Program and Coordination for the Improvement of Higher Level Personnel–Capes, Brazil. V. Demidov was supported by Alexander Graham Bell Canada Graduate Scholarship from the Natural Sciences and Engineering Research Council of Canada. ReferencesR. Ria et al.,
“Angiogenesis and progression in human melanoma,”
Dermatol. Res. Pract., 2010 185687
(2010). http://dx.doi.org/10.1155/2010/185687 Google Scholar
D. Zhu et al.,
“Recent progress in tissue optical clearing,”
Laser Photonics Rev., 7
(5), 732
–757
(2013). http://dx.doi.org/10.1002/lpor.2013.7.issue-5 Google Scholar
J. Wang et al.,
“Assessment of optical clearing induced improvement of laser speckle contrast imaging,”
J. Innov. Opt. Health Sci., 3
(3), 159
–167
(2010). http://dx.doi.org/10.1142/S1793545810001052 Google Scholar
Y. Liu et al.,
“Optical clearing agents improve photoacoustic imaging in the optical diffusive regime,”
Opt. Lett., 38
(20), 4236
–4239
(2013). http://dx.doi.org/10.1364/OL.38.004236 OPLEDP 0146-9592 Google Scholar
E. Song et al.,
“Optical clearing based cellular-level 3D visualization of intact lymph node cortex,”
Biomed. Opt. Express, 6
(10), 4154
–4164
(2015). http://dx.doi.org/10.1364/BOE.6.004154 BOEICL 2156-7085 Google Scholar
S. Calve et al.,
“Optical clearing in dense connective tissues to visualize cellular connectivity in situ,”
PLoS One, 10
(1), e0116662
(2015). http://dx.doi.org/10.1371/journal.pone.0116662 POLNCL 1932-6203 Google Scholar
K. V. Larin et al.,
“Optical clearing for OCT image enhancement and in-depth monitoring of molecular diffusion,”
IEEE J. Sel. Top. Quantum Electron., 18
(3), 1244
–1259
(2012). http://dx.doi.org/10.1109/JSTQE.2011.2181991 IJSQEN 1077-260X Google Scholar
A. Kim et al.,
“A fiberoptic reflectance probe with multiple source-collector separations to increase the dynamic range of derived tissue optical absorption and scattering coefficients,”
Opt. Express, 18
(6), 5580
–5594
(2010). http://dx.doi.org/10.1364/OE.18.005580 OPEXFF 1094-4087 Google Scholar
X. Wen et al.,
“Enhanced optical clearing of skin in vivo and optical coherence tomography in-depth imaging,”
J. Biomed. Opt., 17
(6), 066022
(2012). http://dx.doi.org/10.1117/1.JBO.17.6.066022 JBOPFO 1083-3668 Google Scholar
A. Mariampillai et al.,
“Optimized speckle variance OCT imaging of microvasculature,”
Opt. Lett., 35
(8), 1257
–1259
(2010). http://dx.doi.org/10.1364/OL.35.001257 OPLEDP 0146-9592 Google Scholar
A. Mariampillai et al.,
“Speckle variance detection of microvasculature using swept-source optical coherence tomography,”
Opt. Lett., 33
(13), 1530
–1532
(2008). http://dx.doi.org/10.1364/OL.33.001530 OPLEDP 0146-9592 Google Scholar
H. Ullah et al.,
“Can temporal analysis of optical coherence tomography statistics report on dextrorotatory-glucose levels in blood?,”
Laser Phys., 21
(11), 1962
–1971
(2011). http://dx.doi.org/10.1134/S1054660X11190285 Google Scholar
A. A. Lindenmaier et al.,
“Texture analysis of optical coherence tomography speckle for characterizing biological tissues in vivo,”
Opt. Lett., 38
(8), 1280
–1282
(2013). http://dx.doi.org/10.1364/OL.38.001280 OPLEDP 0146-9592 Google Scholar
J. A. Rice, Mathematical Statistics and Data Analysis, 3rd ed.Duxbury Press, Berkeley
(2007). Google Scholar
A. S. Tunis et al.,
“Monitoring structural changes in cells with high-frequency ultrasound signal statistics,”
Ultrasound Med. Biol., 31
(8), 1041
–1049
(2005). http://dx.doi.org/10.1016/j.ultrasmedbio.2005.04.020 USMBA3 0301-5629 Google Scholar
I. A. Vitkin et al.,
“Optical and thermal characterization of natural (Sepia officinalis) melanin,”
Photochem. Photobiol., 59
(4), 455
–462
(1994). http://dx.doi.org/10.1111/php.1994.59.issue-4 PHCBAP 0031-8655 Google Scholar
S. L. Jacques,
“Skin optics,”
Oregon Medical Laser Center News,
(1998) http://omlc.org/news/jan98/skinoptics.html February 2016). Google Scholar
A. M. Sergeev et al.,
“Melanin effect on light scattering in tissues: from electrodynamics of living cells to OCT imaging,”
58
–63
(1997). http://dx.doi.org/10.1117/12.274322 Google Scholar
H. Shan et al.,
“Study on application of optical clearing technique in skin diseases,”
J. Biomed. Opt., 17
(11), 115003
(2012). http://dx.doi.org/10.1117/1.JBO.17.11.115003 JBOPFO 1083-3668 Google Scholar
T. Yu et al.,
“Quantitative analysis of dehydration in porcine skin for assessing mechanism of optical clearing,”
J. Biomed. Opt., 16
(9), 095002
(2011). http://dx.doi.org/10.1117/1.3621515 JBOPFO 1083-3668 Google Scholar
X. Wen et al.,
“In vivo skin optical clearing by glycerol solutions: mechanism,”
J. Biophotonics, 3
(1–2), 44
–52
(2010). http://dx.doi.org/10.1002/jbio.200910080 Google Scholar
E. A. Genina et al.,
“Optical clearing of skin under action of glycerol: ex vivo and in vivo investigations,”
Opt. Spectrosc., 109
(2), 225
–231
(2010). http://dx.doi.org/10.1134/S0030400X10080126 OPSUA3 0030-400X Google Scholar
A. Srivastava et al.,
“The prognostic significance of tumor vascularity in intermediate-thickness (0.76–4.0 mm thick) skin melanoma. A quantitative histologic study,”
Am. J. Pathol., 133
(2), 419
–423
(1988). AJPAA4 0002-9440 Google Scholar
M. E. Fallowfield and M. G. Cook,
“The vascularity of primary cutaneous melanoma,”
J. Pathol., 164
(3), 241
–244
(1991). http://dx.doi.org/10.1002/(ISSN)1096-9896 Google Scholar
O. Straume, H. B. Salvesen and L. A. Akslen,
“Angiogenesis is prognostically important in vertical growth phase melanomas,”
Int. J. Oncol., 15
(3), 595
–599
(1999). http://dx.doi.org/10.3892/ijo.15.3.595 IJONES 1019-6439 Google Scholar
M. Kashani-Sabet et al.,
“Tumor vascularity in the prognostic assessment of primary cutaneous melanoma,”
J. Clin. Oncol. Off. J. Am. Soc. Clin. Oncol., 20
(7), 1826
–1831
(2002). http://dx.doi.org/10.1200/JCO.2002.07.082 Google Scholar
D. Ribatti, T. Annese and V. Longo,
“Angiogenesis and melanoma,”
Cancers, 2
(1), 114
–132
(2010). http://dx.doi.org/10.3390/cancers2010114 Google Scholar
J. Sandby-Møller, T. Poulsen and H. C. Wulf,
“Epidermal thickness at different body sites: relationship to age, gender, pigmentation, blood content, skin type and smoking habits,”
Acta Derm. Venereol., 83
(6), 410
–413
(2003). http://dx.doi.org/10.1080/00015550310015419 ADVEA4 1651-2057 Google Scholar
M.-Y. Hsu,
“Melanoma development and progression: a conspiracy between tumor and host,”
Differentiation, 70
(9–10), 522
–536
(2002). http://dx.doi.org/10.1046/j.1432-0436.2002.700906.x DFFNAW 0301-4681 Google Scholar
A. Breslow,
“Thickness, cross-sectional areas and depth of invasion in the prognosis of cutaneous melanoma,”
Ann. Surg., 172
(5), 902
–908
(1970). http://dx.doi.org/10.1097/00000658-197011000-00017 Google Scholar
T. Hinz et al.,
“Assessment of tumor thickness in melanocytic skin lesions: comparison of optical coherence tomography, 20-MHz ultrasound and histopathology,”
Dermatology, 223
(2), 161
–168
(2011). http://dx.doi.org/10.1159/000332845 Google Scholar
D. P. Ramirez et al.,
“Experience and BCC subtypes as determinants of MAL-PDT response: preliminary results of a national Brazilian project,”
Photodiagn. Photodyn. Ther., 11
(1), 22
–26
(2014). http://dx.doi.org/10.1016/j.pdpdt.2013.11.001 Google Scholar
M. B. Ericson, A.-M. Wennberg and O. Larkö,
“Review of photodynamic therapy in actinic keratosis and basal cell carcinoma,”
Ther. Clin. Risk Manag., 4
(1), 1
–9
(2008). https://dx.doi.org/10.2147/TCRM.S1769 Google Scholar
I. Baldea and A. G. Filip,
“Photodynamic therapy in melanoma—an update,”
J. Physiol. Pharmacol. Off. J. Pol. Physiol. Soc., 63
(2), 109
–118
(2012). JPHPEI 0867-5910 Google Scholar
A. Kawczyk-Krupka et al.,
“Photodynamic therapy in treatment of cutaneous and choroidal melanoma,”
Photodiagn. Photodyn. Ther., 10
(4), 503
–509
(2013). http://dx.doi.org/10.1016/j.pdpdt.2013.05.006 Google Scholar
J. R. Starkey et al.,
“New two-photon activated photodynamic therapy sensitizers induce xenograft tumor regressions after near-IR laser treatment through the body of the host mouse,”
Clin. Cancer Res., 14
(20), 6564
–6573
(2008). http://dx.doi.org/10.1158/1078-0432.CCR-07-4162 Google Scholar
B. A. Standish et al.,
“Interstitial Doppler optical coherence tomography as a local tumor necrosis predictor in photodynamic therapy of prostatic carcinoma: an in vivo study,”
Cancer Res., 68
(23), 9987
–9995
(2008). http://dx.doi.org/10.1158/0008-5472.CAN-08-1128 Google Scholar
B. A. Standish et al.,
“Interstitial Doppler optical coherence tomography monitors microvascular changes during photodynamic therapy in a Dunning prostate model under varying treatment conditions,”
J. Biomed. Opt., 12
(3), 034022
(2007). http://dx.doi.org/10.1117/1.2744068 JBOPFO 1083-3668 Google Scholar
H. Li et al.,
“Feasibility of interstitial Doppler optical coherence tomography for in vivo detection of microvascular changes during photodynamic therapy,”
Lasers Surg. Med., 38
(8), 754
–761
(2006). http://dx.doi.org/10.1002/(ISSN)1096-9101 LSMEDI 0196-8092 Google Scholar
A. F. B. Lajis et al.,
“Depigmenting effect of kojic acid esters in hyperpigmented B16F1 melanoma cells,”
J. Biomed. Biotechnol., 2012 e952452
(2012). http://dx.doi.org/10.1155/2012/952452 Google Scholar
|


