

|
|
1.IntroductionOptical coherence tomography (OCT) is a low-coherence interferometry-based technique. It can provide three-dimensional tomographic information with micrometer spatial resolution and millimeter imaging depth, fulfilling significant applications in both scientific researches and clinical practices. Its major strength, however, lies in ophthalmic imaging.1 The anatomical structure of the eye permits unhindered access of the probing light into the retina, rendering OCT fundus images with explicit details. More importantly, OCT can be further functionalized. For example, OCT angiography can enhance the contrast of microvessels for morphological-based diagnosis, while Doppler OCT measures blood flow for hemodynamics-related applications. Until recently, most ophthalmic OCT systems operate within the near-infrared (NIR) range of the electromagnetic spectrum. Several factors have supported this choice. First, biological tissues (blood, cell matrix, melanin, and so on) exhibit minimal optical absorption and scattering within NIR range among usable optical bands.2 Therefore, the illumination beam is both less attenuated and less diffused, resulting in greater penetration depth and less blurred images. Second, the accessibility and economy of NIR broadband light sources was another important driving factor for the adoption of NIR-OCT.3 Unfortunately, NIR-OCT alone may not provide all the information that researchers and physicians are interested in. Among them, blood oxygen saturation () within the retinal circulation is one important physiological indicator.4 Theoretically, OCT can noninvasively measure blood based on the distinctive absorption spectra contrast between oxygenated () and deoxygenated (HbR) hemoglobin.5,6 However, optical absorption is considerably reduced in the NIR region and is often overshadowed by tissue scattering. As a result, NIR-OCT may not be ideal if accurate quantification of is desired, which was first reported by Faber and van Leeuwen and later verified numerically by Chen et al.7,8 Visible-light OCT (Vis-OCT) provides a solution. Within the spectral range from 500 to 600 nm, and HbR absorption spectra share multiple isosbestic points.9 More importantly, blood optical absorption contrast increases by over 10-fold as compared to that in the NIR region. These advantages collectively make Vis-OCT oximetry possible, as have been demonstrated in ex vivo, in situ, and in vivo experiments.10–12 It was also reported that Vis-OCT measurements from rodent retina circulation can achieve high accuracy within relative error,13 while change due to oxygen unloading can be observed.14,15 In addition, utilizing a shorter wavelength range, Vis-OCT intrinsically has higher axial resolution than NIR-OCT with comparable bandwidth, which can further facilitate its oximetry application.16 Despite Vis-OCT’s successful demonstrations, there are still concerns left unaddressed. One major question is whether the elevated tissue absorption and scattering in the visible spectrum range will adversely affect its imaging capability, both anatomically and functionally. Thus, it is worthwhile to compare the two imaging modalities in a single combined system side-by-side. In addition, Vis- and NIR-OCT may possess distinctive imaging contrasts due to different tissue optical response. An uninformed physician may find the discrepancy confusing; thus, it must be investigated before Vis-OCT can be used clinically. In this work, we seek to answer these questions using a visible-light and NIR dual-band OCT. We simultaneously acquired both Vis- and NIR-OCT images over the same region of interest. Discrepancies between Vis- and NIR-OCT images were identified, whose major indicators included anatomical features and imaging resolution. We further compared their functional imaging abilities to measure retinal blood and absolute blood flow. 2.Materials and Methods2.1.System SetupFigure 1 shows the schematic diagram of our dual-band OCT system. A supercontinuum laser (SuperK EXTREME, NKT photonics) served as the sole light source. A pair of dichroic mirrors (DM1 and DM2, SuperK SPLIT, NKT photonics) selectively separated the output light into visible (500 to 650 nm) and NIR (780 to 950 nm) bands. We then individually delivered the separated visible and NIR beams into the input arms of two Michelson interferometers. Each interferometer was independently optimized. The Vis-OCT interferometer adopted a free-space configuration. The 50:50 beam splitter (Thorlabs) delivered equal amount of light energy toward the sampling arm and the reference arm. In NIR-OCT, we used conventional optical fiber coupler (Thorlabs) with even split ratio. Existing fiber couplers do not perform well within the visible-light spectral range. Although optical dispersion caused by imperfect fiber couplers can potentially be corrected numerically, such correction can also introduce additional artifacts. Therefore, we used the free-space design here for optimal performance in the Vis-OCT subsystem. Fig. 1Dual-band OCT system schematic diagram. BS, beam splitter; CL, collimating lens; DM1 to DM3, dichroic mirrors; FC, fiber coupler; GM, galvanometer scan mirrors; KT, Keplerian telescope; LS, supercontinuum laser source; P, polarizer; PC, polarization controller; Ref 1 and Ref 2, reference arms; S, beam stopper; SM, spectrometer.  The sampling beams of the Vis- and NIR-OCT subsystems were recombined by a third dichroic mirror (DM3, Semrock) and shared identical optical delivery path for retinal imaging. To project scanning patterns onto mouse retina, we used a pair of galvanometer mirrors (Nutfiled Technology) and a 5:1 Keplerian telescope. The collimated output beam has a Gaussian beam diameter of 0.2 mm for both Vis- and NIR-OCTs. In order to compensate the chromatic aberration across two wavelength bands, we adjusted the collimating lens (CL) in the NIR-OCT subsystem to ensure both probing beams focused onto the same focal plane within the retina. The two subsystems had independent reference arms. Within each reference arm, we carefully balanced dispersion mismatch and attenuated the reflected beam intensity for optimal imaging quality. Two home-made spectrometers digitized the interference spectra. The Vis-OCT spectrometer was calibrated to cover the spectral range from 513 to 620 nm. In the NIR-OCT spectrometer, the calibrated wavelength range was from 773 to 909 nm. The spectral resolution is 0.052 nm for the visible spectrometer and 0.066 nm for the NIR spectrometer. As the spectrum intensity fell at both edges, full-width-at-half-maximum (FWHM) bandwidth was 91 and 93 nm for Vis- and NIR-OCT bands, respectively. 2.2.Performance CharacterizationWe placed a silver mirror in the sampling arm where the mouse eye would otherwise be located. It created a single reflective surface, which corresponded to an axial impulse response. One additional neutral density (ND) filter (Thorlabs, optical density = 3.0) was inserted to attenuate the light so that the detected signal fell within the dynamic range of the spectrometer. We adjusted the location of the reference mirrors to change the relative path length difference between the sampling and reference beams. The manipulation was analogous to imaging the sample at various depths. At each location, we recorded the interference fringes from the spectrometers for further analysis. 2.3.Animal PreparationWe imaged the retina of wild-type C57BL/6 mice to compare the imaging capability (actual image resolution, anatomic features, and functional blood flow and measurements) between Vis- and NIR-OCT in vivo. The mouse was anesthetized using Ketamine/Xylazine cocktail solution (11.45 mg Ketamine and 1.71 mg Xylazine per ml of solution, respectively) injected intraperitoneally. The dosage was 87 mg Ketamine and 13 mg Xylazine per kilogram of body weight. Once the mouse entered the desired anesthesia plane, we applied 1% Tropicamide ophthalmic solution to dilate its iris. It was subsequently transferred to a home-made imaging stage and properly immobilized for imaging. During the process, we applied artificial tears every few minutes and in the intervals of acquisitions to prevent eye dehydration. After the experiment, the mouse was allowed to recover and then sent back to the animal housing facility. All procedures were approved by the Northwestern University IACUC and conformed to the Association for Research in Vision and Ophthalmology Statement on Animal Research. 2.4.Imaging ProtocolsWe simultaneously acquired Vis- and NIR-OCT images in a single volumetric scan. Depending on the applications, the imaging procedure used one of the following two scanning protocols. To obtain OCT anatomical imaging, angiography, and retinal blood analysis, we used the raster scanning protocol. It covered a square field of view of 0.8 mm by 0.8 mm on the mouse retina. During each acquisition, we took a group of five repetitive unidirectional B-scans at the same location before moving to the next. Each B-scan consisted of 400 A-lines acquired at 50 kHz. A total of 512 B-scan locations were sequentially acquired. The entire volumetric scan took to complete. The other scanning protocol facilitated calculation of absolute blood flow within the retina circulation. We adopted the dual-ring scanning trajectory centered at optic nerve head to rapidly obtain both Doppler phase shift () and Doppler angle ().17 The diameters of the inner and outer rings were 0.52 and 0.63 mm, respectively. Each ring consisted of 4096 A-lines acquired at 70 kHz. The two ring-scan trajectories were repeated eight times alternatingly, which served to average the pulsatile flow pattern. The acquisition time was 0.9 s. 2.5.Data ProcessingOur imaging protocol allowed us to extract anatomical OCT images, angiography, and retinal vessel blood from the same volumetric data set using the raster scanning protocol. We recovered the complex OCT signal using full-spectrum Fourier transform. After bulk motion correction,18 OCT anatomical images were generated by averaging amplitude B-scans within the same cross-sectional location. Meanwhile, calculating intra-group decorrelation on complex OCT B-scans yielded OCT angiography.19 The detailed steps to perform spectroscopic OCT analysis for were previously documented.12 Briefly, we adopted short-time Fourier transform (STFT), which split the entire spectrum into equally spaced narrow bands in k-space. The Gaussian window size was for the visible band and for the NIR band. This gave us STFT bandwidths of 12 nm at 566 nm for Vis-OCT and 16 nm at 841 nm for NIR-OCT, relaxing the axial resolution for visible and NIR images to 11.7 and , respectively. Each narrow-band spectrum was then individually reconstructed to OCT amplitude images, where image segmentation was performed to extract OCT intensity from the bottom vessel wall. We used the same modified Beer-Lambert’s law to model the detected wavelength-dependent OCT intensity as in Ref. 12. After mathematical treatment, a linear relationship between the measured OCT amplitude and relative concentration can be established.12 Thus, we recovered blood by least-squares fitting the obtained STFT OCT intensity spectrum from the target vessel. OCT flow analysis was performed on the dual-ring scanning data set. After necessary preprocessing, complex OCT signal was reconstructed along the scanning trajectory. We then estimated and for each identified vessel using the corresponding OCT structural and phase image, respectively.17 When phase-wrapping was observed, we applied correction algorithm to resolve any ambiguity before calculating flows.20 3.Results3.1.System Sensitivity and Imaging ResolutionThe intensities of sampling beams were measured using a calibrated integrating sphere (Ocean Optics), which were 0.9 and 0.8 mW for the visible and NIR bands, respectively. Figure 2 plots the mirror-surface impulse response versus imaging depth for the two subsystems. We used the first peaks as the references for sensitivity and resolution estimation. The relative height with respect to the noise floor was 26.6 dB for Vis-OCT and 38.2 dB for NIR-OCT. Taking the 60-dB round-trip attenuation from the ND filter into consideration, we calculated the sensitivity for the Vis- and NIR-OCT to be 86.6 and 98.2 dB, respectively. FWHM () for the first two peaks served as the benchmarks for axial resolutions. The Vis-OCT subsystem showed an axial resolution of in air. Its resolution was more than twofold higher than our NIR-OCT with comparable bandwidth, which was . We also characterized sensitivity roll-off by linear fitting all the peaks in the series, which was for Vis-OCT and for NIR-OCT. Fig. 2System sensitivity and resolution characterization. (a) Axial impulse responses at different depths for Vis-OCT subsystem. FWHM widths for the first two peaks were . (b) Axial impulse responses at different depths for NIR-OCT subsystem. FWHM widths for the first two peaks were . 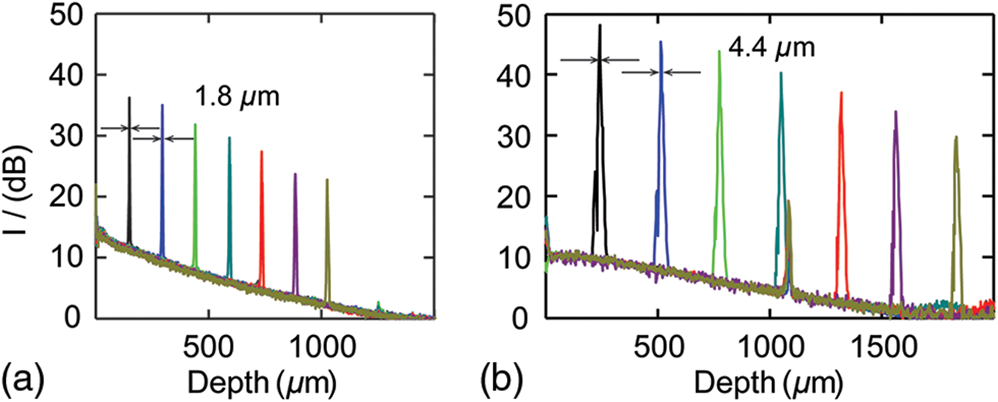 When imaging mouse fundus, we estimated the effective numerical aperture to be for both Vis and NIR subsystems. It would give us the theoretical lateral resolutions of 7.1 and at their respective center wavelengths. However, due to the optical quality of rodent eye, actual resolution during in vivo imaging will not achieve the theoretical values.21 3.2.Comparison of Imaged Anatomic Features Between Vis- and NIR-OCTFigure 3 compares the OCT anatomical and angiographic images obtained by Vis- and NIR-OCT subsystems. We projected mean pixel intensity along depth axis across the entire retina thickness to generate en face OCT fundus images [Figs. 3(a) and 3(b)]. Vis- and NIR-OCT images demonstrate similar features, where retinal blood vessels, neural fiber layer (NFL), and retinal pigment epithelium (RPE) contribute to the majority of the contrast. In addition, both OCT angiograms [Figs. 3(c) and 3(d)] show comparable vascular structures and topographies. We overlaid the anatomical and angiographic B-scans in Figs. 3(e) and 3(f), which were taken from the location indicated by the yellow dashed line in Figs. 3(a) and 3(b), respectively. Multiple retinal layers are distinguishable in both images, with NFL and RPE the brightest. Furthermore, the OCT angiographs correspond well with their corresponding structure B-scans, showing distribution of vessels mainly around NFL, inner border of the inner nuclear layer (INL), inner border of the outer plexiform layer (OPL), and choroid. Fig. 3Comparison of Vis- and NIR-OCT structural and angiographic images. (a) and (b) En face view of OCT structure image for Vis- and NIR-OCT, respectively. (c) and (d) En face view of OCT angiography for Vis- and NIR-OCT, respectively. (e) and (f) Merged B scan showing both structure and blood vessel, taken from the location indicated by the yellow dashed line in (a) and (b), respectively. C, choroid; IPL-INL, inner plexiform and inner nuclear layer; NFL, neural fiber layer; OPL, outer plexiform layer; RPE, retinal pigment epithelium. (g) and (h) A-line profiles taken from yellow dashed line in (e) and (f), respectively. Scale bar: .  Apart from similarities, Vis- and NIR-OCT also demonstrated considerable difference in image contrast. We can see that a strip pattern, which originates from the axons of retinal ganglion cells in NFL, is more recognizable in the Vis-OCT fundus image. The major contributing factor is the difference in penetration depth between the two wavelength ranges. As NIR sampling beam penetrated deeper into the tissue, the more intense homogenous signals from the RPE and choroid overshadowed these NFL features. In addition, because visible spectrum has shorter wavelengths, it has arguably stronger backscattering from NFL, which also increases its relative intensity in the fundus image. To verify, we measured relative intensity ratio between the NFL and its immediate surrounding tissues from the displayed B-scans, which averaged to 3.2:1 and 2.0:1 for visible and NIR images, respectively. Our Vis-OCT demonstrated superior axial resolution over NIR-OCT, as seen in Fig. 3(e). We can distinguish RPE and choroidal layers in the Vis-OCT B-scan image. In contrast, these layers merge in Fig. 3(f) as one single highly reflective interface. We extracted A-line profiles [Figs. 3(g) and 3(h)] from the corresponding locations highlighted by the yellow dashed lines. We identified the profile peaks by black arrows in Fig. 3(g). These peaks, corresponding to the retinal layer interfaces, are narrower than those similar features presented in Fig. 3(h). In addition, Figs. 3(e) and 3(f) demonstrated drastically different quality of speckle patterns. While the speckles in the Vis-OCT B-scan are more densely packed and scattered, they appeared to be larger and clumped in the NIR-OCT image. The difference can be explained by the longer coherence length of the NIR illumination light and the fact that the NIR subsystem has lower imaging resolution than the visible subsystem.22 One weakness of Vis-OCT is its limited penetration depth. Due to stronger tissue absorption and scattering in the visible spectral range, visible light energy dissipates faster than NIR. This was evident in the A-line profiles as Vis-OCT signal demonstrated stronger attenuation across the retina thickness. Though both subsystems have adequate penetration depth to image the entire neural retina in our current application, NIR would be the preferred choice if the target of interest lies beneath RPE. 3.3.Comparison of Oximetry Capability Between Vis- and NIR-OCTWe compared the abilities to extract retinal blood using our visible-light and NIR dual-band OCT. Figures 4(a) and 4(b) show the wavelength-dependent OCT intensity taken from all identified major arteries (four counts) and veins (four counts) from Vis- and NIR-OCT raster scanning data sets, respectively. The arterial and venous OCT intensity spectra show two clear crossings in the visible range. This guaranteed the convergence of the least-squares fitting algorithm. As the accuracy and reliability of Vis-OCT oximetry have recently been demonstrated in both ex vivo blood sample and in vivo rodents,13 here we only present the averaged (), giving for arterial blood and for venous blood, respectively. Fig. 4Extracted averaged OCT intensity spectra from within all identified arteries and veins. (a) Intensity spectra from the Vis-OCT subsystem. Dashed lines depict fitted spectra. (b) Intensity spectra from the NIR-OCT subsystem. Shaded area = S.E.M.  In contrast, the two corresponding spectra from NIR-OCT data set show little difference in their spectral distributions [Fig. 4(b)]. Even though theoretically there exists one isosbestic point at around 822 nm in the oxygenated/deoxygenated whole blood absorption spectrum,23 such feature was not identifiable in NIR-OCT measurements. One important confounding factor is that blood scattering coefficients are more than 100 times stronger than absorption coefficients in the NIR wavelength range, but they have less usable differentiating contrast.23 As a single scaling factor can almost convert one spectrum to another, a mathematical interpretation that correlates such spectral changes with is much more difficult. In this case, our least-squares regression failed to converge and we did not obtain reliable estimations, which agreed with our numerical simulation studies.8 3.4.Comparison of Flowmetry Capability Between Vis- and NIR-OCTFinally, we demonstrated that both Vis-OCT and NIR-OCT subsystems can accurately measure absolute blood flow in the retinal circulation. Figures 5(a) and 5(b) show the B-scan anatomical images overlaid with along the trajectory of the smaller ring scan for Vis-OCT and NIR-OCT, respectively. The directions of blood flow show an alternating pattern as expected, reflecting the anatomical arrangement of arteries and veins within the retinal circulation. In vessel numbers 6, 8, 9 and 10, phase wrapping can be observed, possibly due to higher blood flow rate or smaller Doppler angle. The phenomenon is more pronounced in the Vis-OCT image, Fig 5(a). This can be explained by the fact that Vis-OCT used the shorter range of the light spectrum, rendering it more susceptible to the ambiguity. Fig. 5Doppler OCT flow measurement. (a) and (b) B-scan structure image overlaid with phase variation, obtained using (a) Vis-OCT and (b) NIR-OCT, respectively. (c) Measured absolute blood flow in each vessel shown, numbered from left to right. Scale bar: .  We calculated the absolute flow rate within each identified major blood vessel and compared them in Fig. 5(c). The presented results were averaged values () obtained from eight consecutive pairs of dual-ring scans. The total flow rate was for arteries and for veins as measured by Vis-OCT. Our NIR-OCT provided similar values of and for arteries and veins, respectively. We performed two-sample Student’s -test using respective flow values. No statistically significant difference was found between total blood flow of arteries and veins ( for Vis-OCT and for NIR-OCT) or between Vis- and NIR-OCT measurements ( for arterial flow and for venous flow). The consistency of these values indicated that our measurements were reliable and that Vis- and NIR-OCT had comparable performances in blood flow measurements. 4.Conclusions and Future PerspectivesUnderstanding how Vis-OCT imaging capability differs from that of the more established NIR-OCT was one fundamental step toward its potential clinical applications. In the presented study, we constructed a visible-light and NIR dual-band OCT system using a single supercontinuum laser. Sharing the same light source and the majority of imaging optics, our setup eliminated many confounding factors associated when switching between two imaging systems. Thus, it offered a fair and straightforward comparison between Vis- and NIR-OCT. We demonstrated that both Vis- and NIR-OCT images showed reasonably similar anatomical and angiographic structures when imaging the mouse retina. However, only Vis-OCT was able to differentiate the RPE–choroid complex due to its higher axial resolution. Such a feature has the potential to facilitate RPE pathognomonic evaluation.24 Other discrepancies also existed, which were largely due to the distinctive absorption and scattering properties within the two bands. First, visible light attenuated and dissipated quickly along the depth, so it could barely image structures beneath the RPE layer. On the contrary, NIR-OCT offered more uniform illumination of the entire retina thickness, enabling greater imaging depth. Second, Vis-OCT images showed higher contrast within NFL. It might give Vis-OCT a unique advantage when changes in NFL thickness and reflectivity are of clinical significance, such as in the diagnosis of glaucoma.25 In terms of OCT flowmetry, both systems offered a reliable measurement of absolute blood flow within the retina circulation. However, due to the shorter wavelength used, Vis-OCT is more vulnerable to the phase-wrapping and needs more careful treatment. Based on our observation, we recommend that NIR-OCT is the preferred choice for flow measurement applications. Finally, we verified that Vis-OCT can resolve the spectral contrast between oxygenated and deoxygenated blood, resulting in robust estimation in the retina circulation. It was the only aspect tested where NIR-OCT failed to offer comparable results. Combined with blood flow values, Vis-OCT measurement can provide noninvasive assessment on the oxygen metabolic rate of the retina. As these retinal neurons are highly metabolically active and almost entirely rely on the moment-to-moment delivery of oxygen, abnormalities in oxygen supply will surely lead to dysfunctions.26 Detecting these abnormalities in retinal oxygen supply could shed light on retina physiological and pathological investigation, as well as provide a potential biomarker for early-stage disease detection and late-stage disease management.27,28 We would like to point out that our NIR-OCT subsystem had a higher noise level than commercial systems or other laboratorial prototypes. This is evident as our signal-to-noise ratio (SNR) was only 98.2 dB instead of a detector shot-noise limited SNR ().29 As the major contribution factor is associated with the elevated relative intensity noise inherited from the supercontinuum laser, change to a less noisy source such as a super luminous diode will improve the SNR. However, similar sources are not currently available in the visible range and any improvements made are solely associated with the source property rather than the optical wavelength range used. In order to make a fair comparison between the performances of the Vis- and NIR-OCT systems, we decided to use the same light source for both systems. Aside from the performance comparison, there are still other concerns regarding future clinical applications of Vis-OCT. One key consideration is the potential discomfort in patients caused by visible-light illumination. However, such discomfort may be eased by limiting the light intensity and continuously raster scanning the probing beam across the retina, as reported in a recent publication on a clinical Vis-OCT system for human subjects.30 We can also potentially minimize light exposure by decreasing the acquisition time, which includes the use of more sensitive detectors as they become available and designing more efficient scanning strategy. In summary, both Vis- and NIR-OCT are versatile imaging modalities capable of providing invaluable information in ophthalmology applications. They complement, rather than compete, each other to provide a wide array of assessment on the anatomy and functionality of the retina. While the wavelength bands of choice will still be based on the specific requirements of the application, a dual-band OCT system similar to the one developed can provide a compact solution and offer a broader range of information than either one alone. AcknowledgmentsThis work is supported in part by the following agencies: National Institutes of Health (1R01EY019951, 1R24EY022883, 1DP3DK108248) and National Science Foundation (CBET-1055379, DBI-1353952). H. F. Zhang has financial interests in Opticent Health, which, however, did not support this work. ReferencesA. F. Fercher,
“Optical coherence tomography—development, principles, applications,”
Zeitschrift für Medizinische Physik, 20
(4), 251
–276
(2010). http://dx.doi.org/10.1016/j.zemedi.2009.11.002 Google Scholar
J. M. Schmitt,
“Optical coherence tomography (OCT): a review,”
IEEE J. Sel. Topics Quantum Electron., 5
(4), 1205
–1215
(1999). http://dx.doi.org/10.1109/2944.796348 IJSQEN 1077-260X Google Scholar
A. F. Fercher et al.,
“Optical coherence tomography—principles and applications,”
Rep. Prog. Phys., 66
(2), 239
–303
(2003). http://dx.doi.org/10.1088/0034-4885/66/2/204 RPPHAG 0034-4885 Google Scholar
A. Harris et al.,
“A review of methods for human retinal oximetry,”
Ophthalmic Surg. Lasers Imaging Retina, 34
(2), 152
–164
(2003). http://dx.doi.org/10.3928/1542-8877-20030301-16 Google Scholar
L. Kagemann et al.,
“Spectral oximetry assessed with high-speed ultra-high-resolution optical coherence tomography,”
J. Biomed. Opt., 12
(4), 041212
(2007). http://dx.doi.org/10.1117/1.2772655 JBOPFO 1083-3668 Google Scholar
D. J. Faber et al.,
“Toward assessment of blood oxygen saturation by spectroscopic optical coherence tomography,”
Opt. Lett., 30
(9), 1015
–1017
(2005). http://dx.doi.org/10.1364/OL.30.001015 OPLEDP 0146-9592 Google Scholar
D. J. Faber and T. G. van Leeuwen,
“Are quantitative attenuation measurements of blood by optical coherence tomography feasible?,”
Opt. Lett., 34
(9), 1435
–1437
(2009). http://dx.doi.org/10.1364/OL.34.001435 OPLEDP 0146-9592 Google Scholar
S. Chen et al.,
“Monte Carlo investigation of optical coherence tomography retinal oximetry,”
IEEE Trans. Biomed. Eng., 62
(9), 2308
–2315
(2015). http://dx.doi.org/10.1109/TBME.2015.2424689 IEBEAX 0018-9294 Google Scholar
S. Prahl,
“Optical absorption of hemoglobin,”
(1999) http://omlc.ogi.edu/spectra/hemoglobin/index.html ( September 2015). Google Scholar
N. Bosschaart et al.,
“In vivo low-coherence spectroscopic measurements of local hemoglobin absorption spectra in human skin,”
J. Biomed. Opt., 16
(10), 100504
(2011). http://dx.doi.org/10.1117/1.3644497 JBOPFO 1083-3668 Google Scholar
F. E. Robles et al.,
“Molecular imaging true-colour spectroscopic optical coherence tomography,”
Nat. Photonics, 5
(12), 744
–747
(2011). http://dx.doi.org/10.1038/nphoton.2011.257 NPAHBY 1749-4885 Google Scholar
J. Yi et al.,
“Visible-light optical coherence tomography for retinal oximetry,”
Opt. Lett., 38
(11), 1796
–1798
(2013). http://dx.doi.org/10.1364/OL.38.001796 OPLEDP 0146-9592 Google Scholar
J. Yi et al.,
“Visible light optical coherence tomography measures retinal oxygen metabolic response to systemic oxygenation,”
Light Sci. Appl., 4
(9), e334
(2015). http://dx.doi.org/10.1038/lsa.2015.107 Google Scholar
S. P. Chong et al.,
“Quantitative microvascular hemoglobin mapping using visible light spectroscopic optical coherence tomography,”
Biomed. Opt. Express, 6
(4), 1429
–1450
(2015). http://dx.doi.org/10.1364/BOE.6.001429 BOEICL 2156-7085 Google Scholar
S. P. Chong et al.,
“Cerebral metabolic rate of oxygen () assessed by combined Doppler and spectroscopic OCT,”
Biomed. Opt. Express, 6
(10), 3941
–3951
(2015). http://dx.doi.org/10.1364/BOE.6.003941 BOEICL 2156-7085 Google Scholar
B. Povazay et al.,
“Visible light optical coherence tomography,”
Proc. SPIE, 4619 90
–94
(2002). http://dx.doi.org/10.1117/12.470466 Google Scholar
Y. Wang et al.,
“Retinal blood flow measurement by circumpapillary Fourier domain Doppler optical coherence tomography,”
J. Biomed. Opt., 13
(6), 064003
(2008). http://dx.doi.org/10.1117/1.2998480 JBOPFO 1083-3668 Google Scholar
J. Lee et al.,
“Motion correction for phase-resolved dynamic optical coherence tomography imaging of rodent cerebral cortex,”
Opt. Express, 19
(22), 21258
–21270
(2011). http://dx.doi.org/10.1364/OE.19.021258 OPEXFF 1094-4087 Google Scholar
S. Chen, J. Yi and H. F. Zhang,
“Measuring oxygen saturation in retinal and choroidal circulations in rats using visible light optical coherence tomography angiography,”
Biomed. Opt. Express, 6
(8), 2840
–2853
(2015). http://dx.doi.org/10.1364/BOE.6.002840 BOEICL 2156-7085 Google Scholar
D. C. Ghiglia and M. D. Pritt, Two-Dimensional Phase Unwrapping: Theory, Algorithms, and Software, Wiley, New York
(1998). Google Scholar
H. Li, W. Liu and H. F. Zhang,
“Investigating the influence of chromatic aberration and optical illumination bandwidth on fundus imaging in rats,”
J. Biomed. Opt., 20
(10), 106010
(2015). http://dx.doi.org/10.1117/1.JBO.20.10.106010 JBOPFO 1083-3668 Google Scholar
J. M. Schmitt, S. H. Xiang and K. M. Yung,
“Speckle in optical coherence tomography,”
J. Biomed. Opt., 4
(1), 95
–105
(1999). http://dx.doi.org/10.1117/1.429925 JBOPFO 1083-3668 Google Scholar
N. Bosschaart et al.,
“A literature review and novel theoretical approach on the optical properties of whole blood,”
Lasers Med. Sci., 29
(2), 453
–479
(2014). http://dx.doi.org/10.1007/s10103-013-1446-7 Google Scholar
X. Shu, W. Liu and H. F. Zhang,
“Monte Carlo investigation on quantifying the retinal pigment epithelium melanin concentration by photoacoustic ophthalmoscopy,”
J. Biomed. Opt., 20
(10), 106005
(2015). http://dx.doi.org/10.1117/1.JBO.20.10.106005 JBOPFO 1083-3668 Google Scholar
S. Liu et al.,
“Retinal nerve fiber layer reflectance for early glaucoma diagnosis,”
J. Glaucoma, 23
(1), e45
–e52
(2014). http://dx.doi.org/10.1097/IJG.0b013e31829ea2a7 JOGLES Google Scholar
C. Caprara and C. Grimm,
“From oxygen to erythropoietin: relevance of hypoxia for retinal development, health and disease,”
Prog. Retin. Eye Res., 31
(1), 89
–119
(2012). http://dx.doi.org/10.1016/j.preteyeres.2011.11.003 PRTRES 1350-9462 Google Scholar
H. P. Hammes,
“Pericytes and the pathogenesis of diabetic retinopathy,”
Horm. Metab. Res., 37
(S 1), 39
–43
(2005). http://dx.doi.org/10.1055/s-2005-861361 Google Scholar
M. Mozaffarieh, M. C. Grieshaber and J. Flammer,
“Oxygen and blood flow: players in the pathogenesis of glaucoma,”
Mol. Vis., 14 224
–233
(2008). Google Scholar
M. A. Choma et al.,
“Sensitivity advantage of swept source and Fourier domain optical coherence tomography,”
Opt. Express, 11
(18), 2183
–2189
(2003). http://dx.doi.org/10.1364/OE.11.002183 OPEXFF 1094-4087 Google Scholar
J. Yi et al.,
“Human retinal imaging using visible-light optical coherence tomography guided by scanning laser ophthalmoscopy,”
Biomed. Opt. Express, 6
(10), 3701
–3713
(2015). http://dx.doi.org/10.1364/BOE.6.003701 BOEICL 2156-7085 Google Scholar
|


