|
|
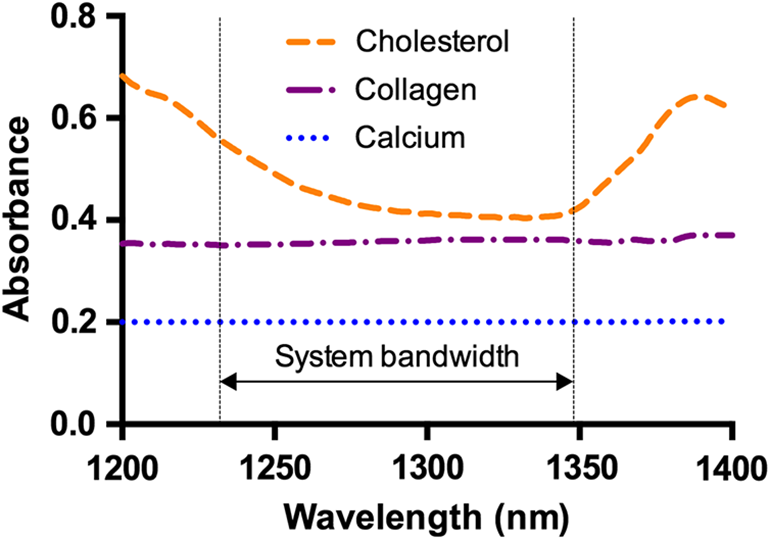
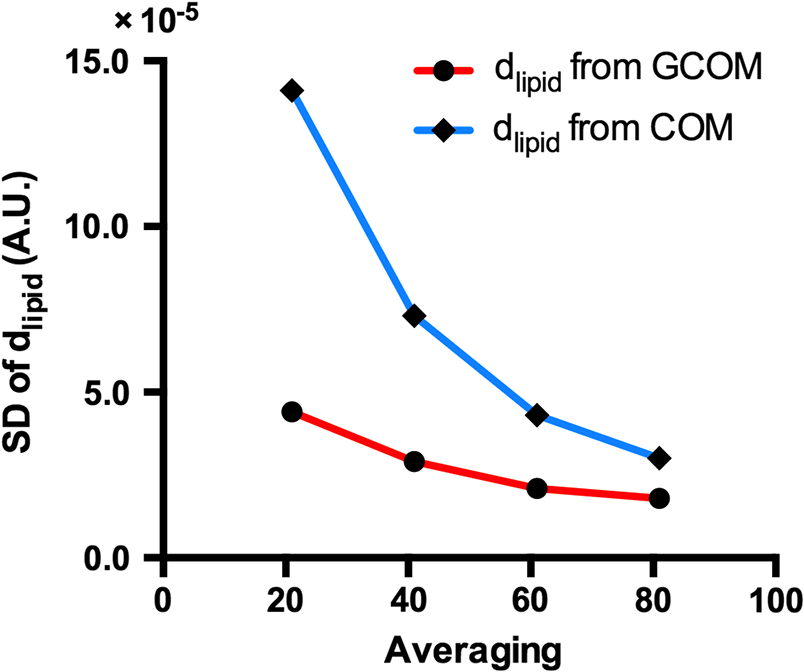
1.Introduction1.1.BackgroundCardiovascular disease, especially coronary artery disease (CAD), is the leading cause of death in the world.1 Atherosclerotic plaque that develops on the basis of lipid accumulation within the vascular wall is the most important pathophysiology in CAD. Progression of atherosclerotic plaques narrows the coronary arteries, hindering blood flow to the myocardium and leading to increased risk of myocardial infarction and heart failure.2 Furthermore, rupture of vulnerable plaque and subsequent thrombogenesis is the main cause of acute myocardial infarction.3 Previous studies have reported that the vulnerability of atherosclerotic plaque is highly associated with the thickness of the fibrous cap, size of the lipid pool, and extent of macrophage infiltration.4–6 In this context, accurate characterization of plaque composition is expected to hold great promise in detecting coronary vulnerable plaques. Optical coherence tomography (OCT)7 is an interferometric imaging technique that is widely used in many medical fields including ophthalmology,8,9 dermatology,10,11 and cardiology.12–14 Due to the unprecedented high spatial resolution of OCT (axial resolution of 10 to and lateral resolution of 10 to ) and rapid image acquisition speed (), this imaging technique can be used to analyze biological tissues by providing three-dimensional (3-D) imaging in vivo.15 Especially, intravascular OCT (IV-OCT), a catheter-based OCT imaging16 in cardiology, has been widely applied to visualize the microscopic structures of arterial inner walls and implanted stents in the coronary artery during percutaneous coronary intervention.12–14 Atherosclerotic plaques are known to have three major components: lipids with cholesterol, calcium deposit, and fibrous tissue.17 IV-OCT can be used to visualize atherosclerotic plaques with high resolution, providing qualitative and quantitative information for these tissue components.18 The comparison study of IV-OCT images with corresponding histological sections by Yabushita et al.19 demonstrated the association of the tissue composition with OCT imaging such as lipid-rich plaques showing diffuse borders with signal-poor regions, fibrocalcific plaques showing signal-poor regions with sharply delineated borders along the lateral direction, and fibrous plaques showing homogeneous and signal-rich regions. Additionally, Xu et al.20 quantified the attenuation and backscattering coefficients of these plaque components from an ex vivo histopathologic correlation study, demonstrating that lipid-rich plaques have higher attenuation and backscattering coefficients than fibrocalcific and fibrous plaques. Several previous studies have characterized atherosclerotic plaques based on qualitative and quantitative tissue properties. Specifically, Van Soest et al.21 described a method to automatically classify atherosclerotic plaque constituents, namely, lipids, calcium, and fibrous tissues, based on the optical attenuation coefficient of the tissue measured in gray-scale OCT images. This method for measuring the optical attenuation coefficient has been successfully demonstrated in vitro. Furthermore, Ughi et al.22 developed an automated algorithm for characterization of IV-OCT atherosclerotic tissues using a supervised classifier, called random forests,23 trained by the optical attenuation coefficient and textural features. However, characterization of plaques, especially lipid-rich plaques, using gray-scale OCT images can lead to misclassification with low accuracy and high ambiguity due to various IV-OCT intrinsic artifacts such as shadowing,18 tangential signal dropout,24 and negative contrast generated by the high attenuation properties of lipids.18 To complement the limitations of tissue characterization based on gray-scale IV-OCT images, various spectroscopic imaging systems have been introduced to provide biochemical or compositional information about atherosclerotic plaques, including near–infrared spectroscopy25,26 and spectroscopic intravascular photoacoustic imaging.27,28 These techniques enable one to distinguish the composition of atherosclerotic plaque by analyzing distinct patterns in spectroscopic signal. The additional biochemical or compositional information has offered an opportunity for better diagnosis and characterization of atherosclerotic lesions. 1.2.Spectroscopic Optical Coherence Tomography (S-OCT)Spectroscopic OCT (S-OCT) is an extension of conventional OCT that allows depth-dependent spectroscopic analysis of samples.29,30 S-OCT is accomplished using short-time Fourier transform (STFT), a method for time-frequency analysis of interferometric signals. S-OCT can be compared with conventional Fourier-domain OCT (FD-OCT), in which the image is acquired by Fourier transform of the signal (Fig. 1). Although axial resolution is sacrificed as a result of the uncertainty principle for STFT, this postprocessing technique provides backscattering spectra of all pixels in the OCT image. Importantly, S-OCT uses the same signal as conventional FD-OCT and thus does not require any additional devices to access the spectroscopic information, which makes this technique more attractive. Spectroscopic analysis using S-OCT can be divided into global and local approaches.31 The global approach of S-OCT focuses on identifying global changes in a sample, i.e., substance identification, by extracting wavelength-dependent optical absorption and scattering coefficients from the spectroscopic data.32,33 On the other hand, the local approach can be used to measure the sizes of scatters that are less than the coherence length of the source by investigating S-OCT spectra modulated by interference of light within a scatterer or from adjacent scatterers.34–36 S-OCT has been widely used for functional medical imaging due to its ability to provide additional spectroscopic analysis of a sample with OCT images. Applications of S-OCT include precancerous lesion detection,37,38 measurement of blood oxygen saturation level,39–41 and burn analysis.42,43 In addition, Fleming et al.44 developed an automatic lipid detection algorithm with IV-OCT images using S-OCT by extracting the wavelength-dependent optical attenuation coefficient. However, this study had limitations in that the results were derived from ex vivo mimicking phantoms with a bench-top OCT system, which does not correspond to the practical setting. In continued research on substance identification using S-OCT, quantitative measurement of wavelength-dependent attenuation properties has been used to characterize tissue types.42–44 However, such quantitative measurements along a full axial range are limited to applications with highly scattering biological tissues.45 To overcome this limitation, Jaedicke et al.45 proposed metrics to analyze and visualize the spectroscopic information extracted by S-OCT. Specifically, the S-OCT metric analysis can be used to reduce the entire multidimensional S-OCT spectrum to between one- and 3-D metrics for effective visualization of spectroscopic properties of a sample. Thus, this method is suitable for characterization of highly scattering media such as biological tissues. 1.3.ObjectiveThe objective of this study was to develop a method for characterization and identification of lipid-rich plaques based on S-OCT metrics analysis. Using a catheter-based IV-OCT system, we validated the proposed method using a lipid phantom model, and then evaluated the method in vivo in an atherosclerotic rabbit model. The proposed method will be useful in alleviating the problems of ambiguity during characterization of gray-scale OCT images and is expected to enhance the accuracy of characterization. 2.Materials and Methods2.1.Intravascular Optical Coherence Tomography Imaging SystemThe IV-OCT imaging was performed with a custom-built OCT system and an imaging catheter recently developed by our group.46 The OCT system was based on a wavelength-swept laser with a center wavelength of 1290 nm, a bandwidth of 116 nm, and a sweeping rate of 120 kHz. The OCT system was operated with a custom-made catheter with an outer diameter and length of 0.87 mm and 1.5 m, respectively. The maximum frame rate of the system was , and the pullback speed of the catheter was . 2.2.Lipid Phantom ModelFirst, lipid phantoms were created to demonstrate how the proposed method works ideally and theoretically. To mimic the lipid composition of atherosclerotic plaque, we chose mayonnaise (Heinz, Pittsburgh, Pennsylvania) typically composed of soybean oil (), whose composition is similar to that of the lipid-rich plaque, where cholesteryl linoleate and oleate take a large proportion of the cholesterol ester group in the lipid ().47,48 We prepared three phantoms with different concentrations of mayonnaise and a phantom without mayonnaise. Specifically, mayonnaise was diluted with Tris-buffered saline with 0.05% of Tween 20 (TBST) solution to final concentrations of 28.6%, 16.7%, and 9.1%. A Phantom without mayonnaise was made with ketchup (Heinz, Pittsburgh, Pennsylvania) diluted with TBST solution to a final concentration of 28.6%, due to its scattering property and the absence of cholesterol. Each phantom solution was filled in the space between an outer plastic tube (ID 10.7 mm, OD 11 mm) and an inner fluorinated ethylene propylene tube (ID 4 mm, OD 5 mm, Fluorotherm Polymers, Parsippany-Troy Hills, New Jersey) to mimic the vessel luminal structure. Then, each phantom tube was imaged using the system described earlier. 2.3.Atherosclerotic Rabbit ModelWe developed a rabbit model of inflamed lipid-rich plaque (lipid-rich rabbit) and inflamed fibrous plaque (fibrous rabbit). Inflamed lipid-rich atherosclerotic plaques in a New Zealand white rabbit (3.0 to 3.5 kg, male; Dooyeol Biotech, Seoul, Korea) were induced with balloon denudation on a left iliac artery (LIA) and hypercholesterolemic diet (HCD). For the inflammatory fibrous rabbit model, neointimal thickening was induced by balloon denudation as described above, however the animal was placed on a normal chow diet instead. Detailed protocol has been described in a previous paper.49 The fibrous rabbit model and an intact right iliac artery (RIA) of a lipid-rich atherosclerotic model served as control groups. The animal experiments were approved by the Institutional Animal Care and Use Committee of Korea University (KUIACUC-2013–88) and were performed in accordance with the recommendations of the national and institutional guidelines. Under fluoroscopic guidance, the imaging catheter was inserted to the target iliac artery, and IV-OCT image sets were acquired while flushing the artery with contrast media. The arterial segments identified by anatomical landmarks from distal to proximal iliac arteries were imaged with a rotational speed of 100 rps and pullback speed of . Raw OCT signals containing 1024 A-lines per frame were used for further characterization processing. All processing for data sets of both the phantom and the rabbit was implemented in MATLAB R2015a (The MathWorks, Natick, Massachusetts). 2.4.Spectroscopic Optical Coherence Tomography Metric Analysis for LipidsIn the bandwidth of our OCT system, fibrous or normal tissue exhibited a rather flat absorbance through the system band (purple and blue spectra in Fig. 2). On the other hand, the lipid with cholesterol had higher absorption properties at lower wavelength, i.e., a higher wavenumber () (yellow spectrum in Fig. 2).44 Therefore, in regions of lipid-rich plaque, the intensity at lower was dominant compared with the higher band. Importantly, this spectroscopic difference between substances can be used to distinguish lipid-rich plaque from other tissues.44,50 Fig. 1Concept of S-OCT and comparison with conventional FD-OCT. In the FD-OCT system, an OCT intensity image and a set of depth profiles (A-lines) are acquired by Fourier transform of interferometric signals and used to determine the morphology of the sample. However, if STFT is applied to the interferometric signal instead of Fourier transform, additional spectroscopic information, namely the depth of each point, can be determined. This postprocessing technique is called S-OCT and enables depth-resolved spectroscopic analysis of a sample.  In previous S-OCT researches,30,45 the center of mass (COM) of the S-OCT spectrum has been used as a representative metric to visualize the property of the spectrum. However, the COM metric is likely to be distorted and measured with a large deviation since an S-OCT spectrum contains an oscillation pattern due to speckle noise. In other words, the calculation of the COM metric is affected by the phase and the amplitude of the oscillations, which are not related to the substance identity. Filtering the oscillation pattern of the spectrum is a possible solution to this problem,44 but it is difficult to identify an appropriate cut-off frequency for such filtering. Thus, the mean parameter () of a Gaussian fitting of the S-OCT spectrum, which we named the Gaussian center of mass (GCOM) metric, was introduced as a robust metric to avoid this problem. Figure 3 shows how the GCOM metric is determined using real S-OCT spectra of each axial point. To represent the lipid distribution in arterial tissues of IV-OCT images, GCOM metrics were computed from the spectra of all pixels within a tissue region of interest (ROI), defined as the region enclosed by the vessel lumen contour (yellow curve in Fig. 3) and the perivascular contour (ocean blue curve in Fig 3). The vessel lumen and perivascular contours were automatically segmented on gray-scale OCT images using an algorithm described in a previous study.51 Considering the absorption properties of lipids, we anticipated that the GCOM of an S-OCT spectrum of a pixel with lipid-rich plaque would be located at the lower band of compared with other tissues as described in Fig. 3. Thus, if lipids are distributed along the axial direction (the same direction as the illumination of the light), the GCOM metrics along the direction will experience a negative shift in the wavenumber domain (black dashed arrows in Fig. 3). Fig. 3Representative example of the extraction of the GCOM metric function along the axial direction, , in an IV-OCT image of the rabbit artery with a lipid-rich plaque. From spectra at axial points indicated by green arrows, GCOM metrics are extracted by calculating the mean of Gaussian fitting (blue curve) of S-OCT spectra (red curve).  As a result of attenuation being the cumulative effect along the axial direction, the intensity of an S-OCT spectrum at a specific axial point (), assuming constant scattering in a medium, is generally represented by the integrated form of Beer’s law as follows: where is the initial intensity of an S-OCT spectrum and it is proportional to the spectrum of the source, the factor of 2 accounts for the round-trip of the illuminated light, and is the wavelength- and depth-dependent attenuation coefficient. Thus, to consider only the attenuation of the specific point, the following differentiation operation is required: Likewise, to represent the negative shift caused by the presence of lipids and to visualize the lipid distribution at specific axial points, we determined the derivative of the GCOM metrics along the axial direction in order to take account of the cumulative effect of absorption as follows: where is the GCOM metric along the axial direction and is the lipid-distribution function along the axial direction.Depth-resolved spectra were acquired by STFT of a calibrated interferometric signal with a window size of , resulting in a spectral resolution of 9.6 nm and a degraded axial resolution of . In order to reduce noise in S-OCT,45 20 depth-resolved spectra adjacent to both sides of the pixel (a total of 41) were averaged, and the averaged depth-resolved spectra were again smoothed by a two-dimensional kernel with a pixel size of 3 by 7 ( by 67 nm) in the axial and spectral directions, respectively. Finally, we extracted the GCOM metrics, , from the processed S-OCT spectra of all pixels in the tissue ROI and applied differential operations to calculate the lipid distribution function, . In this method, characterization images are represented in the hue, saturation, and intensity space to simultaneously describe the compositional information as color (hue) and morphological features of the artery as brightness (intensity). Therefore, can be directly mapped to the hue space of the corresponding A-line of the image in order to visualize the lipid-rich plaque. After mapping to the hue space, we transformed the images of the results to Cartesian coordinates for visualization. 2.5.Histological EvaluationExperimental rabbits were euthanized with intravenous KCl () under anesthesia, and both iliac arteries were dissected. A bright light image of resected vessels was captured using a digital camera to document the branch points of the arteries, which were used as reference points for OCT/histology matching. Then, 3-mm vascular rings were frozen in optimum cutting temperature compound (Sakura Finetek, Torrance, California) for histopathological analysis. A total of nine rings of the tissue from LIA with balloon denudation and one ring from RIA with no injury were generated. Serial cryosections () were cut at intervals and stained with Oil Red O (ORO). ORO was used to histologically visualize fat cells on frozen sections. 2.6.Optical Coherence Tomography/Histology Co-LocalizationArterial branches and arterial morphology were used for colocalization between OCT frames and histological sections. For colocalization, the locations of arterial branches in the OCT pullback were confirmed in the angiographic image, and the branches were longitudinally matched to the arterial tissue. Then, the iliac arterial tissue was cut at a thickness of on a cryostat, and the cryosectioned tissue slides containing a branch were paired with the corresponding OCT frames. In cases without a branch, the distance from the nearest branching point, plaque shape, and neovessel formation were used for colocalization. 2.7.Statistical AnalysisStatistical analysis was carried out to validate the methods for characterization of lipid-rich plaque based on ROI analysis between lipid-mapping results, mapped images by the values of of all pixels, and the corresponding histological sections with ORO stain, which are considered the gold standard for lipid characterization. In OCT/histology-matched sections prepared as described in Sec. 2.6, corresponding paired ROIs were determined on both the gray-scale OCT images and the gray-scale histological sections to consider the morphological features of images. A total of five fixed-size paired ROIs per each matched section were defined. In sections with a bifurcation, we determined a total of four paired ROIs on the matched sections. Next, the paired ROIs determined on the gray-scaled images were drawn on both the lipid-mapping results and the corresponding ORO-stained sections. The ROIs of the lipid-mapping and the corresponding ORO were directly compared for statistical analysis. A receiver operating characteristic (ROC) curve was constructed from sensitivity and specificity data determined by comparison of lipid-mapping ROIs with corresponding ORO ROIs. In order to evaluate sensitivity and specificity, a lipid-mapping ROI with of pixels in which the signal was larger than the threshold value was considered lipid-positive. Similarly, an ORO ROI in which of pixels stained red was considered lipid-positive. The best threshold value was determined from the constructed ROC curve. In addition, linear regression was performed between the percentage of lipid-positive pixels in the lipid-mapping ROIs and the percentage of pixels stained red in the corresponding ORO ROIs. Finally, the peak values of the lipid-mapping ROIs with lipid-rich plaque, fibrous plaque, and no lesion were statistically compared based on . Unpaired one-tailed Student’s -test was employed to determine the statistical difference among the peak values of each group. 3.Results3.1.Phantom Models of Lipid-Rich PlaqueFigure 4 shows the representative GCOM and of lipid phantom models as a function of depth. As shown in Fig. 4(a), the relative GCOM values, defined as , in mayonnaise phantoms are linearly shifted toward the negative direction as expected. Moreover, the higher concentration of mayonnaise generated the larger negative shift of GCOM and the higher value of . The of is computed as , , and for the phantoms with the mayonnaise concentration of 9.1%, 16.7%, and 28.6%, respectively. Figure 4(b) shows that the proposed method provides consistent values of in a homogeneous lipid phantom. As shown in Fig. 4(c), the mean values of have a linear relationship with lipid concentrations. In contrast, the phantom without mayonnaise showed positive GCOM shift [black curve in Fig. 4(a)] and negative value of [black curve in Fig. 4(b)] due to its high water content,52 which has higher absorption properties at higher wavelengths.44 Fig. 4Result of lipid phantom analysis. (a) Plots of relative GCOM and (b) of each phantom. The legend in (a) denotes the concentration of mayonnaise of each phantom. (c) The linear relationship between the concentrations of phantom and the mean values of . Error bars, SD.  In order to compare the robustness of GCOM and COM metrics, we acquired using both metrics from A-lines of the 16.7% mayonnaise phantom with different level of averaging (21, 41, 61, and 81 depth-resolved spectra). As shown in Fig. 5, values of from the GCOM metric has a lower standard deviation regardless of the averaging level, demonstrating superior robustness of the proposed GCOM as compared with the COM. 3.2.In vivo Intravascular Imaging of Atherosclerotic Rabbit ArteriesTo validate the feasibility of the proposed methods in clinical application, we successfully performed in vivo imaging of the LIAs of both the lipid-rich rabbits and fibrous rabbits with the IV-OCT system. In addition, images with no lesion were acquired from the RIA of the lipid-rich rabbit model that was not injured by balloon denudation. With the recorded angiography, we successfully acquired IV-OCT images sets from 45 mm segments of iliac arteries, including the LIA of lipid-rich/fibrous rabbits and RIA of lipid-rich rabbits. After in vivo imaging, rabbits were euthanized with intravenous injection of KCl, and the right and left iliac arterial segments were resected. We identified 22 OCT/histology-matched paired sections (lipid-rich: , fibrous: , no lesion: ) from histological sectioning of tissue (LIA of lipid-rich rabbit, LIA of fibrous rabbit, and RIA of lipid-rich rabbit). 3.3.Mapping ResultsFigure 6 shows representative results of mapping of the lipid distribution function to characterize lipid-rich plaques, which were compared with corresponding histological sections stained with ORO for visualization of fat cells and neutral fat. The first [Figs. 6(a)–6(c)], second [Figs. 6(d)–6(f)], and third [Figs. 6(g)–6(i)] rows show the results of the LIAs of the lipid rabbit model (lipid-rich plaque), fibrous rabbit model (fibrous plaque), and the RIA of the lipid rabbit model (no lesion), respectively. The first column [Figs. 6(a), 6(d), and 6(g)] represents gray-scale OCT images of each type of plaque, the second column [Figs. 6(b), 6(e), and 6(h)] represents the lipid distribution function mapping results. The third column [Figs. 6(c), 6(f), and 6(i)] represents the corresponding histological ORO-stained sections. With respect to the lipid-rich plaque, the region with a high value of [yellow arrowheads in Fig. 6(b)] corresponded to the area stained red with ORO [yellow arrowheads in Fig. 6(c)]. However, low values of were observed in the fibrous plaque and area with no lesion, except the region indicated by the yellow arrow in Fig. 6(h). This finding was attributed to the fact that images with no lesion were acquired from the RIA of the lipid rabbit without injury but with an HCD, which could have contributed to natural lipid deposition in the artery. Fig. 6Representative results of mapping the lipid distribution function and comparison with the corresponding histology sections. The first, second, and third rows show the results for lipid-rich plaque (a)–(c), fibrous plaque (d)–(f), and no lesion (g)–(i), respectively. Gray-scale OCT images (a), (d), (g) only provide morphological information, whereas the mapping results of the lipid distribution function derived from S-OCT (b), (e), (h) provide information about lipid composition, which corresponded well with ORO-stained histological sections (c), (f), (i). Scale bars, .  3.4.En Face VisualizationTo visualize the lipid distribution of the entire pullback, averaged values of the lipid distribution function along the axial direction within the tissue ROI were calculated at each rotation angle for each longitudinal position as follows: where and denote the coordinate of the rotation angle and the pullback direction, respectively. The interval of this definite integral denotes the range from the vessel lumen contour () to the perivascular contour () as described in Sec. 2.4.As shown in Fig. 7(a), large values of were distributed throughout the pullback, whereas no significant value was observed in the pullbacks with fibrous plaque [Fig. 7(b)] or no lesion [Fig. 7(c)]. This en face visualization enables observation of the lipid distribution through the pullback. Fig. 7Representative en face visualization of the averaged lipid distribution along the axial direction in the pullbacks, , with (a) lipid-rich plaque, (b) fibrous plaque, and (c) no lesion, respectively. The green dashed lines in (a), (b), and (c) correspond to the first, second, and third rows in Fig. 6. D; distal, P; proximal. Scale bar, 10 mm.  3.5.Statistical ValidationFigure 8 shows the results of the statistical analysis for characterization of lipid-rich plaques. We acquired 97 ROIs from 22 OCT/histology-matched paired sections. From the ROC curve shown in Fig. 8(a), the area under the curve was calculated as 0.8814, and the best threshold value to distinguish lipid-rich plaque from nonlipid tissues was also determined as 0.004 in the arbitrary unit. Using this threshold value, we achieved a 94.3% sensitivity, 76.7% specificity, and a high correlation coefficient [, , Fig. 8(b)] between the lipid-mapping method and the ORO staining. In addition, we found that the peak values of the lipid distribution function in lipid-rich plaques were significantly larger than those of the fibrous plaque () and in those with no lesion (), as shown in Fig. 8(c). Mean and SD of in no lesion were slightly larger than those in fibrous plaque, which was not statistically significant (). The insignificant difference between the two groups is likely due to a few regions with lipid found in the RIA of the lipid rabbit fed high cholesterol diet without injury. Fig. 8Results of statistical analysis for the characterization of lipid-rich plaques. (a) ROC curve of the performance of the method with an AUC of 0.8814. (b) Correlation between the percentage of lipid pixels in the lipid-mapping ROIs and that of ORO-stained regions in the corresponding ORO ROIs (, ). (c) Comparison of the peak values for lipid-rich plaques, fibrous plaques, and areas with no lesion. Error bars; SD, asterisk; significant difference, .  4.Discussion and ConclusionIn this study, we developed a method for characterization of lipid-rich plaques in IV-OCT images based on an S-OCT metric analysis using the robust GCOM metric. GCOM metrics were acquired along the axial direction of samples, and derivatives of the GCOM metrics functions, , were mapped to IV-OCT images to represent lipid distribution in the images. We demonstrated the proposed method in vivo using atherosclerotic rabbit models with either a lipid-rich plaque, fibrous plaque, or no lesion. The statistical analysis showed that the mapping values of in regions with lipids were significantly higher than in those without lipids [Fig. 8(c)]. Furthermore, lipid was correctly characterized with values, and pixels with lipids were classified with the best threshold value determined from the ROC curve [Fig. 8(a)], resulting in high sensitivity, specificity, and correlation (94.3%, 76.7%, and , respectively) between the measurement of lipids using the proposed S-OCT metrics and the histological measurement of lipids with ORO staining. Especially, the presented GCOM metric to characterize lipid components was experimentally shown to be robust to speckle and noise present in OCT images (Fig. 5). This advantage would make the proposed method more attractive and reliable in various medical applications using S-OCT to characterize tissue components. Although we were unable to directly compare the results of the present study with previous research due to the use of different data sets and methods of analysis, the proposed method was able to accurately characterize the lipid contents of the analyzed plaque. In a previous study, Van Soest et al.21 calculated the optical attenuation coefficient of various atherosclerotic tissues with different composition from IV-OCT images and compared their results with corresponding histological sections. Accordingly, they obtained an attenuation coefficient of lipid-rich tissue greater than , which is much larger than that of other types of tissues. Likewise, Ughi et al.22 reported a classification accuracy of 81.5%, including an accuracy of 79.5% for lipid-rich plaques. Fleming et al.44 determined the ratio of lipid and collagen pixels to the total pixel with lipid and cap thickness measured from histological measurements and achieved a good correlation between histology and classification results. As shown in Fig. 8(b), the proposed characterization method tends to overestimate the percentage of lipid-pixels than the corresponding histology. This tendency of overestimation is likely due to the level of the threshold value determined in the ROC curve in Fig. 8(a) and the mismatch of resolution between S-OCT mapping results and the corresponding histological sections. In this study, to acquire depth-resolved spectroscopic information with sufficient signal-to-noise ratio, both axial and lateral resolution of OCT were sacrificed, resulting in blurred lipid mapping results. On the other hand, the histological sections with ORO staining provide detailed structure of the tissue. This blurring and the resolution mismatch along with the best threshold value might have caused the overestimation of lipids. As a result, our method exhibited higher sensitivity than specificity with more false positives than false negatives. In addition, limited penetration depth of OCT inevitably induced some false positives and false negatives in deeper locations. There were several limitations to the present study. First, we assumed that the spectroscopic change in OCT signal of the plaques was a result of lipid composition; however, this might not reflect the practical heterogeneous composition of atherosclerotic plaques. Although this simplified method worked well in the rabbit model of lipid-rich plaque, heterogeneous composition should be considered in further studies. Second, the scattering effect on spectral attenuation was ignored. Xu et al.53 stated that scattering is inversely proportional to wavelength and produces wavelength-dependent modulation in cases of small scatterers. If we had taken this property into consideration during characterization (i.e., macrophage identification), additional valuable information might have been acquired. Third, we validated the clinical feasibility of the proposed method with a rabbit model of atherosclerosis. Generally, when only feeding the HCD as the stimulus, a rabbit develops a foamy, cell-rich fatty streak, which is the first visible lesion in the development of atherosclerosis. With the combination of balloon denudation and hyperlipidemia, the rabbit model can establish the advanced plaque, which sufficiently reflects the lipid-rich plaque in human. However, an incidence of thrombosis and rupture of fibrous cap is low in this model, which is different from patients with acute coronary syndrome,54 thus, caution should be made in interpreting the results. Additionally, S-OCT technique also suffers from limited penetration depth of OCT. Thus the proposed method is limited to estimate a lipid distribution in deep tissue and measure total plaque burden. However, this method can be effectively applied to detect a vulnerable plaque with a thin fibrous cap in human subjects, since the lipid pool is located within a relatively shallow depth. Fourth, although the number of rabbit models used in this study was limited, we successfully demonstrated the feasibility of the method with an S-OCT metric analysis for characterizing lipid-rich plaques in IV-OCT images. Finally, the computing speed for the characterization is rather slow. It takes about 5.1 s per a frame containing 1024 A-lines in our MATLAB script on a personal computer with a 3.7 GHz Quad-Core Intel Xeon E5. Specifically, most of the elapsed time is spent in STFT for the extraction of depth-resolved spectra. This speed limitation can be overcome by GPU parallel computing, to reduce the processing time significantly.55 In summary, we presented a method for characterization of lipid-rich plaque in IV-OCT images based on spectroscopic absorption properties of lipids and demonstrated this technique using lipid phantom models and in vivo atherosclerotic rabbit models. We expect that the complementary compositional information provided by the S-OCT metric analysis will be useful in overcoming the limitations of gray-scale OCT images to better assess high-risk atherosclerotic plaque. AcknowledgmentsThis work was supported by the National Research Foundation of Korea (NRF) grant funded by the Korean government (MSIP) (NRF-2015R1A1A1A05027209, NRF-2015R1A2A2A07027863) and by the Ministry of Health & Welfare of Korea (HI15C0001). ReferencesD. Mozaffarian et al.,
“Heart disease and stroke statistics—2015 update: a report from the American heart association,”
Circulation, 131
(4), e29
–e322
(2015). http://dx.doi.org/10.1161/CIR.0000000000000152 CIRCAZ 0009-7322 Google Scholar
G. K. Hansson,
“Inflammation, atherosclerosis, and coronary artery disease,”
N. Engl. J. Med., 352
(16), 1685
–1695
(2005). http://dx.doi.org/10.1056/NEJMra043430 Google Scholar
E. Falk, P. K. Shah and V. Fuster,
“Coronary plaque disruption,”
Circulation, 92
(3), 657
–671
(1995). http://dx.doi.org/10.1161/01.CIR.92.3.657 CIRCAZ 0009-7322 Google Scholar
R. Virmani et al.,
“Lessons from sudden coronary death—a comprehensive morphological classification scheme for atherosclerotic lesions,”
Arterioscler. Thromb. Vasc. Biol., 20
(5), 1262
–1275
(2000). http://dx.doi.org/10.1161/01.ATV.20.5.1262 Google Scholar
P. K. Shah,
“Mechanisms of plaque vulnerability and rupture,”
J. Am. Coll. Cardiol., 41
(4 Suppl S), S15
–S22
(2003). http://dx.doi.org/10.1016/S0735-1097(02)02834-6 Google Scholar
M. Naghavi et al.,
“From vulnerable plaque to vulnerable patient: a call for new definitions and risk assessment strategies: Part I,”
Circulation, 108
(14), 1664
–1672
(2003). http://dx.doi.org/10.1161/01.CIR.0000087480.94275.97 CIRCAZ 0009-7322 Google Scholar
D. Huang et al.,
“Optical coherence tomography,”
Science, 254
(5035), 1178
–1181
(1991). http://dx.doi.org/10.1126/science.1957169 SCIEAS 0036-8075 Google Scholar
M. R. Hee et al.,
“Optical coherence tomography of the human retina,”
Arch. Ophthalmol., 113
(3), 325
–332
(1995). http://dx.doi.org/10.1001/archopht.1995.01100030081025 Google Scholar
C. A. Puliafito et al.,
“Imaging of macular diseases with optical coherence tomography,”
Ophthalmology, 102
(2), 217
–229
(1995). http://dx.doi.org/10.1016/S0161-6420(95)31032-9 OPANEW 0743-751X Google Scholar
T. Gambichler et al.,
“Applications of optical coherence tomography in dermatology,”
J. Dermatol. Sci., 40
(2), 85
–94
(2005). http://dx.doi.org/10.1016/j.jdermsci.2005.07.006 Google Scholar
J. Welzel,
“Optical coherence tomography in dermatology: a review,”
Skin Res. Technol., 7
(1), 1
–9
(2001). http://dx.doi.org/10.1034/j.1600-0846.2001.007001001.x Google Scholar
G. J. Tearney et al.,
“In vivo endoscopic optical biopsy with optical coherence tomography,”
Science, 276
(5321), 2037
–2039
(1997). http://dx.doi.org/10.1126/science.276.5321.2037 SCIEAS 0036-8075 Google Scholar
G. J. Tearney et al.,
“Three-dimensional coronary artery microscopy by intracoronary optical frequency domain imaging,”
JACC Cardiovasc. Imaging, 1
(6), 752
–761
(2008). http://dx.doi.org/10.1016/j.jcmg.2008.06.007 Google Scholar
S. H. Yun et al.,
“Comprehensive volumetric optical microscopy in vivo,”
Nat. Med., 12
(12), 1429
–1433
(2006). http://dx.doi.org/10.1038/nm1450 Google Scholar
W. Drexler et al.,
“Optical coherence tomography today: speed, contrast, and multimodality,”
J. Biomed. Opt., 19
(7), 071412
(2014). http://dx.doi.org/10.1117/1.JBO.19.7.071412 Google Scholar
J. Y. Kim, M. W. Lee and H. Yoo,
“Diagnostic fiber-based optical imaging catheters,”
Biomed. Eng. Lett., 4 239
–249
(2014). Google Scholar
D. S. Baim and W. Grossman, Grossman’s Cardiac Catheterization, Angiography, and Intervention, 7th ed.Lippincott Williams & Wilkins, Philadelphia
(2006). Google Scholar
G. J. Tearney et al.,
“Consensus standards for acquisition, measurement, and reporting of intravascular optical coherence tomography studies: a report from the international working group for intravascular optical coherence tomography standardization and validation,”
J. Am. Coll. Cardiol., 59
(12), 1058
–1072
(2012). http://dx.doi.org/10.1016/j.jacc.2011.09.079 Google Scholar
H. Yabushita et al.,
“Characterization of human atherosclerosis by optical coherence tomography,”
Circulation, 106
(13), 1640
–1645
(2002). http://dx.doi.org/10.1161/01.CIR.0000029927.92825.F6 CIRCAZ 0009-7322 Google Scholar
C. Xu et al.,
“Characterization of atherosclerosis plaques by measuring both backscattering and attenuation coefficients in optical coherence tomography,”
J. Biomed. Opt., 13
(3), 034003
(2008). http://dx.doi.org/10.1117/1.2927464 Google Scholar
G. van Soest et al.,
“Atherosclerotic tissue characterization in vivo by optical coherence tomography attenuation imaging,”
J. Biomed. Opt., 15
(1), 011105
(2010). http://dx.doi.org/10.1117/1.3280271 Google Scholar
G. J. Ughi et al.,
“Automated tissue characterization of in vivo atherosclerotic plaques by intravascular optical coherence tomography images,”
Biomed. Opt. Express, 4
(7), 1014
–1030
(2013). http://dx.doi.org/10.1364/BOE.4.001014 BOEICL 2156-7085 Google Scholar
L. Breiman,
“Random forests,”
Mach. Learn., 45
(1), 5
–32
(2001). http://dx.doi.org/10.1023/A:1010933404324 Google Scholar
G. van Soest et al.,
“Pitfalls in plaque characterization by OCT image artifacts in native coronary arteries,”
JACC Cardiovasc. Imaging, 4
(7), 810
–813
(2011). http://dx.doi.org/10.1016/j.jcmg.2011.01.022 Google Scholar
P. R. Moreno et al.,
“Detection of lipid pool, thin fibrous cap, and inflammatory cells in human aortic atherosclerotic plaques by near-infrared spectroscopy,”
Circulation, 105
(8), 923
–927
(2002). http://dx.doi.org/10.1161/hc0802.104291 CIRCAZ 0009-7322 Google Scholar
J. D. Caplan et al.,
“Near-infrared spectroscopy for the detection of vulnerable coronary artery plaques,”
J. Am. Coll. Cardiol., 47 C92
–96
(2006). Google Scholar
K. Jansen et al.,
“Photoacoustic imaging of human coronary atherosclerosis in two spectral bands,”
Photoacoustics, 2
(1), 12
–20
(2014). http://dx.doi.org/10.1016/j.pacs.2013.11.003 Google Scholar
S. Sethuraman et al.,
“Spectroscopic intravascular photoacoustic imaging to differentiate atherosclerotic plaques,”
Opt. Express, 16
(5), 3362
–3367
(2008). http://dx.doi.org/10.1364/OE.16.003362 Google Scholar
R. Leitgeb et al.,
“Spectral measurement of absorption by spectroscopic frequency-domain optical coherence tomography,”
Opt. Lett., 25
(11), 820
–822
(2000). http://dx.doi.org/10.1364/OL.25.000820 OPLEDP 0146-9592 Google Scholar
U. Morgner et al.,
“Spectroscopic optical coherence tomography,”
Opt. Lett., 25
(2), 111
–113
(2000). http://dx.doi.org/10.1364/OL.25.000111 Google Scholar
V. Jaedicke et al.,
“Spectroscopic optical coherence tomography for substance identification,”
Proc. SPIE, 8091 80911U
(2011). http://dx.doi.org/10.1117/12.889651 Google Scholar
B. Hermann et al.,
“Spectroscopic measurements with dispersion encoded full range frequency domain optical coherence tomography in single- and multilayered non-scattering phantoms,”
Opt. Express, 17
(26), 24162
–24174
(2009). http://dx.doi.org/10.1364/OE.17.024162 Google Scholar
C. Kasseck et al.,
“Comparison of optical coherence tomography, microcomputed tomography, and histology at a three-dimensionally imaged trabecular bone sample,”
J. Biomed. Opt., 15
(4), 046019
(2010). http://dx.doi.org/10.1117/1.3477193 Google Scholar
F. E. Robles and A. Wax,
“Measuring morphological features using light-scattering spectroscopy and Fourier-domain low-coherence interferometry,”
Opt. Lett., 35
(3), 360
–362
(2010). http://dx.doi.org/10.1364/OL.35.000360 Google Scholar
C. Xu, P. Carney and S. Boppart,
“Wavelength-dependent scattering in spectroscopic optical coherence tomography,”
Opt. Express, 13
(14), 5450
–5462
(2005). http://dx.doi.org/10.1364/OPEX.13.005450 Google Scholar
J. Yi, J. Gong and X. Li,
“Analyzing absorption and scattering spectra of micro-scale structures with spectroscopic optical coherence tomography,”
Opt. Express, 17
(15), 13157
–13167
(2009). http://dx.doi.org/10.1364/OE.17.013157 Google Scholar
R. N. Graf et al.,
“Detecting precancerous lesions in the hamster cheek pouch using spectroscopic white-light optical coherence tomography to assess nuclear morphology via spectral oscillations,”
J. Biomed. Opt., 14
(6), 064030
(2009). http://dx.doi.org/10.1117/1.3269680 JBOPFO 1083-3668 Google Scholar
A. L. Oldenburg et al.,
“Imaging gold nanorods in excised human breast carcinoma by spectroscopic optical coherence tomography,”
J. Mater. Chem., 19 6407
(2009). Google Scholar
D. J. Faber et al.,
“Toward assessment of blood oxygen saturation by spectroscopic optical coherence tomography,”
Opt. Lett., 30
(9), 1015
–1017
(2005). http://dx.doi.org/10.1364/OL.30.001015 OPLEDP 0146-9592 Google Scholar
X. Liu and J. U. Kang,
“Depth-resolved blood oxygen saturation assessment using spectroscopic common-path Fourier domain optical coherence tomography,”
IEEE Trans. Biomed. Eng., 57
(10), 2572
–2575
(2010). http://dx.doi.org/10.1109/TBME.2010.2058109 Google Scholar
J. Yi and X. Li,
“Estimation of oxygen saturation from erythrocytes by high-resolution spectroscopic optical coherence tomography,”
Opt. Lett., 35
(12), 2094
–2096
(2010). http://dx.doi.org/10.1364/OL.35.002094 OPLEDP 0146-9592 Google Scholar
J. R. Maher et al.,
“In vivo analysis of burns in a mouse model using spectroscopic optical coherence tomography,”
Opt. Lett., 39
(19), 5594
–5597
(2014). http://dx.doi.org/10.1364/OL.39.005594 OPLEDP 0146-9592 Google Scholar
Y. Zhao et al.,
“Evaluation of burn severity in vivo in a mouse model using spectroscopic optical coherence tomography,”
Biomed. Opt. Express, 6
(9), 3339
–3345
(2015). http://dx.doi.org/10.1364/BOE.6.003339 BOEICL 2156-7085 Google Scholar
C. P. Fleming et al.,
“Depth resolved detection of lipid using spectroscopic optical coherence tomography,”
Biomed. Opt. Express, 4
(8), 1269
–1284
(2013). http://dx.doi.org/10.1364/BOE.4.001269 BOEICL 2156-7085 Google Scholar
V. Jaedicke et al.,
“Comparison of different metrics for analysis and visualization in spectroscopic optical coherence tomography,”
Biomed. Opt. Express, 4
(12), 2945
–2961
(2013). http://dx.doi.org/10.1364/BOE.4.002945 BOEICL 2156-7085 Google Scholar
H. S. Cho et al.,
“High frame-rate intravascular optical frequency-domain imaging in vivo,”
Biomed. Opt. Express, 5
(1), 223
–232
(2013). http://dx.doi.org/10.1364/BOE.5.000223 BOEICL 2156-7085 Google Scholar
E. Stachowska et al.,
“Dietary trans fatty acids and composition of human atheromatous plaques,”
Eur. J. Nutr., 43
(5), 313
–318
(2004). http://dx.doi.org/10.1007/s00394-004-0479-x Google Scholar
T. W. de Bruin et al.,
“Different postprandial metabolism of olive oil and soybean oil: a possible mechanism of the high-density lipoprotein conserving effect of olive oil,”
Am. J. Clin. Nutr., 58
(4), 477
–483
(1993). Google Scholar
S. Lee et al.,
“Fully integrated high-speed intravascular optical coherence tomography/near-infrared fluorescence structural/molecular imaging in vivo using a clinically available near-infrared fluorescence-emitting indocyanine green to detect inflamed lipid-rich atheromata in coronary-sized vessels,”
Circ. Cardiovasc. Interventions, 7
(4), 560
–569
(2014). http://dx.doi.org/10.1161/CIRCINTERVENTIONS.114.001498 Google Scholar
A. M. Fard et al.,
“Optical coherence tomography—near infrared spectroscopy system and catheter for intravascular imaging,”
Opt. Express, 21
(25), 30849
–30858
(2013). http://dx.doi.org/10.1364/OE.21.030849 Google Scholar
H. S. Nam et al.,
“Automated detection of vessel lumen and stent struts in intravascular optical coherence tomography to evaluate stent apposition and neointimal coverage,”
Med. Phys., 43
(4), 1662
–1675
(2016). http://dx.doi.org/10.1118/1.4943374 MPHYA6 0094-2405 Google Scholar
“Review of USDA national nutrient database for standard reference, release 24 and dietary supplement ingredient database, release 2,”
J. Agric. Food Inf., 13
(4), 358
–359
(2012). http://dx.doi.org/10.1080/10496505.2012.718990 Google Scholar
C. Xu et al.,
“Separation of absorption and scattering profiles in spectroscopic optical coherence tomography using a least-squares algorithm,”
Opt. Express, 12
(20), 4790
–4803
(2004). http://dx.doi.org/10.1364/OPEX.12.004790 Google Scholar
A. Phinikaridou et al.,
“A robust rabbit model of human atherosclerosis and atherothrombosis,”
J. Lipid Res., 50
(5), 787
–797
(2009). http://dx.doi.org/10.1194/jlr.M800460-JLR200 Google Scholar
M. Han et al.,
“GPU-accelerated framework for intracoronary optical coherence tomography imaging at the push of a button,”
PLoS One, 10
(4), e0124192
(2015). http://dx.doi.org/10.1371/journal.pone.0124192 POLNCL 1932-6203 Google Scholar
|