|
|
1.IntroductionPhotoacoustic imaging (PAI) has become a popular biomedical imaging modality for its multiscale and multiresolution imaging capabilities in biological tissues, cells, and organs.1 Photoacoustic computed tomography (PACT) is a common form of PAI. In PACT, unfocused ultrasonic transducers (single-element or ultrasonic arrays) are used to detect the ultrasonic signals emitted from biological tissues, and then the photoacoustic images are recovered from the measurements through specific reconstruction algorithms. Ultrasonic-array PACT, in particular, has great potential for many preclinical and clinical applications because of its deeper and larger imaging fields; applications may include the early diagnosis of breast cancer, imaging of atherosclerosis, and whole body imaging of small animals.2–4 However, the ultrasonic array used in PACT typically contains several hundreds of densely packed transducers to obtain high-quality images, thus increasing the difficulty and cost of array fabrication. In addition, the number of channels in the data acquisition (DAQ) card is usually less than the number of ultrasonic detection elements in practical applications;5 thus, multiple laser pulses are required to obtain one B-scan measurement, which directly increases the DAQ and reconstruction times. The above factors usually limit wide application of PACT in many fields requiring high imaging speed.6,7 To overcome these problems, the compressed sensing (CS) technique has been incorporated into PACT and has provided faster DAQ with lower system costs.8–10 However, the reconstruction process for CS-based PACT is time consuming because of the inherent iterative computation; thus, fast image recovery cannot be achieved, despite the fast DAQ. Principal component analysis (PCA) is a commonly used statistical method that reduces the large dimensionality of a data space to the small intrinsic dimensionality of the feature space, and it also provides redundancy removal, feature extraction, or data compression.11 Hence, PCA is widely used in image processing and gene data mining.12,13 Now, PCA has been incorporated into medical imaging systems, such as MRI and CT, to improve their performance by incorporating the information extracted from related datasets.14–16 Recently, based on the singular value decomposition of the measurement data, a spatiotemporal reconstruction method for dynamic PACT was developed, and an image-domain PCA filter (named as: FBFIR-PCA) was also implemented as a comparison.17 In this paper, we developed a new high-speed three-dimensional (3-D) PACT method based on PCA (PCA-PACT) for ultrasonic array-based PACT. Our approach is different from the FBFIR-PCA discussed in Ref. 17. In FBFIR-PCA, all photoacoustic images are first reconstructed with full-sampling data, then they are employed to perform PCA and the quality of these images can be improved through PCA filtering. In our PCA-PACT, only partially full-sampling data are used to compute the principal components, and the main goal is to improve the image quality of PACT under sparse sampling. Compared with FIFIR-PCA, our method would provide faster DAQ and shorter image reconstruction time under the same system hardware configuration. A similar use of PCA in CT was reported in Ref. 14. In that work, for each view of the projection data, its nearby views are selected to perform the KL transform (i.e., PCA), and the estimate of the ideal sinogram at the chosen view can be computed by the PCA process. In our work, some full-sampling images evenly distributed on the imaging region are employed as training samples of PCA and other sparse-sampling images located among the fully sampled images can be recovered through the derived PCA bases. In vivo experiments on a human hand of our work demonstrated that, compared with the traditional back-projection (BP) method, PCA-PACT can provide high-quality 3-D photoacoustic images with fewer measurements, and the DAQ speed is greatly improved. Additionally, compared with that of the CS-based PACT, the image reconstruction speed of PCA-PACT improved dramatically when the same sparse-sampling rates were used, because of its noniterative algorithm. The proposed PCA-PACT system may present an effective approach for fast 3-D PACT, including DAQ and image reconstruction. 2.Methods2.1.Principal Component Analysis ModelPCA is a useful technique to reduce the dimensionality of the data by transforming the data to a new data domain called the feature space. The aim of PCA is to find a new basis in a low-dimensional space to represent the major features of the high-dimensional signals by using training samples. If the number of training images is , all training images can be described as a two-dimensional (2-D) matrix , where each training image is a row vector of the matrix with size (: pixel number of the image) that can be expressed as follows: The process using PCA to recover signals through training samples can be summarized in the following five steps:
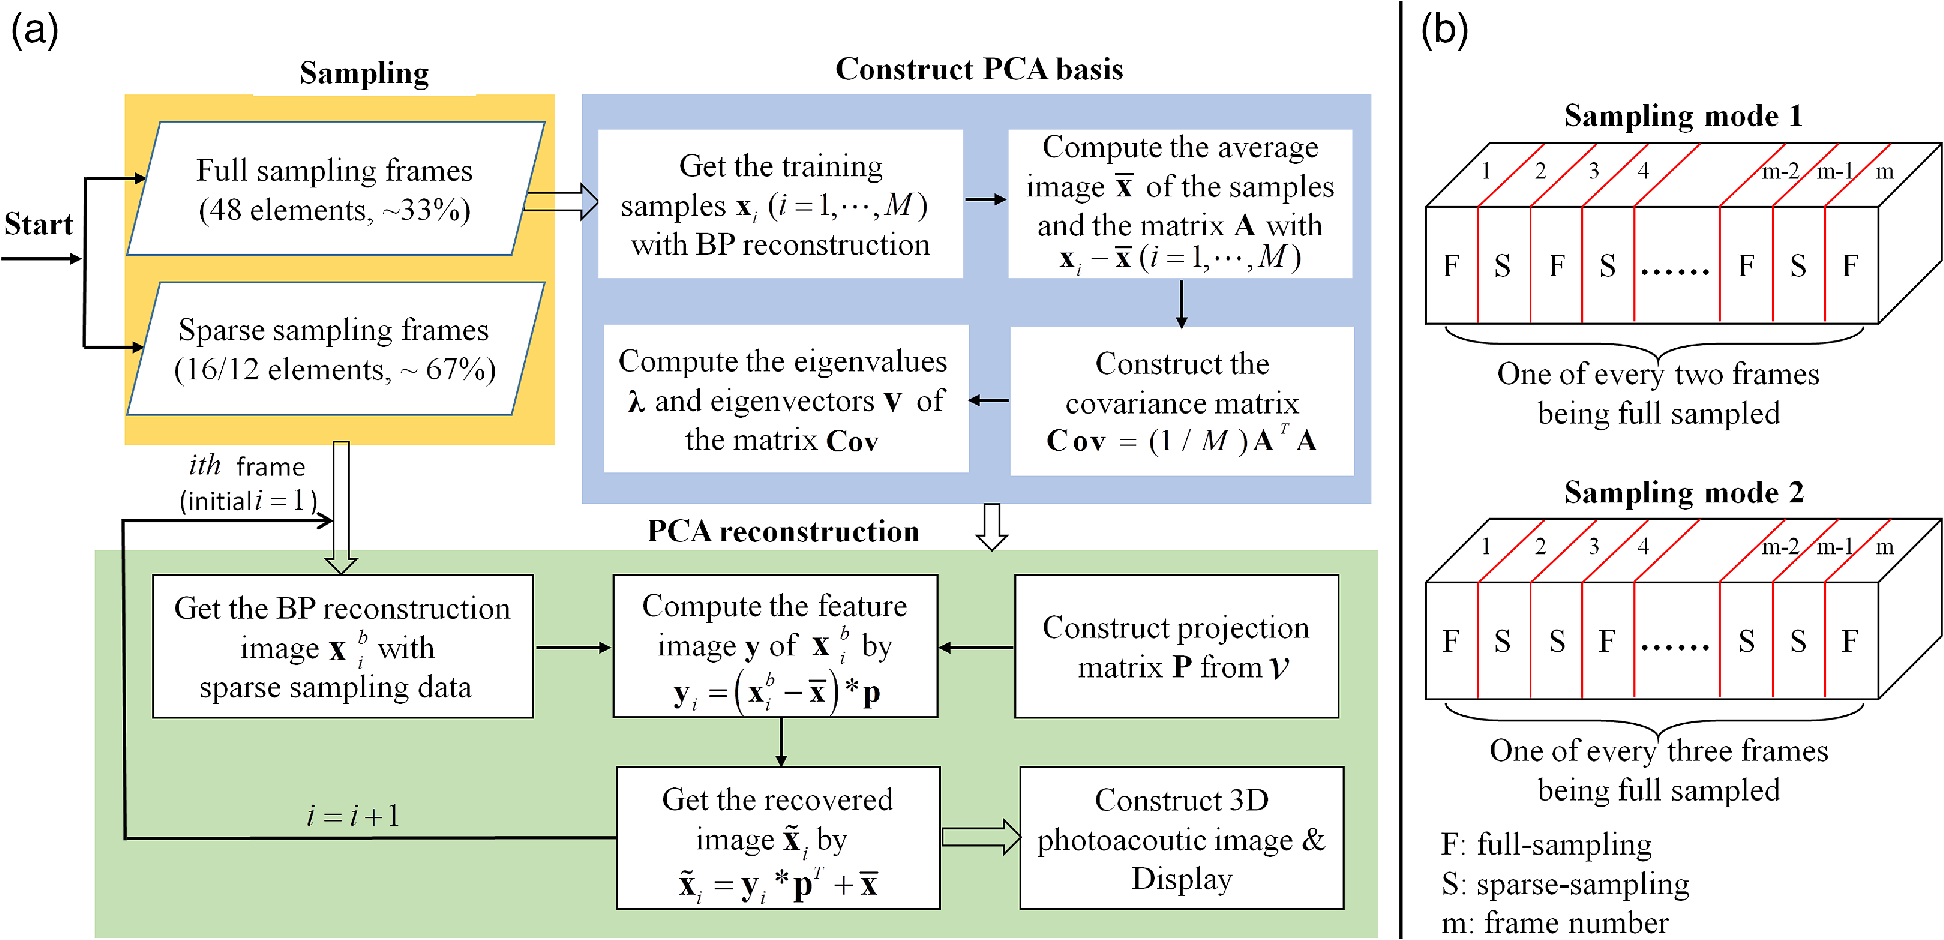
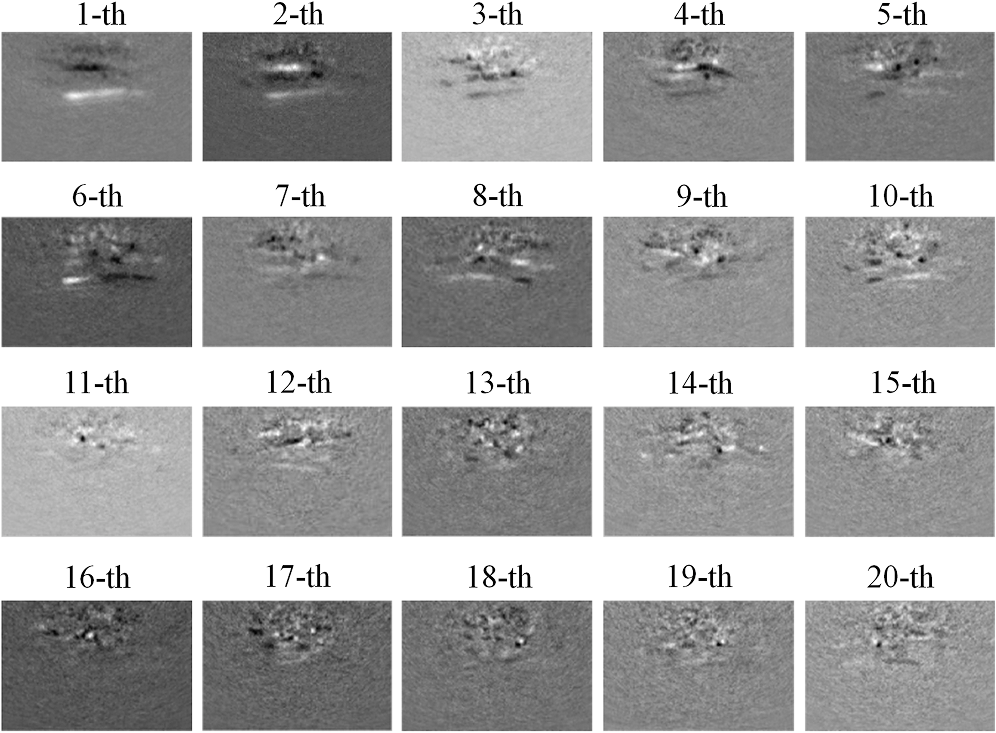
2.2.Photoacoustic Computed Tomography Reconstruction via Principal Component AnalysisThe PCA-PACT reconstruction process is illustrated by the flowchart shown in Fig. 1(a). This flowchart can be divided into three stages. (1) Sampling. In this stage, two sampling strategies of full sampling and sparse sampling are used to acquire the 3-D data of the entire imaging region. Here, full sampling means that all transducer elements of the ultrasonic array are used to collect a B-scan image; otherwise, it is called sparse sampling (a 48-element ultrasonic array is shown as an example in Fig. 1). In our work, two kinds of sampling modes were explored—one of every two and three frames along the elevational scanning direction was fully sampled, and the illustration of them is shown in Fig. 1(b). The largest number of sparse-sampling frames required to obtain satisfactory reconstructed results was of all frames in our imaging experiments. (2) Construct the PCA basis. To determine the basis vectors of PCA, the B-scan images reconstructed by the BP method with full sampling are used as training samples to construct the sampling matrix . Each row of is a row-vector difference image between the sample and the average image. Then, the covariance matrix can be obtained by multiplying the transpose of the sampling matrix and itself, and the eigenvalues and eigenvectors of the covariance matrix are computed by eigenvector decomposition. According to PCA theory, the PCA basis vectors are formed by a subset of the eigenvectors, and the subset can be determined by selecting the eigenvectors corresponding to the largest eigenvalues ( can be determined by tests in practical experiments). (3) PCA reconstruction. The PCA projection matrix is constructed by using the PCA basis vectors determined in the second stage, with each basis vector as a column of the matrix. Next, the reconstructed B-scan images with sparse sampling are transformed into its feature space by the projection matrix using Eq. (2), and then, a more accurate 2-D photoacoustic image can be recovered by the inverse process of PCA using Eq. (3). Finally, the 3-D photoacoustic images can be constructed by using the reconstructed 2-D B-scans. 3.Experiments and Results3.1.Imaging SystemA linear-array PACT system was used in this work, and its major components included a tunable dye laser pumped by a Q-switched Nd: YLF laser, a linear ultrasonic array with 48 elements (30-MHz center frequency and 70% bandwidth), and a multicore PC equipped with an 8-channel PCI DAQ card. Specifically, 570-nm light was used to illuminate the sample surface; this wavelength corresponds to an isosbestic point where oxy- and deoxyhemoglobin molecules have the same molar optical absorption coefficient. Then, the excited pressure waves were detected by the linear ultrasonic array. One B-scan was obtained from six pulses and stored in the PC by the DAQ, and 3-D data were acquired by mechanical scanning. Finally, the B-scan images were reconstructed with the proper algorithms (such as BP), and 3-D images were generated by using the maximum amplitude projection (MAP) technique. The human hand experiments described here were conducted in compliance with Washington University-approved protocols. 3.2.In Vivo Human Hand ExperimentsNoninvasive photoacoustic imaging of a human hand was performed to validate the developed PCA-PACT method. The 3-D photoacoustic image of the human hand consisted of 166 B-scans, and each reconstructed B-scan image was represented by . Figure 2 shows the photoacoustic images with measurements from 48, 16, and 12 transducer elements, reconstructed by different strategies. The image acquired by the traditional BP method with data from all 48 transducer elements is assumed as the control [Fig. 2(a)]. Figures 2(b) and 2(c) show the corresponding image reconstructed by BP with 16 and 12 transducer elements, respectively, and Figs. 2(d)–2(g) are the images reconstructed with PCA using different sampling data. Note that the images in Figs. 2(a)–2(g) are shown as the MAP—the maximum photoacoustic amplitudes projected along the depth direction of the surface of the hand. To further compare the reconstructed images, representative B-scan images corresponding to the cross-sections indicated by dash lines in Figs. 2(a)–2(g) are also shown [Figs. 2(a1)–2(g2)]. Compared with the control, the images reconstructed by BP with data from only 16 or 12 transducer elements became much worse [Figs. 2(b) and 2(c)]—many vascular signals were almost buried in the noise. However, the images reconstructed by PCA were dramatically improved [Figs. 2(d)–2(g)]. When one of every two frames was sparse sampled (i.e., 83 training samples were used) with measurements from only 16 transducer elements, the reconstructed photoacoustic images with PCA [Figs. 2(d), 2(d1), and 2(d2)] had almost the same reconstruction accuracy as the control with less background noise. Furthermore, when two of every three frames were sparse sampled (i.e., 56 training samples were used) with the measurements from only 12 transducer elements, the reconstructed results [Figs. 2(g), 2(g1), and 2(g2)] had almost the same quality as the control with few sparse-sampling artifacts. Thus, PCA-PACT can recover high-quality 3-D photoacoustic images, using fewer measurements than the conventional BP method. In the above experiments, 82 and 55 eigenvectors corresponding to the positive eigenvalues were chosen to construct the PCA bases for 83 and 56 training samples being used, respectively. To further clarify the principal components of PCA, images of 20 principal eigenvectors from 83 training samples are listed in Fig. 6, Appendix. Fig. 2Photoacoustic images of the subcutaneous vasculature of a human hand. (a–c) MAP images reconstructed by the BP method with data from 48, 16, and 12 transducer elements; (d, e) MAP images reconstructed by PCA using 83 training samples with 16 and 12 transducer elements; (f, g) MAP images reconstructed by PCA using 56 training samples with 16 and 12 transducer elements; (a1–g2) B-scan images along the vertical dashed lines shown in (a)–(g). is the (lateral) direction of the transducer array, is the mechanical scanning direction, and is the depth direction. The number 48, 16, or 12 indicates that the reconstruction is performed with data from 48, 16, or 12 transducer elements, respectively, and 83 or 56 is the number of training samples used in the PCA; the color scale represents relative optical absorption.  3.3.Quantitative AnalysisTo quantitatively evaluate the reconstructed results, two numerical analyses were performed. First, localized comparisons were performed by plotting photoacoustic amplitudes along chosen lines in B-scan images. Figures 3(a) and 3(b) are plots from B-scan images reconstructed by different strategies with data from 16 transducer elements and were obtained from the horizontal dashed lines shown in Figs. 2(a1) and 2(a2), respectively. Figures 3(c) and 3(d) are the plots from reconstructed images with data from 12 transducer elements along the horizontal dashed lines shown in Figs. 2(a1) and 2(a2), respectively. For a better quantitative comparison, the contrast-to-noise ratios (CNRs) of selected signal peaks were also computed (Fig. 3, insets). In our computations, the range from 4.3 to 5.7 mm along the -axis was used as an estimation of the background. It can be seen that the images recovered by PCA had higher CNRs than those obtained by BP. In particular, when only 12 transducer elements and 56 training samples were used, the photoacoustic images reconstructed by PCA exhibited a higher CNR than the control, which demonstrated the superiority of the PCA method in suppressing the reconstruction artifacts of PACT with fewer measurements. Fig. 3Plots of photoacoustic amplitudes (relative optical absorption) along the chosen dashed lines in B-scan images. (a, b) Plots of photoacoustic amplitudes from B-scans reconstructed by different strategies with data from 16 transducer elements along the horizontal dashed lines shown in Figs. 2(a1) and 2(a2), respectively; (c, d) plots of photoacoustic amplitudes from images reconstructed with data from 12 transducer elements along the dashed lines shown in Figs. 2(a1) and 2(a2), respectively. Insets: the CNRs of selected signal peaks; the number 48, 16, or 12 after each reconstruction method indicates the number of transducer elements of the data used in the reconstruction, and 56 or 83 is the number of training samples used in the PCA.  The second quantitative approach for comparison was the relative error (Rerr), which is defined as where is the control, and is the reconstructed image. Figure 4 shows the “Rerr” curves of photoacoustic images of all 166 frames; these curves represent the relative errors between the images reconstructed by BP or PCA and the control. Figure 4(A) includes two Rerr curves; one represents the Rerrs between images reconstructed by BP with 16 ultrasonic elements and the control, and the other represents the Rerrs between the control and the images reconstructed by PCA with data from 16 ultrasonic elements and 56 training samples. Figure 4(B) shows Rerr curves between the control and the images reconstructed with data from 16 transducer elements by BP and PCA with 83 training samples. Figures 4(c) and 4(d) are similar to the Rerr comparisons in Figs. 4(a) and 4(b), respectively, except that the images in the Rerr computation were reconstructed with data from 12 transducer elements. Compared with the BP method, PCA provided reconstructed images with lower Rerrs, for both 16 and 12 sparse-sampled measurements with either 83 or 56 training samples. Thus, the reconstruction accuracy is effectively improved by the PCA-PACT method when a sparse-sampling strategy is used.Fig. 4Plots of the relative errors of all 166 frames for in vivo human hand imaging. (a, b) Error plots between the control and images of BP16 and PCA16 using 56 and 83 training samples, respectively; (c, d) error plots between the control and images of BP12 and PCA12 using 56 and 83 training samples, respectively. The number 16 or 12 after each reconstruction method indicates that the reconstruction is performed with data from 16 or 12 transducer elements; 56 or 83 is the number of training samples used in the PCA.  3.4.Principal Component Analysis Versus Compressed Sensing for Photoacoustic Computed TomographyCS is currently used for photoacoustic imaging to improve its imaging quality when using fewer measurements. The imaging abilities of the PCA and CS methods were compared to further evaluate the performance of the proposed PCA-PACT method. Figures 5(A)–5(C) are MAP images of the vasculature of the human hand reconstructed by BP with data from 48 transducer elements, CS with data from 16 transducer elements, and PCA with data from 16 transducer elements using 56 training samples, respectively. Figures 5(a)–5(c) are B-scan images of the 40th frame reconstructed by the above three methods, respectively, and Figs. 5(d)–5(f) are the corresponding reconstructed results of the 110th frame. With the use of CS, the image quality improves significantly [Figs. 5(B), 5(b), and 5(e)], although some sparse-sampling artifacts are still notable. Surprisingly, when PCA was used, the higher quality photoacoustic images are recovered, and the sparse-sampling artifacts are effectively suppressed [Figs. 5(C), 5(c), and 5(f)]. To compare the two methods, the CNRs of the B-scan images reconstructed by PCA and CS were also computed and are listed in Table 1 [note: the positions of the peak signals and background region used in the CNR computations are indicated in Figs. 5(a) and 5(d)]. In this case, the CNRs of the images reconstructed by PCA were approximately twice as large as those for BP. Further, the difference images between the results reconstructed by CS and PCA and the control were generated and are shown in Fig. 5. Figures 5(I1) and 5(I2) are the difference images between CS16 and the control of the 40th and 110th frames, respectively, and Figs. 5(I3) and 5(I4) are those between PCA16_56 and the control of the two frames. Compared with Figs. 5(I1) and 5(I2), Figs. 5(I3) and 5(I4) are more similar to the background noise, suggesting that the images reconstructed using the PCA method possessing higher fidelity. Fig. 5Photoacoustic images reconstructed by CS and PCA methods. (A–C) MAP images reconstructed by BP with data from 48 transducer elements, CS with data from 16 transducer elements, and PCA with data from 16 transducer elements and 56 training samples; (a, d) the 40th and 110th B-scan images from (A); (b, e) the 40th and 110th B-scan images from (B); (c, f) the 40th and 110th B-scan images from (C); (I1, I2) difference images between BP48 and CS16 of the 40th and 110th frames; (I3, I4) difference images between BP48 and PCA16_56 of the 40th and 110th frames. The number 48 or 16 after each reconstruction method indicates that the reconstruction is performed with data from 48 or 16 transducer elements, respectively; 56 is the number of training samples used in the PCA.  Table 1Comparisons of the performance of different reconstruction methods.
Moreover, the imaging times were computed for the BP, CS and PCA methods and are listed in Table 1 as a measure of the imaging speed (note: all the statistical computations were done on a PC with an Intel Core G640 CPU of 2.8 GHz). For different reconstruction methods with different measurements and training samples, the corresponding image reconstruction time and DAQ time for one frame are all presented in this table. The following conclusions can be drawn from this data: (1) PCA16_56 has an shorter DAQ time than that of the methods with data from 48 transducer elements and an -fold longer DAQ time than that of the methods with data from 16 transducer elements; (2) PCA16_56 has a nearly eightfold faster reconstruction time than the CS method with data from 16 transducer elements and faster reconstruction time than BP with data from 48 transducer elements; (3) For the sum of the DAQ and image reconstruction times, the overall 3-D imaging speed of PCA16_56 is ∼sevenfold faster than the speed of the CS method with data from 16 transducer elements and -fold faster than the speed of the BP method with data from 48 transducer elements. 4.Discussion and ConclusionsIn vivo human hand experiments verified the effectiveness and superiority of PCA-PACT. However, several factors must still be discussed to further understand the proposed method. First, it should be emphasized that PCA-PACT has the potential to decrease the system cost. In many PACT applications, the number of channels of the DAQ system is usually only a fraction (e.g., or ) of the number of elements of the ultrasonic transducer array due to the high cost of high-speed multichannel DAQ systems. This configuration—the number of DAQ channels much smaller than the number of elements of the ultrasonic array—is even true for many presently clinically used ultrasonic imaging systems. Thus, to acquire one B-scan cross-section image, multiple laser pulses will be required, increasing the image acquisition time significantly due to the usually low laser repetition rate used in PACT (typically 10 to 20 Hz). Therefore, with the same number of DAQ channels, our PCA-PACT method will increase the imaging speed by requiring a much smaller total number of laser firing for acquiring a full 3-D image that usually consists of hundreds of B-scans. In other words, with our PCA-PACT method, to maintain the same imaging speed, a low-cost PACT system with a much smaller number of DAQ channels can be implemented. Second, our developed PCA-PACT may have the potential for photoacoustic dynamic imaging. Specifically, an initial photoacoustic image can be acquired and reconstructed using full sampling; with this, a static vasculature map as well as the PCA bases mapping the imaged vasculature can be obtained. Then, subsequent high-speed dynamic imaging reflecting the intensity changes of signal distribution among the vasculature can be obtained through sparse sampling and the derived PCA bases. In the future, important biomedical applications, such as high-speed monitoring of the cerebral hemodynamics of small animals in vivo, may be conducted with this method. Third, to obtain high-quality photoacoustic images, PCA-PACT requires more measurements than the CS approach; i.e., the DAQ time is longer. However, better accuracy and higher reconstruction speed can be obtained by PCA-PACT when using the same sampling rates for sparse-sampling frames. Fourth, the requirement for training samples in PCA-PACT makes it applicable only to 3-D photoacoustic imaging in practical applications. In summary, our in vivo human hand experiments demonstrated that the proposed PCA-PACT method can effectively decrease the DAQ and image reconstruction times of PACT with ultrasonic arrays. Compared with the BP method using data from all transducer elements, PCA16_56 has an almost 50% faster DAQ time. Moreover, the image reconstruction of PCA16_56 is more than eight times as fast as that of the CS method for data from 16 transducer elements. The results of this study suggest that PCA-PACT may be an effective approach for low-cost, 3-D, rapid PACT and thus may greatly enhance its biomedical applications. AppendicesAppendix:Images of Principal EigenvectorsTo make an intuitive understanding of the principal components computed by PCA, images of 20 principal eigenvectors are shown in Fig. 6 for 83 training samples being used in our experiments. In this figure, the ’th represents the eigenvector-image corresponding to the ’th large eigenvalue. AcknowledgmentsThis work was supported in part by the National Natural Science Foundation of China Grants Nos. 61308116, 61205203, 61201307, and 61572283, the China-ROK joint research program (NRF-2013K1A3A1A20046921), the International Science and Technology Cooperation Program of China (MOST) Grant No. 2014DFG32800, the Award Foundation Project of Excellent Young scientists in Shandong Province (BS2014DX005), and the Opening Project of Key Lab of Health Informatics of Chinese Academy of Sciences. ReferencesL. V. Wang and S. Hu,
“Photoacoustic tomography: in vivo imaging from organelles to organs,”
Science, 335
(6075), 1458
–1462
(2012). http://dx.doi.org/10.1126/science.1216210 SCIEAS 0036-8075 Google Scholar
S. A. Ermilov et al.,
“Laser optoacoustic imaging system for detection of breast cancer,”
J. Biomed. Opt., 14
(2), 024007
(2009). http://dx.doi.org/10.1117/1.3086616 JBOPFO 1083-3668 Google Scholar
P. Kruizinga et al.,
“Photoacoustic imaging of carotid artery atherosclerosis,”
J. Biomed. Opt., 19
(11), 110504
(2014). http://dx.doi.org/10.1117/1.JBO.19.11.110504 JBOPFO 1083-3668 Google Scholar
J. Gateau et al.,
“Three-dimensional optoacoustic tomography using a conventional ultrasound linear detector array: whole-body tomographic system for small animals,”
Med. Phys., 40
(1), 013302
(2013). http://dx.doi.org/10.1118/1.4770292 MPHYA6 0094-2405 Google Scholar
L. Song et al.,
“Ultrasound-array-based real-time photoacoustic microscopy of human pulsatile dynamics in vivo,”
J. Biomed. Opt., 15
(2), 021303
(2010). http://dx.doi.org/10.1117/1.3333545 JBOPFO 1083-3668 Google Scholar
C. H. Li et al.,
“Real-time photoacoustic tomography of cortical hemodynamics in small animals,”
J. Biomed. Opt., 15
(1), 010509
(2010). http://dx.doi.org/10.1117/1.3302807 JBOPFO 1083-3668 Google Scholar
M. Heijblom et al.,
“Visualizing breast cancer using the Twente photoacoustic mammoscope: what do we learn fro twelve new patient measurements?,”
Opt. Express, 20
(11), 11582
–11597
(2012). http://dx.doi.org/10.1364/OE.20.011582 OPEXFF 1094-4087 Google Scholar
J. Meng et al.,
“Compressed-sensing photoacoustic computed tomography in vivo with partially known support,”
Opt. Express, 20
(15), 16510
–16523
(2012). http://dx.doi.org/10.1364/OE.20.016510 OPEXFF 1094-4087 Google Scholar
J. Provost and F. Lesage,
“The application of compressed sensing for photo-acoustic tomography,”
IEEE Trans. Med. Imaging, 28
(4), 585
–594
(2009). http://dx.doi.org/10.1109/TMI.2008.2007825 ITMID4 0278-0062 Google Scholar
J. Meng et al.,
“Compressed sensing based virtual-detector photoacoussic microscopy in vivo,”
J. Biomed. Opt., 19
(3), 036003
(2014). http://dx.doi.org/10.1117/1.JBO.19.3.036003 JBOPFO 1083-3668 Google Scholar
H. Abdi and L. J. Williams,
“Principal component analysis,”
Wiley Interdiscip. Rev., 2
(4), 433
–459
(2010). http://dx.doi.org/10.1002/wics.v2:4 WIRSBW 1939-005X Google Scholar
L. Khedher et al.,
“Early diagnosis of Alzheimer’s disease based on partial least squares, principal component analysis and support vector machine using segmented MRI images,”
Neurocomputing, 151
(P1), 139
–150
(2015). http://dx.doi.org/10.1016/j.neucom.2014.09.072 NRCGEO 0925-2312 Google Scholar
J. Liu et al.,
“RPCA-based tumor classification using gene expression data,”
IEEE ACM Trans. Comput. Biol. Bioinform., 12
(4), 964
–970
(2015). http://dx.doi.org/10.1109/TCBB.2014.2383375 Google Scholar
J. Wang et al.,
“Penalized weighted least-squares approach to sinogram noise reduction and image reconstruction for low-dose X-ray computed tomography,”
IEEE Trans. Med. Imaging, 25
(10), 1272
–1283
(2006). http://dx.doi.org/10.1109/TMI.2006.882141 ITMID4 0278-0062 Google Scholar
L. Ouyang, T. Solberg and J. Wang,
“Noise reduction in low-dose cone beam CT by incorporating prior volumetric image information,”
Med. Phys., 39
(5), 2569
–2577
(2012). http://dx.doi.org/10.1118/1.3702592 MPHYA6 0094-2405 Google Scholar
B. Trémoulhéac et al.,
“Dynamic MR image reconstruction-separation from under-sampled (k, t) -space via low-rank plus sparse prior,”
IEEE Trans. Med. Imaging, 33
(8), 1689
–1701
(2014). http://dx.doi.org/10.1109/TMI.2014.2321190 ITMID4 0278-0062 Google Scholar
K. Wang et al.,
“Fast spatiotemporal image reconstruction based on low-rank matrix estimation for dynamic photoacoustic computed tomography,”
J. Biomed. Opt., 19
(5), 056007
(2014). http://dx.doi.org/10.1117/1.JBO.19.5.056007 JBOPFO 1083-3668 Google Scholar
BiographyJing Meng is an associate professor at Qufu Normal University. She received her PhD in computer engineering from Soochow University in 2006. She was engaged in photoacoustic imaging as a research fellow at Shenzhen Institutes of Advanced Technology, Chinese Academy of Sciences from 2011 to 2013. Her current research interests include photoacoustic imaging, reconstruction algorithms, and signal processing. Zibo Jiang received her BS degree in computer science and technology from Qufu Normal University (QFNU), China, in 2013. She is currently master student in computer science and technology at QFNU. Her research interests include signal processing and image reconstruction algorithms. Lihong V. Wang earned his PhD at Rice University, Houston, Texas. He currently holds the Gene K. Beare distinguished professorship of biomedical engineering at Washington University in St. Louis. He has published 342 peer-reviewed journal articles and delivered 370 keynote, plenary, or invited talks. His Google Scholar h-index and citations have reached 81 and over 26,000, respectively. Jongin Park received his BS degree in electrical engineering from Pohang University of Science and Technology (POSTECH), Korea, in 2009. He is currently PhD student in electrical engineering at POSTECH. His research interests include signal processing, computing, and their applications to biology. Chulhong Kim is an associate professor of Creative IT Engineering at Pohang University of Science and Technology in Republic of Korea. Before he joined the department, he was an assistant professor of biomedical engineering at the University at Buffalo, the State University of New York, from August 2010 to January 2013. He studied for his PhD and postdoctoral training at Washington University in St. Louis, St. Louis, Missouri, USA. Mingjian Sun is an associate professor in the School of Information and Electrical Engineering, Harbin Institute of Technology in Weihai. He received his BS, MS, and PhD degrees from Harbin Institute of Technology, Harbin, China, in 2003, 2005, and 2011, respectively. His current research interests include photoacoustic imaging, ultrasound imaging, multimode nondestructive detecting, and photoacoustic elastography. Yuanke Zhang is an associate professor at Qufu Normal University. He received his PhD in computer application technology from Xidian University in 2011. His research interests include computer tomography imaging, low-dose CT image noise reduction, and reconstruction algorithms. Liang Song is professor and founding director of the Research Lab for Biomedical Optics and Molecular Imaging at the Shenzhen Institutes of Advanced Technology, the Chinese Academy of Sciences. He also serves as the founding director of the Shenzhen Key Lab for Molecular Imaging. Prior to joining SIAT, he studied at Washington University, St. Louis, under the tutelage of Lihong Wang and received his PhD in biomedical engineering in 2010. |
|||||||||||||||||||||||||||||||||