

|
|
1.IntroductionBreast cancer is the second most commonly diagnosed cancer among South Korean women. The incidence of breast cancer has been continuously and rapidly increasing over the past 20 years in South Korea. From 1993 to 2012, the crude incidence rate rose from 15/100,000 to 68.2/100,000 per year.1–3 Interestingly, the median age of breast cancer diagnosis in South Korean women is 49, which is about a decade younger compared to women in the United States (61 years of age).1 The current National Cancer Screening Program Guidelines in Korea recommends a screening mammogram for women every 2 years. However, mammography is well known for its low sensitivity in younger women and individuals with dense breasts.4,5 This limitation becomes more problematic in South Korea because of the high prevalence of dense breast in its overall population.6 Supplemental screening ultrasonography has been found to play a substantial role in additional cancer detection in women with negative mammograms due to high breast density. However, one of the main barriers to the implementation of supplemental screening ultrasonography is its high false-positive findings, leading to many benign biopsy results.7 A North American study has shown that out of all breast biopsies, which are performed in 2% to 3% of screened women, only 34.1% are diagnosed as malignant tumors in the overall population. In women under 50 years of age, this positive biopsy rate drastically decreases to only 14.2%.8 This underscores a clear need for a tool that could help the current standard of care (SOC) imaging techniques to distinguish benign from malignant masses and reduce the number of unnecessary biopsies in young patients. Because of the high occurrence of premenopausal breast cancer patients in South Korea, it is critical to address these limitations in South Korean women. Diffuse optical spectroscopic imaging (DOSI) measures functional and metabolic information of centimeter-thick tissue using near-infrared (NIR) light. Spectroscopy provides concentrations of the main tissue absorbers (i.e., deoxy-hemoglobin, oxy-hemoglobin, water, and lipid), and informs about tissue perfusion and metabolism.9 The spectral features of DOSI can reveal additional information about the molecular disposition of these and additional components that have been shown to be linked to the level of malignancy of a lesion.10 These “specific tumor components (STC)” have been shown to identify tumors in dense breasts,11 and to differentiate between benign and malignant breast lesions with 91% sensitivity and 94% specificity in a mixed cohort of pre- and postmenopausal women.12 In this study, we validate the performance of DOSI to distinguish benign and malignant lesions in 19 premenopausal South Korean subjects (21 breast lesions). While similar work has been done in North American populations, this is the first study of its kind to take place in South Korea and with a population limited to premenopausal women. The long-term goal of this work is to improve imaging-based differential diagnosis of breast lesions in dense breasts by introducing a complimentary technology based upon functional, rather than anatomic characteristics of tissue. The addition of optical spectroscopy may help reduce the need for biopsy in many false-positive cases, especially in young patients. 2.Materials and Methods2.1.Patients and Study DesignPremenopausal, nonpregnant subjects with a clinical finding of Breast Imaging Reporting and Data System (BI-RADS) assessment category 2 and higher13,14 were offered participation in this prospective study. All participants provided informed consent that was approved by the institutional review committee of Dankook University Hospital. All DOSI measurements took place between May 2014 and August 2015 at Dankook University Hospital, Cheonan. All subjects underwent SOC ultrasound (US) imaging. The subjects were referred to the radiologist for US imaging because of a suspicious mammographic screening or because of a newly palpated breast mass. Patients with a finding of BI-RADS category 4 and higher underwent MRI and biopsy. If requested by patients, biopsies were also performed on BI-RADS category 3 findings. Study participants were measured by the same DOSI operator and, if applicable, at least 8 days after biopsy. 2.2.InstrumentationThe DOSI instrument combines frequency domain photon migration (FDPM) and broadband steady-state (SS) NIR spectroscopy for quantitative, model-based broadband measurements of tissue absorption and reduced scattering spectra from 650 to 1000 nm. The full technical details of the system are described elsewhere.15,16 Briefly, the FDPM component uses 4 laser diodes (Blue Sky Research, Sanyo, Mitsubishi) at the wavelengths 660, 680, 785, 810 nm. The breast is illuminated sequentially by each laser diode. When active, each laser diode is intensity modulated at 451 modulation frequencies swept from 50 to 500 MHz (). The diffusely scattered light that propagates through tissue is detected by an avalanche photodiode (Hamamatsu module C5658) mounted inside a temperature-controlled hand-held probe. The SS component uses a high-intensity tungsten-halogen source (Mikropack model HL-2000-HP-FHSA) to illuminate the tissue, and the diffusely scattered light that propagates through the tissue is detected by a grating-based spectrometer that collects light from 650 to 1000 nm (1024 pixels, BWTek model 611E). The FDPM and SS sources are coupled by independent optical fibers mounted into the hand-held probe. The source–detector separation was 28 mm (breast measurement) for both FDPM and SS components with fibers placed in an overlapping geometry. FDPM and SS data are combined using a diffusion theory model to provide broadband absorption () and reduced scattering () spectra from 650 to 1000 nm. In the FDPM measurement, the phase and amplitude of the detected light are recorded as functions of source modulation frequency and fit to a diffusive model of light transport with semi-infinite boundary conditions to recover and at each of the four laser wavelengths. SS broadband reflectance spectra were converted into absolute absorption spectra using two steps. First, the spectral shape of the reduced scattering spectrum is assumed to follow a power law of the form , where is the scatter amplitude and is the scatter power, or the exponent of the reduced scattering spectrum. The power-law fit to the FDPM discrete laser diode spectrum provides a scatter correction for the SS reflectance spectrum. We then fit the SS reflectance intensity at each of the laser diode wavelengths to the reflectance calculated from the FDPM-measured absolute absorption values. Thus, the SS reflectance spectrum intensity is quantitatively scaled using the FDPM discrete measurements. The absolute absorption spectrum is then extracted by fitting the corrected reflectance spectrum to a diffusion reflectance model.15,16 2.3.Measurement ProcedureDOSI measurements were performed using a standard protocol.17 With the patient supine, the DOSI probe was placed against the breast tissue and sequential measurements were taken in a rectangular grid pattern using 10-mm spacing. The opposite breast was measured for comparison. The dimensions of the grids ranged from to . The grid size was chosen to fully encompass the lesion’s anatomic extent (by US or palpation) and to capture at least surrounding normal tissue. The grid on the contralateral breast (normal side) was mirrored from the grid on the lesion-containing breast (lesion side). An example of DOSI imaging grid locations and the resulting DOSI images are provided in Fig. 1. 2.4.Spectral AnalysisConcentrations of oxy-hemoglobin (), deoxy-hemoglobin (ctHHb), water (), and bulk lipid (ctLipid) were calculated by fitting a linear combination of their known molar extinction coefficient spectra to the tissue absorption.18 From these quantities, the total blood volume (), percent oxygen saturation (), and tissue optical index () were calculated. TOI has been shown to provide high contrast and sensitivity to chemotherapy response.9 Quantitative images of the local tissue concentrations, the scattering parameters, and contrast functions were formed for visualization. Each specific tumor component (STC) spectrum was assessed by calculating the residual of the fit of the lesion absorption (corrected for normal tissue absorption) to the four principal chromophore extinction spectra. Details of this method have been reported.10 Briefly, the difference between tumor and healthy tissue absorption spectra tissue is calculated. This first differential provides a spectrum that removes spectral components common to both tissues. The difference between the aforementioned first differential and its fit to the four chromophores basis spectra forms the STC spectrum. The STC spectrum represents the contributions of other chromophores not accounted for in the basis spectra fit (e.g., other by-products of hemoglobin such as met-hemoglobin or carboxy-hemoglobin). In addition, the STC contains information on shifts of the water and lipid peaks that correlate with different molecular states between lesions and normal tissue. 2.5.Malignancy IndexA previously published malignancy index is used to classify lesions as malignant or benign according to their STC spectral features.12 In brief, the algorithm identifies spectral features specific to malignant and benign lesions and maximizes the differences by weighting different wavelength regions. Weighting factors are determined by using computer processing through an iterative process for each wavelength region to determine what combination of values for each wavelength region would best separate the benign from the malignant lesions. It then translates the distance of the weighted spectra to the average weighted spectra of benign and malignant lesion into an index. The malignancy index ranges from to 1. (A more negative value indicates a benign classification and a more positive value indicates a malignant classification.) Details about the algorithm can be found in the appendix of Kukreti et al.12 Kukreti et al.,12 who introduced the malignancy index, reported that a dataset of 20 cases was sufficient to ensure reliable classification of benign and malignant lesions. Our study includes 21 lesions. 2.6.Statistical AnalysisFrom the DOSI images, a region of interest (ROI) representing the lesion was defined using the US lesion size and was centered on the TOI lesion enhancement. In case the DOSI lesion enhancement was not clearly apparent, the lesion location by palpation or US (for the nonpalpable cases) was used to help localize the lesion in the TOI image. A normal tissue ROI was selected in the normal breast to mirror the lesion ROI. Only the original point measurements (not the interpolated) were included in the ROI. Lesion and normal DOSI variables were determined by calculating the mean and standard deviation (SD) of the measurement locations within the ROIs. In this work, we report the lesion to normal ratio (L/N), which accounts for the high inter-subject biological variations.19,20 L/N was obtained in all DOSI variables, i.e., ctHHb, , , ctLipid, ln(A), b, THb, , and TOI, except the malignancy index (normal tissue already taken into account in its calculation). Note that we use the natural logarithm of because of its wide range of values. Box plots were used to show the distribution of the L/N DOSI variables: the box represents the 25th to 75th percentiles and median of the depicted values, the whiskers represent the SD, and the square represents the average value. The Shapiro–Wilk test was performed to examine the normality of the distribution of all variables. The two-sample -test and Wilcoxon Rank Sums test were used to compare benign and malignant lesions for the normally and nonnormally distributed variables, respectively. Statistical significance was assumed for a -value . Univariate logistic regression was performed to assess the relationship between the DOSI predictor and diagnosis outcome. The area under the curve (AUC) and 95% confidence interval were reported. Accuracy, sensitivity, specificity, negative predictive values (NPVs), and positive predictive values (PPVs) were also reported for an optimal threshold that would generate the minimum difference between the sensitivity and the specificity. All statistics were performed using statistical analysis system v9.4. 2.7.Clinical FindingsBreast density is reported using the BI-RADS of breast tissue composition from the American College of Radiology.13 It is classified into four categories that are qualitatively based on the relative amounts of fat and dense fibroglandular tissue observed in a mammogram. Category “a” refers to almost entirely fatty tissue, category “b” to scattered fibroglandular densities that could potentially obscure a lesion, category “c” to heterogeneously dense breast type and the sensitivity of mammography may be lowered, and category “d” to extremely dense breast type that will lower the sensitivity of mammography. Histopathology was determined from biopsy specimens for 16 out of the 21 lesions. The five remaining lesions were diagnosed as BI-RADS category 2 and 3 using US imaging with or without mammography. Per clinical guidelines, BI-RADS category 2 does not require any treatment/follow-up, and BI-RADS category 3 requires only short-interval follow-ups.14 3.Results3.1.Patient and Tumor CharacteristicsTable 1 presents the characteristics of the subjects enrolled in this study. The average (SD, range) age of subjects was 41 (9, ranging from 20 to 53). Note that the subjects with a malignant lesion were on average older than the ones with a benign lesion; 46 (4, ranging from 37 to 53) versus 35 (9, ranging from 20 to 45), respectively. Because mammography is not routinely performed on young patients, especially in case of benign findings, the breast density was available in only 13 out of the 19 subjects overall, and in 3 out of the 9 subjects with a benign lesion. As expected, high breast density (categories c and d) was observed in 11 out of the 13 subjects who underwent mammography. Table 1Subject characteristics.
Table 2 reports the lesion characteristics at the subject level. All malignant lesions were invasive ductal carcinoma (IDC). Fibroadenoma accounted for of the benign lesions. Histopathology of all malignant lesions was determined by biopsy and confirmed at surgery. Seven out of eleven benign lesions were diagnosed by biopsy. One benign lesion was diagnosed as fibroadenoma using US imaging, and required 6-month follow-up appointments. One benign lesion that had been diagnosed as fibroadenoma two years prior to the study did not show any change in size during the 6-month follow-up visits. One benign lesion was diagnosed as an oil cyst using US imaging. One benign lesion was diagnosed as fibro-cystic change using US imaging and mammography. Table 2Lesion characteristics.
The average (SD, range) lesion size measured by US imaging (greatest dimension) was 2.0 cm (1.3 cm, 0.7 to 5.6 cm). The average (SD, range) lesion depth measured by US imaging was 0.8 cm (0.4 cm, 0.1 to 1.6 cm). Notably, while the malignant and benign lesions were located at similar depth in the breast, their average sizes differed substantially: malignant lesions were on average larger than the benign lesions, with average (SD, range) sizes of 2.6 cm (1.5 cm, 1.2 to 5.6 cm) and 1.7 cm (0.8 cm, 0.7 to 2.8 cm), respectively. All malignant masses were found to be palpable, while only 5 out of 11 benign masses could be palpated. DOSI enhancement of the lesion was not clearly apparent for 8 out of the 21 cases. For two benign lesions, the DOSI enhancement was similar to normal tissue. For six lesions, five benign and one malignant, the enhancement was partially mixed with the areolar enhancement. For these eight cases, the lesion location by palpation or US (for the nonpalpable cases) was used to help localize the lesion in the TOI image to calculate the lesion ROI. 3.2.DOSI and SOC ImagingFigures 1 and 2 present two typical examples of benign and malignant lesions measured using DOSI and using SOC imaging. 3.3.Comparison of DOSI Parameters in Malignant and Benign LesionsFigure 3 compares the averaged STC spectra for the benign lesions, malignant lesions, and normal tissue on the contralateral side. As expected, due to the specificity of the STC to tumors, we observe little to no spectral features in the STC spectra of the normal tissue. For malignant lesions, the spectral content shows greater magnitude than for the benign lesions. Distinctive spectral differences also exist between the STC spectra of the benign and malignant lesions. Fig. 3Average STC spectra for 10 malignant lesions (solid black), 11 benign lesions (dashed black), and 21 contralateral normal tissue regions (solid gray). Error bars show the distribution of the population. 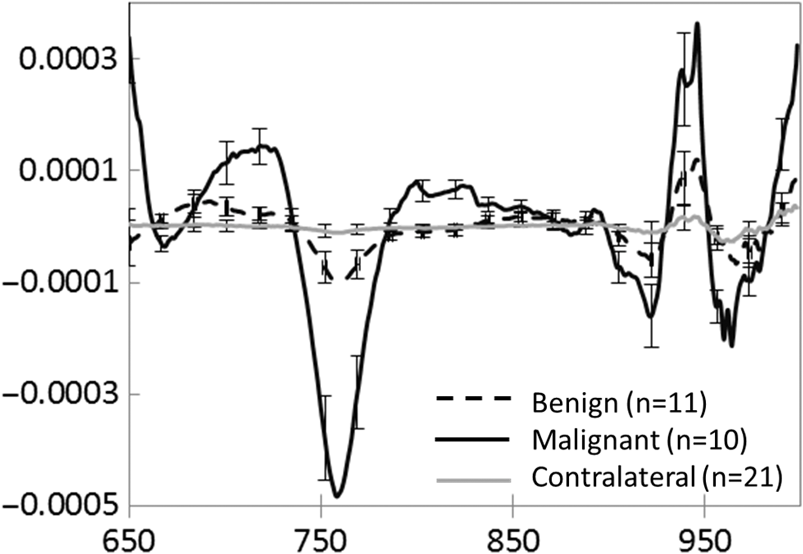 Figure 4 and Table 3 compare the distribution of lesion to normal (L/N) in all DOSI parameters between the benign and malignant cases. Based on the Shapiro–Wilk test, only and the malignancy index were found to be normally distributed (data not shown). As a result, the two-sample -test was applied to and the malignancy index, and the Wilcoxon Rank Sums test to the rest of the variables to assess the statistical difference between benign and malignant lesions. As observed in Fig. 4 and Table 3, the malignant group exhibited on average greater L/N values than the benign group for all DOSI parameters except for the lipid. These differences were found to be statistically significant in all parameters except for the lipid and (-value provided in Fig. 4 and Table 3). A complete list of absolute DOSI parameters for benign and malignant lesions is provided in Table 4. Malignant lesions exhibited greater ctTHb, , , TOI, ctHHb content than benign lesions; however, a detailed statistical comparison was not performed. Fig. 4Distribution of L/N in the groups of benign (plain) and malignant (striped) lesions in (a) scattering power , ln(A), , HHb, water, lipid, THb, , (b) TOI, and (c) malignancy index. Mean value in each group is indicated with a square. Boxes show the median and the 25th and 75th percentiles. Whiskers show the SD. The blue star indicates a statistically significant difference between the two groups (Wilcoxon Rank Sums test, -value provided). 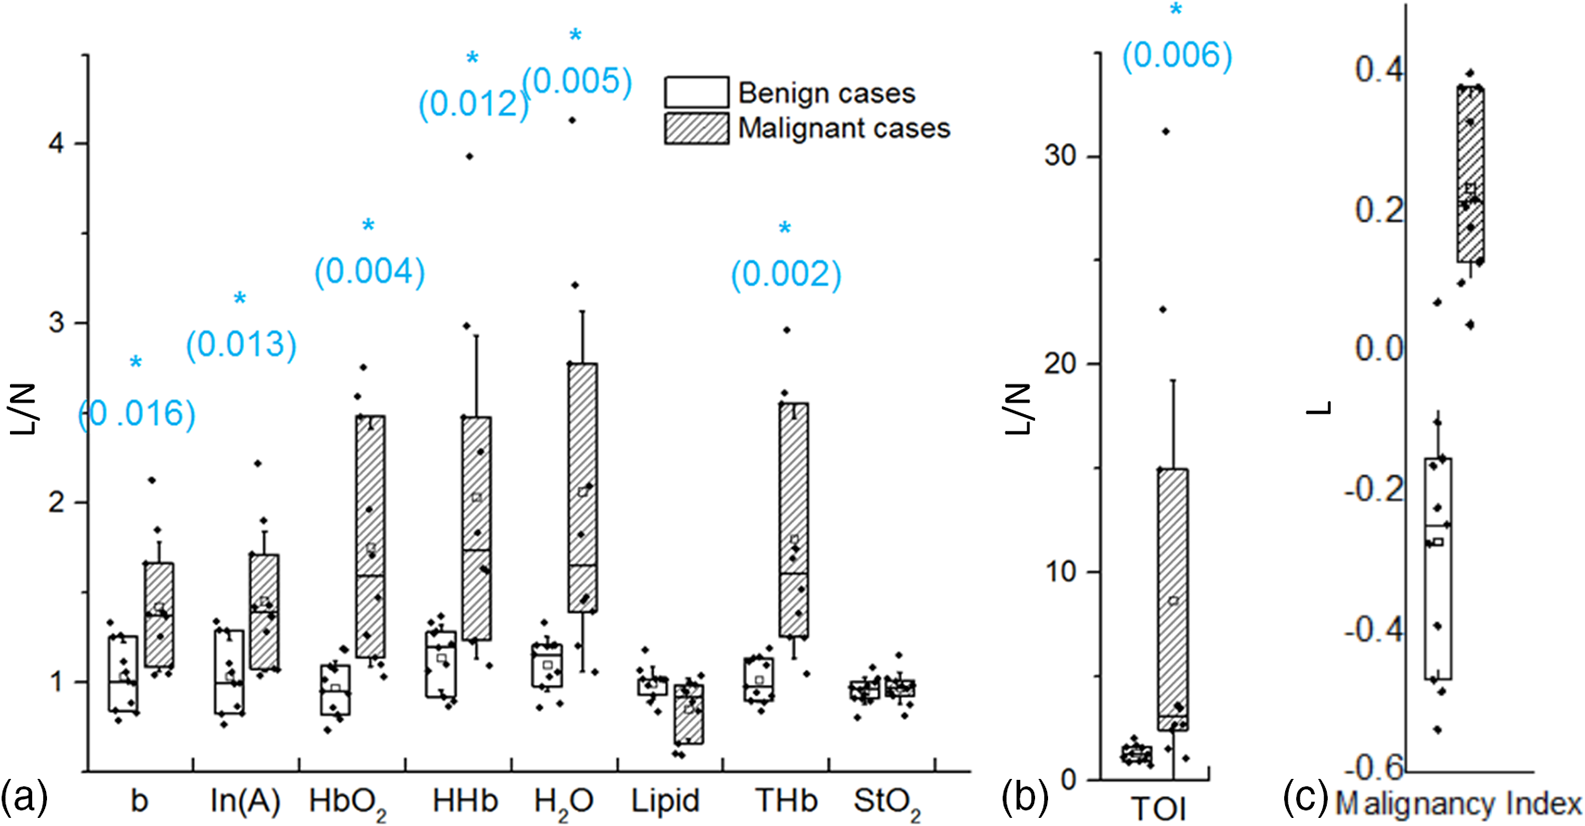 Table 3Mean, SD, and range of the L/N optical parameters in the malignancy and benign groups.
Note: L/N indicates the lesion to normal ratio.p-value of statistical difference between the two groups: 1 indicates a Wilcoxon Rank Sums Test for the nonnormally distributed variables; 2 indicates a two-sample t-test for the normally distributed variables. Table 4Mean, SD, and range of the optical parameters in the malignancy and benign lesions.
3.4.Performance of DOSI for Differential DiagnosisTables 5 and 6 summarize the power, assessed by area under the ROC curve (AUC), of L/N to predict a malignant lesion from a cohort of malignant and benign lesions in all DOSI parameters. The total hemoglobin and the malignancy index were the two best unique predictors among the DOSI parameters with an AUC of 0.96 (95% CI 0.86 to 1.00) and 0.99 (95% CI 0.97 to 1.00), respectively. At the specific threshold specified in Table 6, this resulted in accuracy, sensitivity, specificity, PPV, and NPV of more than 90% for both the malignancy index and . Overall, all DOSI parameters except exhibited statistically significant prediction of malignancy, with . Table 5Performance of the DOSI parameters for differential diagnosis: AUC and 95% confidence interval for all DOSI parameters.
Note: L/N indicates the lesion to normal ratio.p-value of the likelihood ratio test. Table 6Performance of the DOSI parameters for differential diagnosis (follow-up of Table 4): accuracy, sensitivity, specificity, PPV, and NPV at the specified threshold for all DOSI parameters.
Note: L/N indicates the lesion to normal ratio. 3.5.Influence of Discrepant Averaged Lesion Size Between the Two Groups on the Differential Diagnosis Power of DOSIAs shown in Table 2, the average size of malignant lesions was much larger than that of the benign lesions (2.6 versus 1.7 cm, respectively). Furthermore, while all malignant lesions were palpable, only 5 out of 11 benign lesions were also palpable. In order to assess the impact of the difference in the average lesion size between the two groups to the analysis, we evaluated the power of DOSI to differentiate benign from malignant lesions in a subset of lesions with similar size and depth. As depicted in Fig. 5, 12 patients (6 benign and 6 malignant) were selected based on their similar tumor size and depth. The resulting average (SD, range) lesion sizes were 1.8 cm (0.6 cm, 1.2 to 2.8 cm) and 2.3 cm (0.5 cm, 1.5 to 2.8 cm) for the malignant and benign lesions, respectively. Out of the six benign lesions, five were palpable. Lesions from both groups were located at similar depths (SD, range) into the breast tissue: 0.7 cm (0.3 cm, 0.2 to 1 cm) and 0.6 cm (0.3 cm, 0.3 to 0.9 cm) for the malignant and benign lesions, respectively. Fig. 5Subsets of patients used in testing the impact of the average lesion size on the different diagnosis power of DOSI.  In this subset of data, we observed again greater lesion to normal values in the malignant group compared to the benign group for all DOSI parameters except for the lipid and oxygen saturation (data not shown). These differences were found to be statistically significant in THb, , TOI, and malignancy index (), and to be near-significant in ctHHb and (). The performance of DOSI for differential diagnosis in this subset of patients is presented in Table 7. Comparable with the findings using the whole dataset, the malignancy index and total hemoglobin were the best unique predictor of malignancy, with AUCs of 1.00 (95% CI 1.00 to 1.00) and 0.94 (95% CI 0.82 to 1.00), respectively. Table 7Performance of the DOSI parameters for differential diagnosis in the subset of patients: AUC, 95% confidence interval, and p-value for all DOSI parameters. 4.DiscussionIn this study, we identified and characterized differences in functional optical characteristics of 11 benign and 10 malignant lesions in the premenopausal South Korean population. Lesion to normal ratios of , ctHHb, , total hemoglobin, tissue optical index, and tissue scattering parameters were significantly increased in malignant lesions compared to benign lesions. In terms of breast composition, total hemoglobin was the DOSI parameter that best predicted malignancy in the cohort of benign and malignant lesions, with an AUC of 0.96 (95% CI 0.86 to 1.00). The malignancy index, which is the result of a classification tool trained to separate STC spectral signatures of benign and malignant lesions at specific absorption bands, exhibited greater performance for differential diagnosis; it had an AUC of 0.99 (95% CI 0.97 to 1.00). These results were then controlled for the lesion size by reproducing the analysis in a subset of lesions with comparable size. Significantly higher water, hemoglobin, and scattering parameters were measured using DOSI in malignant lesions compared to benign lesions. Malignant lesions contain elevated levels of blood and water due to increased perfusion, metabolism, and cellularity. Benign lesions, which have weaker proliferative and metabolic states than malignant lesions, are expected to have lower blood and water content. Scattering power (b) and amplitude (A), which are partly related to the size and density of intracellular structures (e.g., nuclei and mitochondria), are expected to be higher in malignant lesions due to the high cellular proliferation, which results in an increase in organelle population.21 The structural changes of the extracellular matrix during tumor progression are also expected to impact the scattering parameters. The microenvironment is reorganized by increased deposition and remodeling of extracellular matrix components (fibronectin, proteoglycans, and collagens),22,23 which should result in greater scattering power and amplitude at the tumor site. Similar results have been previously observed by other groups using different diffuse optical imaging technologies in the overall population including pre- and postmenopausal women. Zhu et al.24 measured the total hemoglobin concentration of 73 benign and 8 malignant lesions using a combined US and optical imaging system. Using a certain threshold level of total hemoglobin in the lesion, they were able to discriminate benign from malignant lesions with 100% sensitivity, 96% specificity, 73% PPV, and 100% NPV. Choe et al. investigated the optical contrast of 41 malignant and 10 benign lesions using a parallel plate frequency-domain diffuse optical tomography system. They found that tumor to normal reduced scattering and total hemoglobin were optimum optical parameters to discriminate between benign and malignant lesions, with an AUC of 0.99 and 0.98, respectively.25 Kukreti et al.12 used DOSI to characterize the STC spectra of 22 malignant and 18 benign masses. Using the malignancy index, they classified the 40 lesions into benign and malignant groups with only one false-positive and two false-negative classified lesions. Quarto et al.26 used a parallel plate time domain diffuse optical tomography system to image 33 malignant and 29 benign lesions. They reported significantly higher oxyhemoglobin and collagen content in malignant masses compared to benign masses. Contrary to our findings, they did not report any statistical difference in deoxyhemoglobin, water, and lipid concentrations. This could be due to the difference in studied population. These published studies, which included subjects independent of their breast density and age, did not account for these parameters. The novelty of this work is its focus on premenopausal dense breast and the South Korean population. One of the major limitations of all breast imaging techniques, including optical methods, is the low intrinsic contrast between lesions and normal dense breast tissue. Dense breast tissue has high vascular and water content, and is metabolically active. As a result, it exhibits similar DOSI enhancement as that of malignant lesions. This work, which focuses on premenopausal South Korean females, is particularily affected by this issue. Breast density has been shown to be relatively high in South Korea: using automated volumetric assessment, Youn et al.6 reported that over 90% of South Korean females under 50 exhibited dense breasts. Despite this biological limitation, lesion to normal total hemoglobin, oxy-hemoglobin, water, and TOI obtained using DOSI showed high power for predicting malignancy in this cohort (AUC of 0.96, 0.93, 0.92, and 0.90, respectively). This work employs a DOSI method that has substantial quantiative broadband spectral content (650 to 1050 nm) compared to other approaches. This potentially provides deeper insight into the biological properties of tissue versus methods that employ a few wavelenghts for chromophore analysis.10,27 Broadband DOSI has been shown to be sensitive to an endogeneous spectral signature (STC) that correlates with the level of malignancy that is absent in normal tissue.11,12 These STC signatures, depicted in Fig. 3, are hypothesized to originate from changes in molecular disposition measured as spectral shifts in water and lipid peaks, and from contributions of minor absorbers (such as met-hemoglobin, carboxy-hemoglobin, and collagen).10 The spectral features observed in benign and malignant STC spectra were statistically combined into a malignancy index. The malignancy index showed the best predictive power, with an AUC of 0.99 (95% CI 0.97 to 1.00). These results suggest that absorber concentrations, scattering parameters, and spectral absorption features contain valuable information for differential diagnosis. One of the limitations of this work is the difference in lesion size between the malignant and benign groups. The malignant lesions were on average larger than the benign lesions; 2.6 and 1.7 cm, respectively. Due to the partial volume effect, a larger lesion size may result in greater lesion to normal contrast than a smaller lesion. Furthermore, at similar depths, a larger lesion is more likely to be probed by the diffuse light field compared to a smaller lesion. To evaluate this effect, a subset of 12 lesions (6 benign, 6 malignant) with similar sizes and depths were selected from the cohort and analyzed separately. As was the case for the complete dataset, all DOSI parameters except lipid and saturation were found to be higher in the malignant group than in the benign group. These differences were statistically significant in L/N THb, water, and malignancy index, and nearly significant in deoxyhemoglobin and oxyhemoglobin concentrations. In the analysis of the entire population, statistical significance was also achieved for L/N contrast in deoxyhemoglobin, oxyhemoglobin, scatering power, and scattering amplitude. The loss in statistical differentiation is likely due to the smaller subgroup dataset. L/N THb and the malignancy index were found to be the best single predictors of malignancy, with AUCs of 0.94 (95% CI 0.82 to 1.00) and 1.00, respectively, in this subset. The findings were comparable between the subset with controlled lesion size and the complete population dataset. Another limiting factor of this study is the difference in subject age between the malignant and benign groups. Subjects with a malignant lesion were more likely to be older than subjects with a benign lesion. While there is no statistical evidence, age has been reported to be slightly correlated with decreased breast absorption.19 While this effect is more likely to occur at menopause, during which a loss of connective tissue and remodeling of breast parenchyma occur, we cannot eliminate the possibility that this could influence our results. This effect would result in greater intrinsic lesion contrast in older subjects (mostly in the malignant group) compared to younger subjects (mostly in the benign group). As more subjects are being recruited for this study, we hope that we can achieve a more homogeneous distribution of subject age and lesion size. A biological limitation of this work includes the limited range of benign breast pathologies. Some benign lesion types, such as benign papillary lesions, may present high levels of vascularization, which can be confounded with vascularity of malignant lesions.28 For these cases, total hemoglobin may fail to identify benign lesions and/or to distinguish them from malignant lesions. It would be of interest to investigate the discriminative power of DOSI spectral features assessed by the malignancy index in these highly vascularized benign lesions. In summary, quantitiative, broadband DOSI was used to characterize the composition of 21 benign and malignant lesions in dense breasts of premenopausal South Korean women. The rich spectral content of the technique was used to develop several optical imaging endopoints that provide sufficient contrast for distinguishing between malignant and benign lesions with high accuracy, sensitivity, and specificity. Our results suggest that DOSI is a promising approach for noninvasive differential diagnosis in women with dense breast tissue, and has potential to improve the performance of standard-of-care methods. Further studies should include additional lesion types as well as continued emphasis on matching patient characteristics such as age, lesion size, and depth in order to more fully understand the origins of contrast in benign and malignant breast tumors. AcknowledgmentsThis research was supported by the Leading Foreign Research Institute Recruitment Program through the National Research Foundation of Korea (NRF) funded by the Ministry of Science, ICT and Future Planning (MSIP) (2012K1A4A3053142), the National Institute of Biomedical Imaging and Bioengineering (P41EB015890), the National Cancer Institute (R01CA142989, U54CA136400), the Chao Family Comprehensive Cancer Center (P30CA62203), and programmatic support from the Arnold and Mabel Beckman Foundation. B. J. Tromberg report patents, which are owned by the University of California, that are related to the technology and analysis methods described in this study. The University of California has licensed DOSI technology and analysis methods to LG, Inc. This research was completed without LG, Inc. participation, knowledge, or financial support and data were acquired and processed from patients by coauthors unaffiliated with this entity. The Institutional Review Board and Conflict of Interest Office of the University of California, Irvine, have reviewed both patent and corporate disclosures and did not find any concerns. No potential conflicts of interest were disclosed by the other authors. ReferencesY. S. Jung et al.,
“Nation-wide Korean breast cancer data from 2008 using the breast cancer registration program,”
J. Breast Cancer, 14
(3), 229
–236
(2011). http://dx.doi.org/10.4048/jbc.2011.14.3.229 Google Scholar
J.-H. Lee et al.,
“Population-based breast cancer statistics in Korea during 1993–2002: incidence, mortality, and survival,”
J. Korean Med. Sci., 22
(Suppl), S11
–S16
(2007). http://dx.doi.org/10.3346/jkms.2007.22.S.S11 Google Scholar
K.-W. Jung et al.,
“Cancer Statistics in Korea: incidence, mortality, survival, and prevalence in 2012,”
Cancer. Res. Treat, 47
(2), 127
–141
(2015). http://dx.doi.org/10.4143/crt.2015.060 Google Scholar
J. H. Youk and E.-K. Kim,
“Supplementary screening sonography in mammographically dense breast: pros and cons,”
Korean J. Radiol., 11
(6), 589
–593
(2010). http://dx.doi.org/10.3348/kjr.2010.11.6.589 Google Scholar
N. S. Winkler et al.,
“Breast density: clinical implications and assessment methods,”
RadioGraphics, 35
(2), 316
–324
(2015). http://dx.doi.org/10.1148/rg.352140134 Google Scholar
I. Youn et al.,
“Mammographic breast density evaluation in Korean women using fully automated volumetric assessment,”
J. Korean Med. Sci., 31
(3), 457
–462
(2016). http://dx.doi.org/10.3346/jkms.2016.31.3.457 JKMSEH Google Scholar
W. A. Berg et al.,
“Combined screening with ultrasound and mammography compared to mammography alone in women at elevated risk of breast cancer: results of the first-year screen in ACRIN 6666,”
JAMA, J. Am. Med. Assoc., 299
(18), 2151
–2163
(2008). http://dx.doi.org/10.1001/jama.299.18.2151 Google Scholar
T. M. Kolb, J. Lichy and J.H. Newhouse,
“Comparison of the performance of screening mammography, physical examination, and breast US and evaluation of factors that influence them: an analysis of 27, 825 patient evaluations,”
Radiology, 225
(1), 165
–175
(2002). http://dx.doi.org/10.1148/radiol.2251011667 RADLAX 0033-8419 Google Scholar
A. Cerussi et al.,
“In vivo absorption, scattering, and physiologic properties of 58 malignant breast tumors determined by broadband diffuse optical spectroscopy,”
J. Biomed. Opt., 11
(4), 044005
(2006). http://dx.doi.org/10.1117/1.2337546 JBOPFO 1083-3668 Google Scholar
S. Kukreti et al.,
“Intrinsic tumor biomarkers revealed by novel double-differential spectroscopic analysis of near-infrared spectra,”
J. Biomed. Opt., 12
(2), 020509
(2007). http://dx.doi.org/10.1117/1.2709701 JBOPFO 1083-3668 Google Scholar
A. Leproux et al.,
“Assessing tumor contrast in radiographically dense breast tissue using diffuse optical spectroscopic imaging (DOSI),”
Breast Cancer Res., 15
(5), R89
(2013). http://dx.doi.org/10.1186/bcr3485 BCTRD6 Google Scholar
S. Kukreti et al.,
“Characterization of metabolic differences between benign and malignant tumors: high-spectral-resolution diffuse optical spectroscopy,”
Radiology, 254
(1), 277
–284
(2010). http://dx.doi.org/10.1148/radiol.09082134 RADLAX 0033-8419 Google Scholar
“Breast imaging reporting and data system (BI-RADS),”
Breast Imaging Atlas, American College of Radiology, Reston, Virginia
(2003). Google Scholar
T. B. Bevers et al.,
“Breast cancer screening and diagnosis,”
J. Natl. Compr. Cancer Network, 7
(10), 1060
–1096
(2009). Google Scholar
F. Bevilacqua et al.,
“Broadband absorption spectroscopy in turbid media by combined frequency-domain and steady-state methods,”
Appl. Opt., 39 6498
–6507
(2000). http://dx.doi.org/10.1364/AO.39.006498 Google Scholar
T. D. O’sullivan et al.,
“Diffuse optical imaging using spatially and temporally modulated light,”
J. Biomed. Opt., 17
(7), 0713111
(2012). http://dx.doi.org/10.1117/1.JBO.17.7.071311 JBOPFO 1083-3668 Google Scholar
A. E. Cerussi et al.,
“Diffuse optical spectroscopic imaging correlates with final pathological response in breast cancer neoadjuvant chemotherapy,”
Philos. Trans. R. Soc., A: Math., Phys. Eng. Sci., 369
(1955), 4512
–4530
(2011). http://dx.doi.org/10.1098/rsta.2011.0279 Google Scholar
A. Cerussi et al.,
“Spectroscopy enhances the information content of optical mammography,”
J. Biomed. Opt., 7 60
–71
(2002). http://dx.doi.org/10.1117/1.1427050 Google Scholar
T. Durduran et al.,
“Bulk optical properties of healthy female breast tissue,”
Phys. Med. Biol., 47
(16), 2847
–2861
(2002). http://dx.doi.org/10.1088/0031-9155/47/16/302 PHMBA7 0031-9155 Google Scholar
L. Spinelli et al.,
“Bulk optical properties and tissue components in the female breast from multiwavelength time-resolved optical mammography,”
J. Biomed. Opt., 9
(6), 1137
–1142
(2004). http://dx.doi.org/10.1117/1.1803546 JBOPFO 1083-3668 Google Scholar
J. R. Mourant et al.,
“Mechanisms of light scattering from biological cells relevant to noninvasive optical-tissue diagnostics,”
Appl. Opt., 37
(16), 3586
–3593
(1998). http://dx.doi.org/10.1364/AO.37.003586 APOPAI 0003-6935 Google Scholar
M. Fang et al.,
“Collagen as a double-edged sword in tumor progression,”
Tumor Biol., 35
(4), 2871
–2882
(2014). http://dx.doi.org/10.1007/s13277-013-1511-7 TUMBEA Google Scholar
M. E. Maragoudakis et al.,
“Basement membrane biosynthesis as a target for developing inhibitors of angiogenesis with anti-tumor properties,”
Kidney Int., 43
(1), 147
–150
(1993). http://dx.doi.org/10.1038/ki.1993.24 KDYIA5 0085-2538 Google Scholar
Q. Zhu et al.,
“Benign versus malignant breast masses: optical differentiation with US-guided optical imaging reconstruction,”
Radiology, 237
(1), 57
–66
(2005). http://dx.doi.org/10.1148/radiol.2371041236 RADLAX 0033-8419 Google Scholar
R. Choe et al.,
“Differentiation of benign and malignant breast tumors by in-vivo three-dimensional parallel-plate diffuse optical tomography,”
J. Biomed. Opt., 14 024020
(2009). http://dx.doi.org/10.1117/1.3103325 JBOPFO 1083-3668 Google Scholar
G. Quarto et al.,
“Estimate of tissue composition in malignant and benign breast lesions by time-domain optical mammography,”
Biomed. Opt. Express, 5
(10), 3684
–3698
(2014). http://dx.doi.org/10.1364/BOE.5.003684 BOEICL 2156-7085 Google Scholar
S. H. Chung et al.,
“In vivo water state measurements in breast cancer using broadband diffuse optical spectroscopy,”
Phys. Med. Biol., 53
(23), 6713
–6727
(2008). http://dx.doi.org/10.1088/0031-9155/53/23/005 PHMBA7 0031-9155 Google Scholar
N. Masciadri and C. Ferranti,
“Benign breast lesions: ultrasound,”
J. Ultrasound, 14
(2), 55
–65
(2011). http://dx.doi.org/10.1016/j.jus.2011.03.002 JUMEDA 0278-4297 Google Scholar
BiographyAnaïs Leproux received her PhD in biomedical engineering in 2012 at the University of Amsterdam, the Netherlands. She has been working as a research scientist at the Beckman Laser Institute (BLI) since then. Her BLI research in biomedical photonics is focused on using diffuse optical spectroscopic imaging (DOSI) technology in breast cancer applications, mainly for the detection and characterization of breast tumor response to therapy. You Me Kim is an associate professor at Dankook Univeristy School of Medicine, Cheonan, South of Korea. She received her PhD in medicine in 2009 at Cheonbuk National University. She is the director of genitourinary and breast imaging, Department of Radiology, at the Dankook Univerisity Hospital. She has been working as an editorial board in the Journal of the Korean Society of Radiology. She has focused on breast imaging research, including national breast cancer screening. Jun Won Min received his BS degree in medicine from Dankook University, the South Korea in 2001 and received a MS and PhD in surgical oncology from Dankook University, the South Korea in 2005 and in 2014. Since 2012, he has been working as a assistant professor at the Dankook University. Christine E. McLaren is professor and vice chair, Department of Epidemiology, University of California, Irvine. She is coprogram leader for the Program in Cancer Prevention and Prognosis, Chao Family Comprehensive Cancer Center. She has focused on statistical modeling research, including modeling of longitudinal data and applications to cancer data. As a result, she was elected a fellow of the American Statistical Association, in part for “innovative research in biology and medicine. Wen-Pin Chen received a Master degree from the University of California, Los Angeles. Currently, she is a statistician at biostatics shared resources (BSR), Chao Family Comprehensive Cancer Center. Under supervision of BSR faculty, she has been working on various cancer related projects for 11 years. Thomas D. O'Sullivan is director of the Diffuse Optical Spectroscopy & Imaging Laboratory (DOSI) at the Beckman Laser Institute at the University of California Irvine and US Department of Defense Breast Cancer Research Program Postdoctoral Fellow. He received his BS in electrical engineering from Northwestern University in 2005, and received his MS degree and PhD in electrical engineering from Stanford University in 2007 and 2010, respectively. Seung-ha Lee is a professor in Department of Biomedical Engineering, College of Medicine, Dankook University, Korea. He received his PhD in electrical engineering from Korea Advanced Institute of Science and Technology in 1995. He majored in control system engineering and his research focuses on hardware and software design in medical systems. Phil-Sang Chung is professor of Department of Otolaryngology-Head and Neck Surgery, Dankook University Hospital and director of Beckman Laser Institute Korea. He was chairman of the board member, Korean Society for Laser Medicine and Surgery during 2013 to 2015. He is the president elect, Korean Society of Thyroid-Head and Neck Surgery. He graduated Seoul National University College of Medicine in 1985 and got PhD in medical science from Seoul National University in 1997. Bruce J. Tromberg is a professor of biomedical engineering and surgery at the University of California, Irvine (UCI) and director of UCI's Beckman Laser Institute and Medical Clinic. He has more than 25 years of experience in the development of optics and photonics technologies and their application to biology and medicine. His research interests are in the development of quantitative, broadband biophotonics technologies for characterizing and imaging tissue structure, function and composition across spatial scales. |
|||||||||||||||||||||||||||||||||||||||||||||||||||||||||||||||||||||||||||||||||||||||||||||||||||||||||||||||||||||||||||||||||||||||||||||||||||||||||||||||||||||||||||||||||||||||||||||||||||||||||||||||||||||||||||||||||||||||||||||||||||||||||||||||||||||||||||||||||||||||||||||||||||||||||||||||||||||||||||||||||||||||||||||||||||||||||||||||||||||||||||||||||||||||||||||||||||||||||||||||||||||||||||||||


