
|
|
1.IntroductionThe burden of esophageal adenocarcinoma (EAC) has increased at an alarming rate in western countries, due to a combination of rising incidence and poor outcomes.1–5 Since Barrett’s esophagus (BE) is the major risk factor for EAC, patients with BE are usually recommended to undergo surveillance endoscopy at regular intervals.6 However, dysplasia in BE can often be missed with standard white light imaging (WLI),7 and there is a critical need for new endoscopic techniques to improve the accuracy of early detection of EAC and its precursors. A variety of imaging modalities have been developed to probe different aspects of cancer progression in BE. For example, narrow-band imaging targets endogenous hemoglobin absorption to highlight the vascular network and autofluorescence imaging excites endogenous fluorophores to detect BE-associated malignancies.8–12 The use of exogenous dyes, such as in Lugol’s chromoendoscopy or fluorescein targeted confocal laser endomicroscopy, can further enhance the contrast between neoplastic tissue and surrounding normal mucosa.13–15 Other sources of contrast include changes in subsurface scattering measured via optical coherence tomography.16,17 Recently, we developed vital-dye fluorescence imaging (VFI), a modality that highlights nuclear morphology and enhances glandular patterns by staining the epithelial nuclei to potentially red-flag abnormal lesions and bridge widefield imaging with high-resolution imaging.18 While images obtained with the initial prototype VFI system improved the ability to monitor changes in glandular morphology, the first-generation (G1) system used an external cap for the VFI imaging, which necessitated removal of the endoscope, placement of a cap, and reinsertion for the transition from WLI to VFI. Moreover, the multiple insertions made it difficult to correlate regions imaged in the two modalities. To overcome these barriers, here we describe a second-generation modular video endoscope (G2 MVE) that incorporates WLI and VFI in a single-endoscopic insertion. Both WLI and VFI are enabled with a removable cap module and the endoscopist can seamlessly switch between the two modalities throughout the procedure. The removable cap design can readily expand the imaging capability of different existing endoscopes to include fluorescence imaging by installing a laser diode and attaching the cap. A contrast enhancement algorithm is also integrated in real time in VFI mode to further improve visualization of metaplastic glands associated with BE. Images illustrating progression from metaplasia to dysplasia and cancer are acquired during in vivo esophageal endoscopy in both modalities. 2.Materials and Methods2.1.InstrumentationThe G1 of the MVE consisted of a modified commercial Pentax endoscopy system (Pentax EPK-i processor, EG-2990i endoscope) and an interchangeable module to achieve VFI.18 The VFI module of the MVE system was designed for use with proflavine, a topically applied vital dye. The aminoacridine-derived dye preferentially stains DNA in cell nuclei, providing strong contrast between cell nuclei and surrounding cytoplasm.19–21 With a small size, the amphipathic molecule can easily cross cell membranes and thus permits rapid topical application.22 Proflavine has been used in the triple dye as an antibacterial agent on the newborn’s umbilical cord.23 Several in vivo studies also reported that the dye can be safely delivered to image epithelium in the gastrointestinal tract, oral cavity, and cervix without adverse effects.24–26 As shown in Fig. 1, proflavine has absorption and emission maxima at and 515 nm, respectively.27 To image proflavine fluorescence using the G1 MVE, a 455-nm laser diode was installed, replacing the auxiliary white light LED in the EPK-i processor and the VFI module included a 500-nm long-pass filter (LPF) that was placed in front of the CCD camera for fluorescence imaging. Because the 500-nm LPF in the VFI module blocks blue light from reaching the CCD camera, the VFI module must be removed for WLI. Thus, the G1 MVE required two separate scope insertions for WLI and VFI. Fig. 1Overview of G2 MVE. (a) A custom-coated 435-nm LPF placed in front of the endoscope CCD. (b) The LPF is installed in the steel housing and secured by a Halo cap. (c) In the G2 MVE, the excitation wavelength is shifted from 455 to 405 nm. A 435-nm LPF is used in VFI mode as the emission filter, as well as in conventional WLI with white balance.  In the G2 MVE, a 405-nm laser diode (Nichia Corporation, Tokyo, Japan) was installed to provide illumination in VFI mode. As in the G1 system, the diode replaced the auxiliary white light LED in the EPK-i and was powered by a laser driver (Wavelength Electronics, Bozeman, Montana). Since the diode has an optical output of (to our knowledge, it is the most powerful 405-nm diode laser at the time of system development), a customized aluminum heatsink was installed and air-cooled. Through mechanical control, the illumination source could be switched between a Xenon lamp for WLI and the laser diode for VFI. Although the absorption of proflavine is reduced at 405 nm, shifting the illumination to 405 nm allowed for the installation of a 435-nm LPF (Schott North America, Duryea, Pennsylvania) in place of the original 500-nm LPF, permitting more blue light to reach the CCD and allowing WLI without removal of the VFI module. As in the G1 MVE, the filter was installed in a customized stainless steel cap and secured to the distal endoscope tip by a commercially available halo cap (Covidien, Sunnyvale, California), as shown in Figs. 1(a) and 1(b). The LPF combined a colored absorption glass (GG435, thick) with a custom coating to accommodate angular fields of view (FOVs) up to . At a typical working distance of 5 to 10 mm, the FOV ranges from 15 to 25 mm. The laser diode excitation and the emission filter spectra of the G1 and G2 systems are measured using an Ocean USB2000 spectrometer (Ocean Optics, Dunedin, Florida) and a Cary 5000 spectrophotometer (Agilent Technologies, Santa Clara, California), respectively, and shown in Fig. 1(c). A detailed comparison of the two systems, including the excitation source, emission filter, light guide transmission, and proflavine absorption, is shown in Table 1. Table 1Comparison of G1 and G2 VFI system.
2.1.1.White balance in WLIThe 435-nm LPF in the VFI module of the G2 MVE still blocks blue light below 435 nm from reaching the CCD camera during WLI. To compensate for the light loss in the blue spectral range during WLI, white balance was performed in white light images with the EPK-i processor using color balance options provided on the front panel for the red and blue components of the RGB image. For each component, 11 adjustment levels were available ranging from to and could be adjusted in real time. The optimal white balance levels were determined by imaging a white balance target (X-Rite, Grand Rapids, Michigan) with the LPF removed and with the LPF in place. The color difference between each image with the LP filter in or out of the optical path was calculated based on the CIEDE2000 formula,28 and the color balance levels yielding the minimum color difference were determined as the optimal white balance setting. To assess the performance of white balance, ex vivo white light images of a mouse stomach were acquired with and without the LPF in place; probability mass functions (PMF) of the original WLI image were compared to these of the color-balanced image obtained with the LPF in place. 2.1.2.Contrast enhancement in VFIA contrast enhancement feature was implemented via Labview (Labview 2012, National Instruments) in VFI mode to highlight glandular patterns in BE, the distortion and effacement of which have been shown to be associated with cancer progression.18 This feature utilized an unsharp filter to enhance edges in the image. During unsharp masking, the original image was first smoothed by an average filter . An unsharp mask was then obtained by subtracting the blurred image from the original; the resulting weighted mask was added to the original image to produce a sharpened image. The process is summarized in the following equation: with , , and denoting the original, smoothed, and enhanced images, respectively. In Labview, the smoothing filter used to blur the original VFI image isThe level of enhancement was tuned by adjusting the constant . In this study, an unsharp mask with was used. The enhanced VFI mode was initially tested with in vivo VFI images. As indicated in Eq. (1), the intensities of the unsharp mask are proportional to the difference between the original and enhanced images. The variances of the unsharp mask pixel intensities in two regions of interest (ROIs), as defined in squamous and columnar epithelium, respectively, were compared to verify more significant enhancement of glandular patterns in metaplastic areas. The algorithm was then implemented in real time and contrast-enhanced videos were displayed during endoscopy without compromising the frame rate. 2.1.3.System performanceTwo sources of background were potentially present in the imaging system—leakage of excitation light and autofluorescence of optical components when illuminated by a 405-nm laser. To verify that any background signal was minimal compared to proflavine fluorescence in VFI mode, nonfluorescent frosted quartz was used as a negative control to approximate the amount of excitation light that would typically be backscattered into the collection optics, resulting in system autofluorescence. During ex vivo imaging, proflavine stained columnar epithelium of an excised mouse stomach was first imaged in VFI mode to obtain the fluorescence signal; the background signal was then measured by imaging the frosted quartz at the same working distance and compared to proflavine fluorescence. The signal to background ratio was above 10, indicating minimal excitation leakage in fluorescence images. 2.2.Pilot StudyAn in vivo pilot study using the G2 MVE was conducted in a high-risk population of subjects with BE at Mount Sinai Medical Center. Patients who had histologically confirmed Barrett’s metaplasia, dysplasia, or EAC and were scheduled for routine surveillance or endoscopic treatment were eligible for enrollment. The study information was provided to eligible patients and written informed consent was obtained. This pilot study was IRB-approved at both Mount Sinai Medical Center and Rice University. 2.2.1.Imaging procedureThe G2 MVE was used to examine the esophagus. Compared with the G1 MVE, which requires two separate insertions, G2 MVE allows for a more convenient imaging protocol (Fig. 2). Prior to imaging, 10 ml of 0.01% proflavine solution is prepared by a pharmacist using proflavine hemisulfate salt hydrate powder (purity by titration , Sigma-Aldrich, St. Louis, Missouri). The VFI module was attached before endoscopic insertion and white balance was set. Conventional WLI was performed followed by topical application of proflavine (5 to 10 ml, 0.01%) through a spray catheter (Olympus America, Center Valley, Pennsylvania), which was inserted through the biopsy channel of the endoscope. Following proflavine application, the esophagus was rinsed with water, and VFI images were then obtained with contrast enhancement. The entire imaging procedure was performed by a single expert endoscopist (SA). Fig. 2Comparison of imaging protocols in G1 and G2 MVE. In the G1 flowchart, the VFI module is attached between the first- and second-scope insertion. On the bottom panel, in the G2 MVE, both WLI and VFI images are acquired in a single scope insertion. 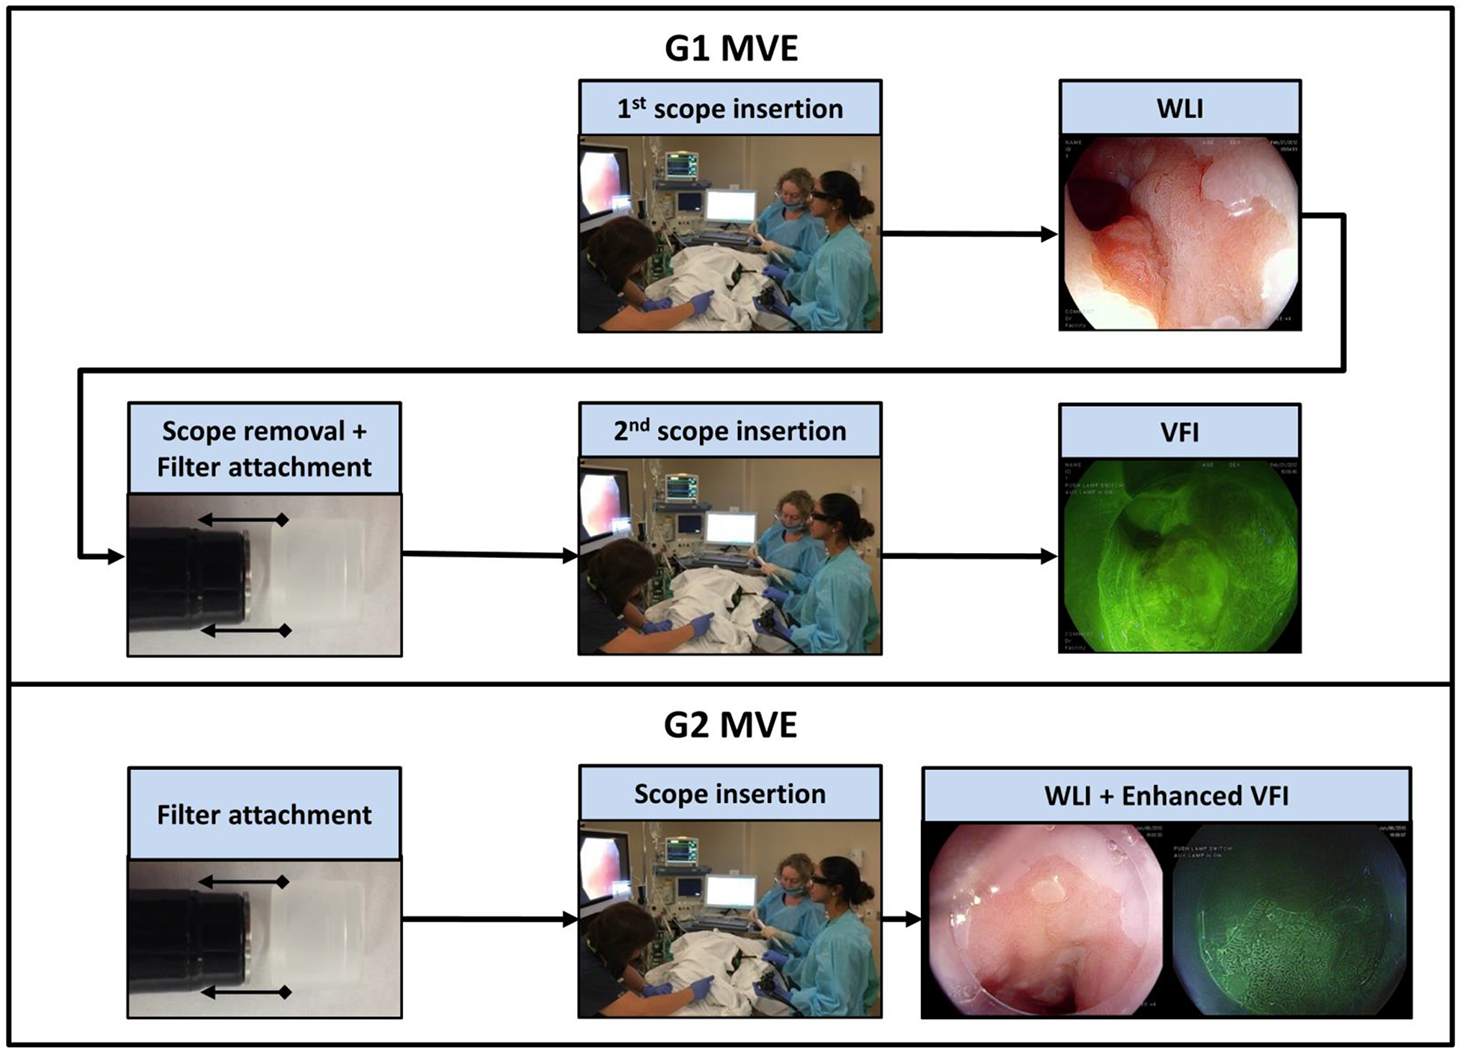 Previously developed imaging criteria were used during the endoscopy to identify abnormalities through the BE segment.18,21 Sites were considered suspicious in VFI mode if they revealed disrupted or effaced glandular architecture. Notes on location information of each imaged site were taken: endoscope depth and quadrant, time stamps, and clinical landmarks (such as islands, ulceration, or bleeding). Suspicious regions in either WLI or VFI were biopsied postimaging; standard four-quadrant biopsies were acquired every 1 to 2 cm in the BE segment together with controls from nonsuspicious metaplastic areas. All biopsies were examined by a single pathologist (AP). Images were extracted from videos in each modality and correlated for each imaged site. Extracted frames for each site were reviewed (YT, JC, SA, RRK) and compared to the histopathology results. 2.2.2.Contrast quantification and evaluationThe contrast of representative images obtained in the pilot study was quantified. Lab variance, defined as the geometrical mean of the variance in each channel of the CIELAB colorspace, has been shown to correlate well with perceived contrast of color images showing different content.29 This metric was calculated to assess and compare the contrast of WLI and VFI images. In each image, three ROIs () showing representative features were selected; the Lab variance of selected ROIs was calculated and averaged to evaluate image contrast. The mean Lab variance in each VFI image was compared to that in the corresponding WLI image for different diagnostic categories. The quantitative results were also compared with the qualitative findings in these images. 3.Results3.1.System Performance3.1.1.White balance in WLIThe optimal white balance levels in the G2 MVE were determined by comparing images of a white balance target with and without the G2 VFI module in place. The CIE2000 color differences between the original WLI image (with the G2 VFI module removed) and images at available color balance levels (Blue to , Red to ) with the G2 VFI module in place were calculated. The color balance levels yielding the minimum color difference were Blue and Red , which were used as the optimal white balance setting for the G2 MVE during WLI. Similarly, for the G1 VFI module, the optimal white balance levels available were Blue and Red ; however, the color difference at the optimal white balance levels in the G2 MVE was decreased by approximately one order of magnitude compared to the G1 MVE. Ex vivo WLI images of an excised mouse stomach were obtained to verify the white balance performance. The stomach was imaged with and without the G1 or G2 VFI modules in place as shown in Figs. 3(a), 3(b), and 3(d). Corrected images were acquired with the VFI modules at the corresponding optimal white balance levels (i.e., Blue , Red for G1, and Blue , Red for G2). The available white balance levels failed to restore the original color in the G1 corrected image as shown in Fig. 3(c). In contrast, the G2 uncorrected image in Fig. 3(d) appeared significantly less yellow as compared to the G1 uncorrected image; the color was further corrected using the optimal white balance levels, as shown in Fig. 3(e). The PMF of the blue channel in the same ROI [black box in Fig. 3(a)], as shown in Fig. 3(F), reveals nearly total elimination of blue light by the G1 VFI module, and only partial loss with the G2 VFI module, allowing for appropriate compensation using the optimal white balance levels. Fig. 3Verification of white balance in the G2 MVE. Ex vivo images of a mouse stomach (a) without the VFI module or color balance (original), (b) with the G1 VFI module but no color balance (G1 uncorrected), (c) with the G1 VFI module and color balance (G1 corrected), (d) with the G2 VFI module but no color balance (G2 uncorrected), (e) with the G2 VFI module and color balance (G2 corrected). The PMF of the selected ROI [box in (a)] for each image is compared. The available color correction failed to restore the original color due to the almost complete elimination of blue light by the G1 emission filter, while the PMF of the G2 corrected image is similar to the original.  3.1.2.Contrast enhancement in VFISince irregularity of the glandular architecture in BE was shown to be an indicator of dysplasia and cancer,18 a contrast enhancement feature was integrated to highlight the glands; its performance was assessed using in vivo VFI images. Figure 4(a) shows the original VFI image of an island of BE surrounded by squamous epithelium. The BE island reveals regular and intact glandular patterns as normally seen in columnar epithelium; the squamous epithelium shows no apparent structures with a homogeneous appearance across the FOV. In the enhanced VFI image in Fig. 4(b), edges of glands on the BE island are sharpened while the appearance of squamous epithelium remains homogeneous. Two ROIs, as defined in Fig. 4(b), show the columnar epithelium enclosed by the yellow box and squamous epithelium by the white box, respectively. Figure 4(c) shows the boxplot of unsharp mask intensities (on a scale of 0 to 255) in two types of epithelium. An -test shows that the 95% CI of variance ratio in the two ROIs is 2.82 to 3.05 (), indicating that the unsharp filter highlights the glands while introducing a minimal level of artifacts in the uniform squamous epithelium. Fig. 4Performance of the contrast enhancement in vivo. Original (a) and enhanced (b) images of a BE island (white arrow) surrounded by the squamous epithelium. (b) Sharpened edges of glands are apparent without introducing artifacts in the homogeneous squamous epithelium. (c) Boxplot of unsharp mask intensities in two types of epithelium as shown in (b), with columnar epithelium indicated by the yellow box and squamous epithelium by the white box. 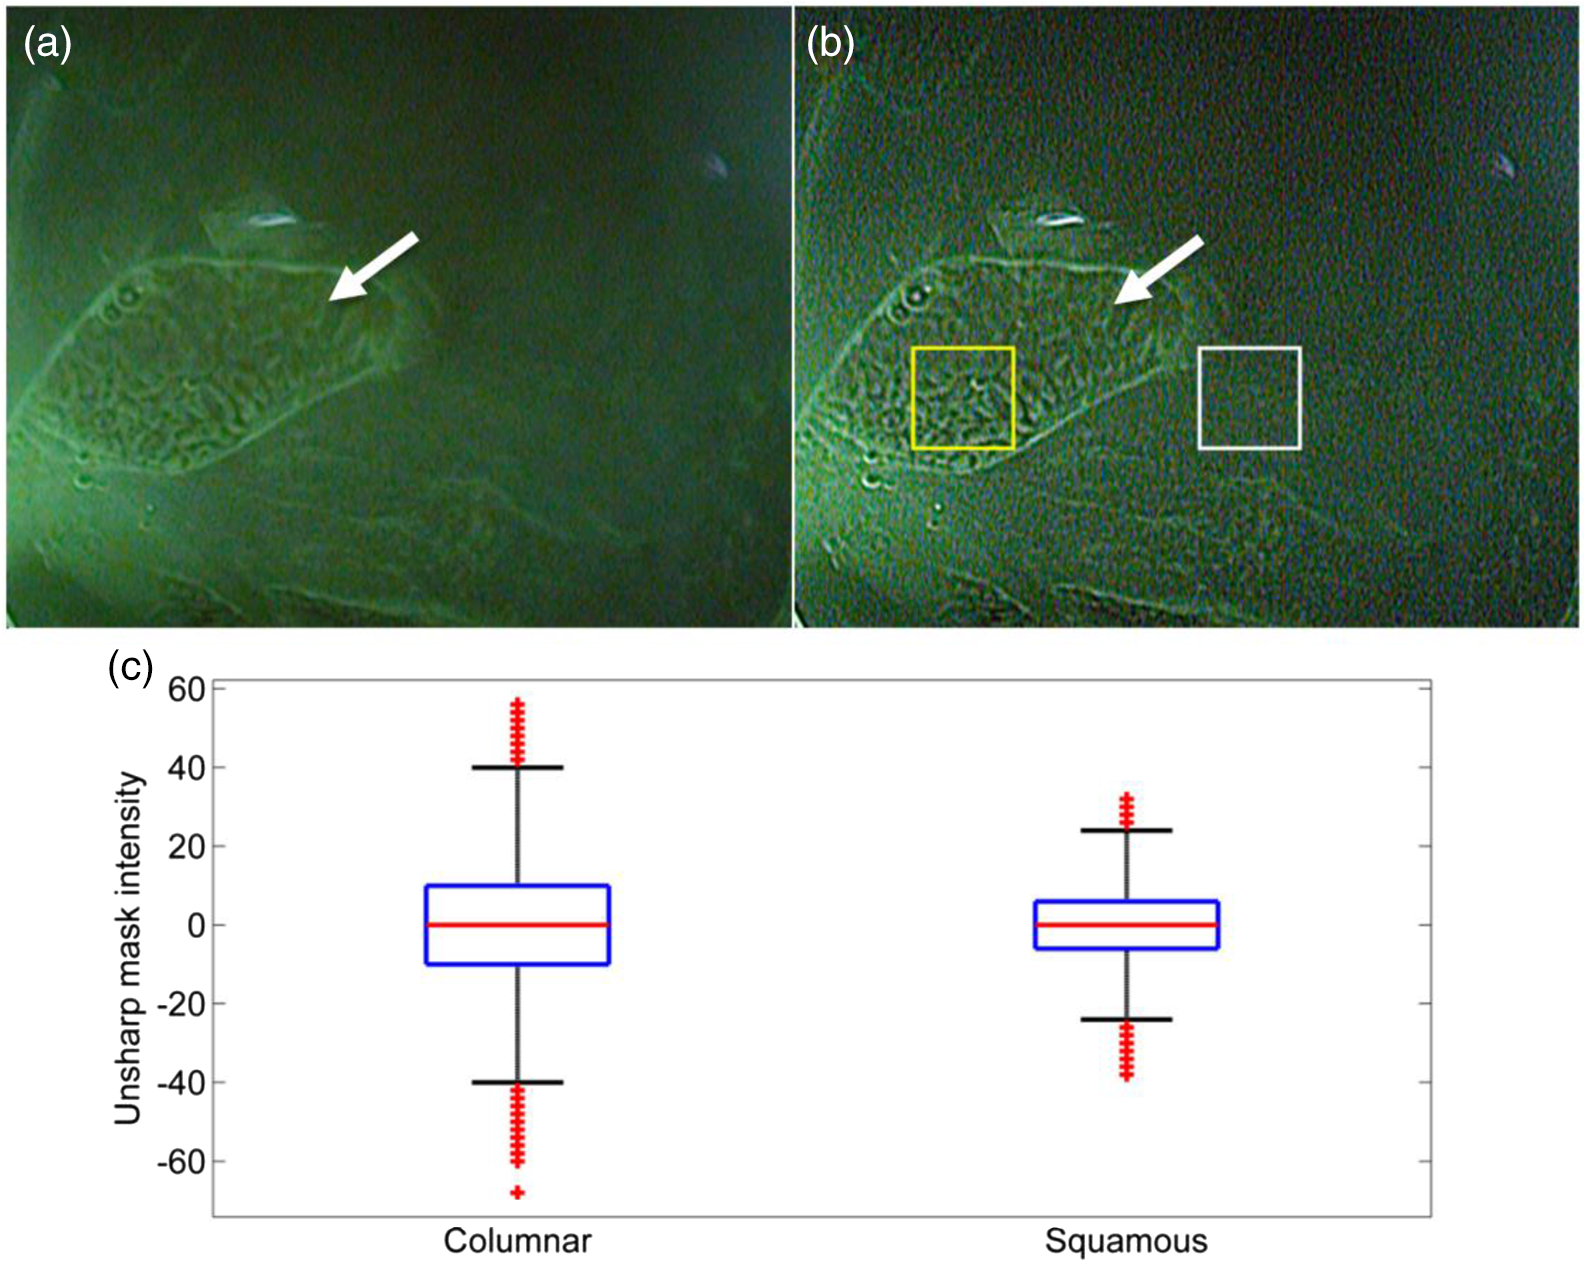 3.2.In Vivo Pilot Study: Representative ImagesIn vivo endoscopy was performed on three patients. Images were acquired in WLI and VFI modes and biopsies were taken. Figure 5 shows representative images of sites diagnosed as normal BE, HGD, and carcinoma with the corresponding histopathology. Both WLI and VFI images were contrast enhanced at the same enhancement level. In Fig. 5(a), normal BE is characterized in WLI by intact gland borders that are evenly spaced. In VFI mode, as shown in Fig. 5(b), the regular glandular architecture is highlighted with enhanced contrast. The glandular patterns are apparent in the histopathology image in Fig. 5(c), which also shows the presence of goblet cells as a hallmark of normal BE (black arrows). From normal BE to HGD, the glandular patterns become distorted and disrupted in WLI. The distortion of borders is shown in VFI mode with sharpened edges; when compared to normal BE, some areas show near effacement of the glandular architecture. In carcinoma, the WLI image in Fig. 5(i) reveals glandular effacement with abnormal vascularization. The VFI image in Fig. 5(j) shows severe distortion and disruption of glands in the ROI enclosed by the yellow solid box, and almost total effacement of glandular architecture in the ROI enclosed by the white solid box. The corresponding pathology, as revealed in Fig. 5(k), shows total obliteration of glands and absence of goblet cells. Fig. 5In vivo images of normal BE, HGD, and carcinoma in WLI and VFI with the corresponding histopathology, and mean Lab variances of selected ROIs in each image. From normal BE (a) to HGD (e) in WLI, glandular patterns appear more distorted and disrupted. The loss of glandular architecture is highlighted in VFI with enhanced contrast (f). Progressing to carcinoma, the WLI image (i) indicates glandular effacement and abnormal vascularization; the VFI image (j) shows further distortion (yellow solid box) and effacement of glands (white solid box). Histopathology of normal BE (c) shows regular and intact glands with presence of goblet cells (black arrows); absence of goblet cells is observed in HGD (g), which also reveals disruption of glandular patterns. This glandular pattern is effaced in carcinoma (k), confirming previous findings in WLI and VFI. The mean Lab variances of selected ROIs (white-dashed boxes) are higher in all VFI images than their corresponding WLI images, indicating that VFI presents enhanced contrast than WLI. The error bars show the standard deviation. 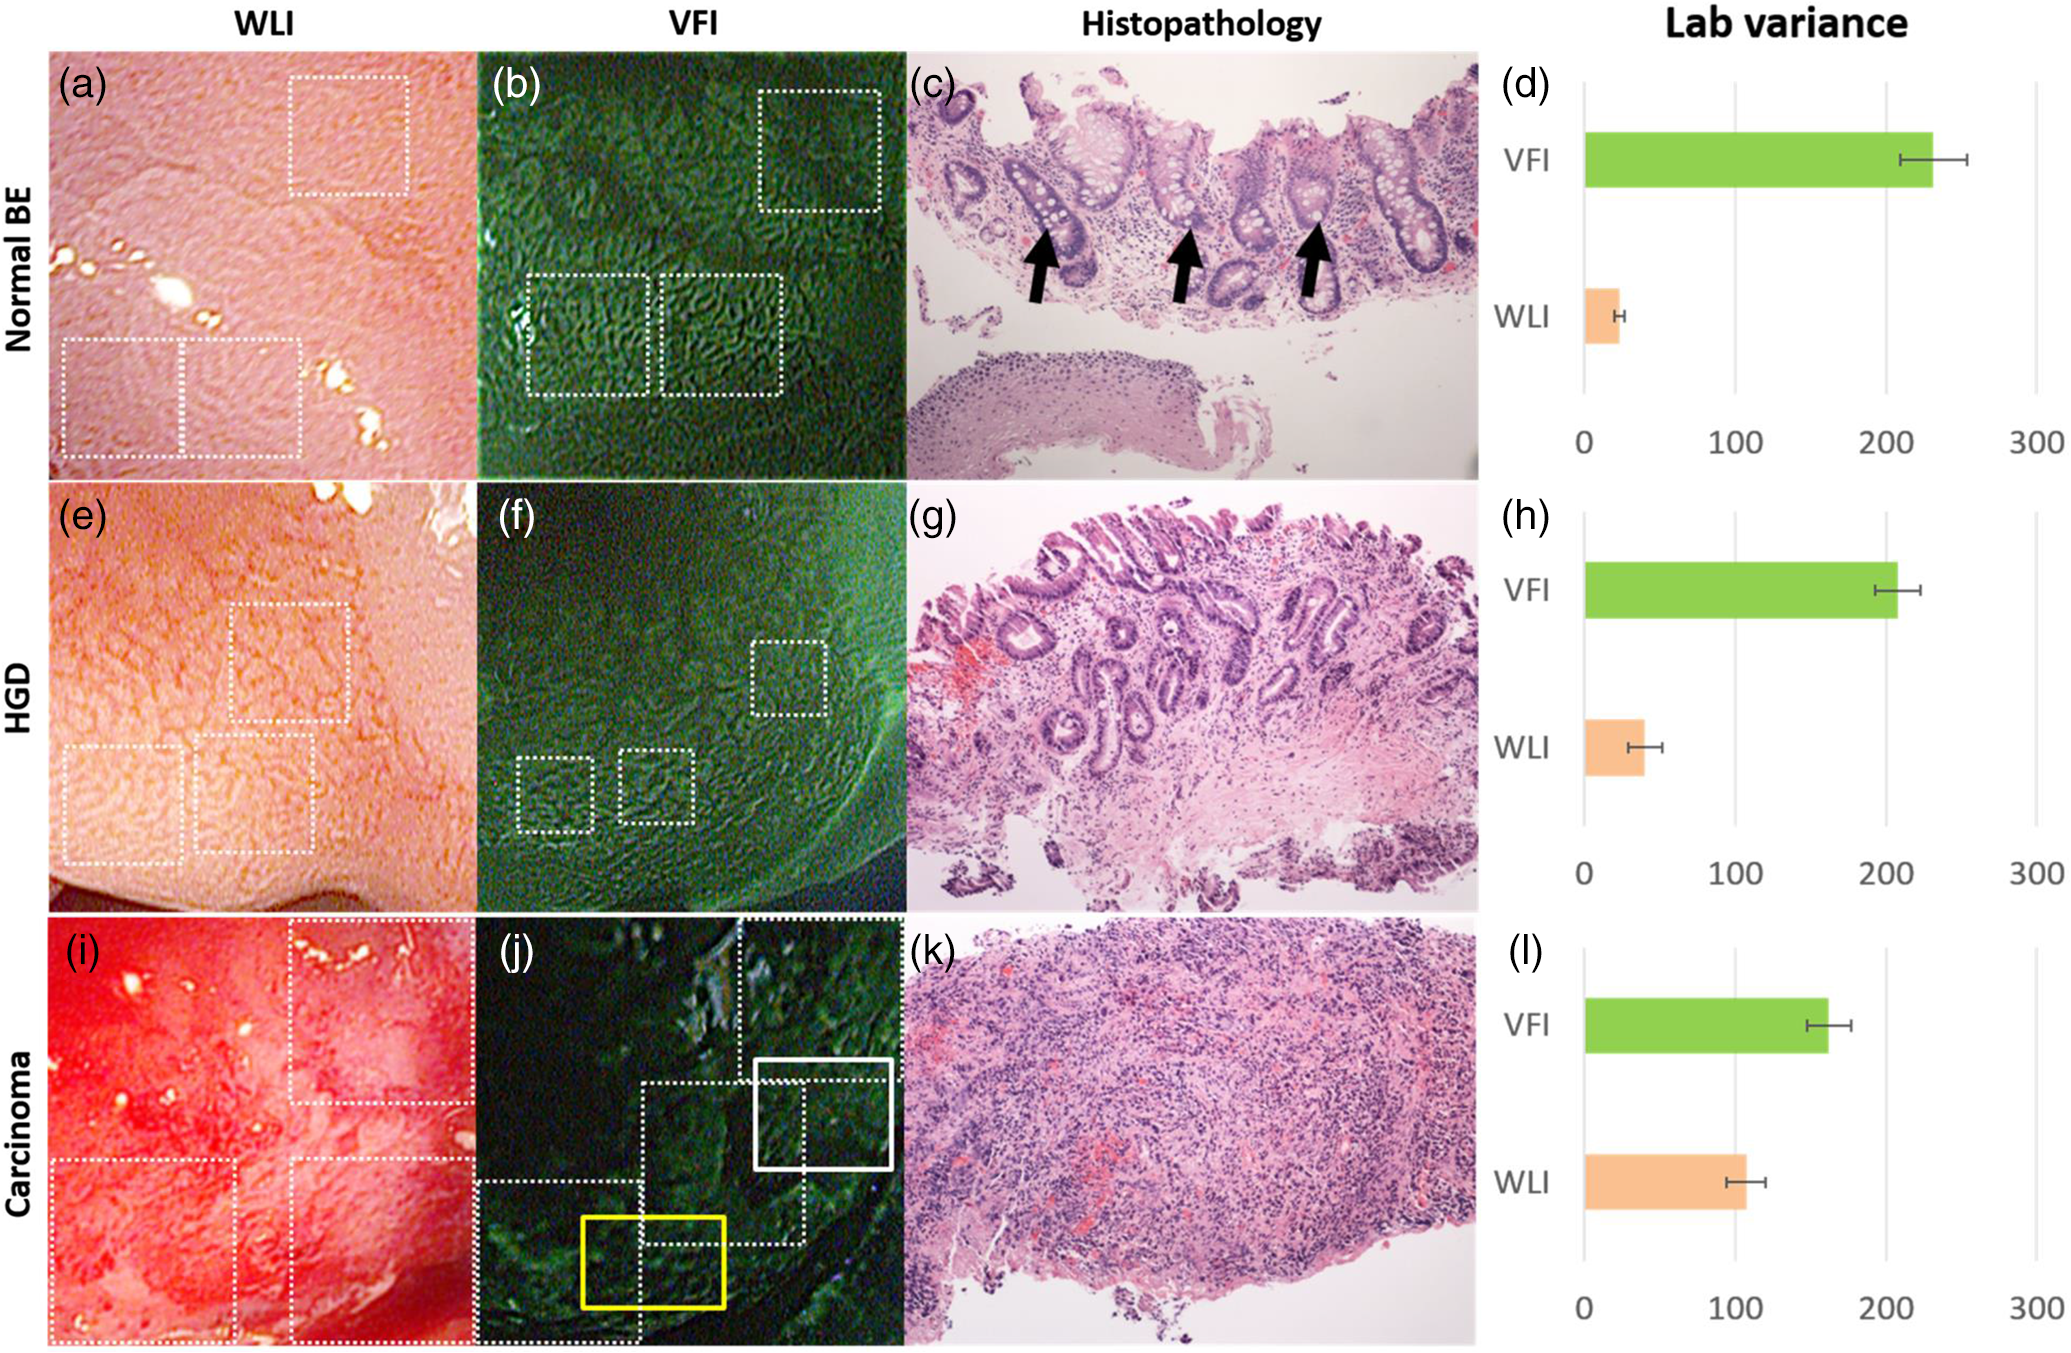 The mean Lab variance of selected ROIs (white-dashed boxes) with the standard deviation in each diagnostic category is shown in Figs. 5(d), 5(h), and 5(l). The Lab variance of VFI images in all diagnostic categories is higher than corresponding WLI images and shows as much as a 10-fold enhancement for normal BE, indicating improved contrast in VFI when compared with WLI. Contrast in VFI images decreases with disease progression due to the distortion and effacement of glandular patterns associated with neoplastic progression. Contrast in WLI images increases with disease progression, due to increased vascular atypia during neoplastic progression. Nonetheless, average contrast in VFI images is higher than in corresponding WLI images for all disease categories. This is consistent with qualitative assessment of VFI images showing improved visualization of glandular patterns. 4.DiscussionIn this research, we report the development and initial clinical use of a G2 MVE. The system can perform both white light endoscopy and VFI in a single-endoscopic insertion. In VFI mode, a real-time contrast enhancement algorithm allows improved visualization of glandular patterns in metaplasia and neoplasia compared to standard WLI. The ability to switch between VFI and standard WLI allows for convenient and accurate correlation between the two imaging modalities. Disruption and effacement of the glandular architecture is associated with cancer progression in BE;18,30,31 these findings are verified in Fig. 5. Visual assessment of WLI and VFI images of normal BE shows that glands are more readily apparent in VFI than WLI images; the alterations of glandular patterns in HGD and EAC are also discerned more readily in VFI images. Using Lab variance as a measure of image contrast, the qualitative findings are confirmed, with VFI images showing higher contrast. Since VFI targets glandular architecture through nuclei staining, it also allows for potential integration with high-resolution imaging and thus enables investigation of the nuclei at two different spatial scales. Results of this pilot trial suggest that additional studies are warranted to determine the overall accuracy of dysplasia/EAC detection using the G2 MVE. Multimodal imaging has been achieved in other advanced imaging platforms. For example, narrow-band imaging, autofluorescence imaging, and chromoendoscopy can be performed in conjunction with standard WLI. Compared to these imaging modalities, VFI targets alterations in epithelial glandular patterns during cancer progression. Moreover, it is implemented using a removable cap that can be readily adapted to existing commercial platforms with the installation of a laser diode. With increased ease of use, the effectiveness of the G2 MVE can be further evaluated in various clinical settings. This imaging platform can also be extended to other gastrointestinal sites to study glandular alterations related to the progression of metaplasia to neoplasia, such as the stomach and colon.21,32 As previously shown, the module design is compatible with a probe-based endomicroscope, which can be added to aid in the detection of early disease.18,20 Other modalities, such as fiber-based optical coherence tomography and Raman spectroscopy, could also be used in conjunction to accomplish imaging at multiple resolutions.33,34 AcknowledgmentsWe appreciate the work of Josephine Mitcham in coordinating patient accrual for the clinical study. We also acknowledge assistance from Pentax Medical. This work was supported through the National Institute of Health Academic Industrial Research Partnership Grant No. 1R01CA140257-01A1. ReferencesH. Pohl and H. G. Welch,
“The role of overdiagnosis and reclassification in the marked increase of esophageal adenocarcinoma incidence,”
J. Natl. Cancer Inst., 97 142
–146
(2005). http://dx.doi.org/10.1093/jnci/dji024 POLNCLJNCIEQ 1932-6203 Google Scholar
C. Hur et al.,
“Trends in esophageal adenocarcinoma incidence and mortality,”
Cancer, 119 1149
–1158
(2013). http://dx.doi.org/10.1002/cncr.27834 CANCAR 0008-543X Google Scholar
J. Lagergren and P. Lagergren,
“Recent developments in esophageal adenocarcinoma,”
CA. Cancer J. Clin., 63 232
–248
(2013). http://dx.doi.org/10.3322/caac.21185 CAMCAM 0007-9235 Google Scholar
M. A. Eloubeidi et al.,
“Temporal trends (1973–1997) in survival of patients with esophageal adenocarcinoma in the United States: a glimmer of hope?,”
Am. J. Gastroenterol., 98 1627
–1633
(2003). http://dx.doi.org/10.1111/j.1572-0241.2003.07454.x Google Scholar
A. Dubecz et al.,
“Temporal trends in long-term survival and cure rates in esophageal cancer: a SEER database analysis,”
J. Thorac. Oncol., 7 443
–447
(2012). http://dx.doi.org/10.1097/JTO.0b013e3182397751 Google Scholar
K. K. Wang and R. E. Sampliner,
“Updated guidelines 2008 for the diagnosis, surveillance and therapy of Barrett’s esophagus,”
Am. J. Gastroenterol., 103 788
–797
(2008). http://dx.doi.org/10.1111/ajg.2008.103.issue-3 Google Scholar
M. Vieth et al.,
“Histological analysis of endoscopic resection specimens from 326 patients with Barrett’s esophagus and early neoplasia,”
Endoscopy, 36 776
–781
(2004). http://dx.doi.org/10.1055/s-2004-825802 ENDCAM Google Scholar
K. Gono et al.,
“Appearance of enhanced tissue features in narrow-band endoscopic imaging,”
J. Biomed. Opt., 9 568
–577
(2004). http://dx.doi.org/10.1117/1.1695563 JBOPFO 1083-3668 Google Scholar
M. Kara et al.,
“Endoscopic video autofluorescence imaging may improve the detection of early neoplasia in patients with Barrett’s esophagus,”
Gastrointest. Endosc., 61 679
–685
(2005). http://dx.doi.org/10.1016/S0016-5107(04)02577-5 Google Scholar
J. Mannath et al.,
“Narrow band imaging for characterization of high grade dysplasia and specialized intestinal metaplasia in Barrett’s esophagus: a meta-analysis,”
Endoscopy, 42 351
–359
(2010). http://dx.doi.org/10.1055/s-0029-1243949 ENDCAM Google Scholar
M. Giacchino et al.,
“Clinical utility and interobserver agreement of autofluorescence imaging and magnification narrow-band imaging for the evaluation of Barrett’s esophagus: a prospective tandem study,”
Gastrointest. Endosc., 75 711
–718
(2013). http://dx.doi.org/10.1016/j.gie.2013.01.029 Google Scholar
W. L. Curvers et al.,
“Endoscopic trimodal imaging versus standard video endoscopy for detection of early Barrett’s neoplasia: a multicenter, randomized, crossover study in general practice,”
Gastrointest. Endosc., 73 195
–203
(2011). http://dx.doi.org/10.1016/j.gie.2010.10.014 Google Scholar
M. Kara et al.,
“High-resolution endoscopy plus chromoendoscopy or narrow-band imaging in Barrett’s esophagus: a prospective randomized crossover study,”
Endoscopy, 37 929
–936
(2005). http://dx.doi.org/10.1055/s-2005-870433 ENDCAM Google Scholar
R. Kiesslich et al.,
“In vivo histology of Barrett’s esophagus and associated neoplasia by confocal laser endomicroscopy,”
Clin. Gastroenterol. Hepatol., 4 979
–987
(2006). http://dx.doi.org/10.1016/j.cgh.2006.05.010 Google Scholar
H. Pohl et al.,
“Miniprobe confocal laser microscopy for the detection of invisible neoplasia in patients with Barrett’s oesophagus,”
Gut, 57 1648
–1653
(2008). http://dx.doi.org/10.1136/gut.2008.157461 GUTTAK 0017-5749 Google Scholar
M. J. Cobb et al.,
“Imaging of subsquamous Barrett’s epithelium with ultrahigh-resolution optical coherence tomography: a histologic correlation study,”
Gastrointest. Endosc., 71 223
–230
(2010). http://dx.doi.org/10.1016/j.gie.2009.07.005 Google Scholar
J. A. Evans et al.,
“Optical coherence tomography to identify intramucosal carcinoma and high-grade dysplasia in Barrett’s esophagus,”
Clin. Gastroenterol. Hepatol., 4 38
–43
(2006). http://dx.doi.org/10.1016/S1542-3565(05)00746-9 Google Scholar
N. Thekkek et al.,
“Modular video endoscopy for in vivo cross-polarized and vital-dye fluorescence imaging of Barrett’s-associated neoplasia,”
J. Biomed. Opt., 18 026007
(2013). http://dx.doi.org/10.1117/1.JBO.18.2.026007 JBOPFO 1083-3668 Google Scholar
C. J. Alden and S. Arnott,
“Stereochemical model for proflavin intercalation in A-DNA,”
Nucleic Acids Res., 4 3855
–3862
(1977). http://dx.doi.org/10.1093/nar/4.11.3855 Google Scholar
T. J. Muldoon et al.,
“High-resolution imaging in Barrett’s esophagus: a novel, low-cost endoscopic microscope,”
Gastrointest. Endosc., 68 737
–744
(2008). http://dx.doi.org/10.1016/j.gie.2008.05.018 Google Scholar
N. Thekkek et al.,
“Vital-dye enhanced fluorescence imaging of GI mucosa: metaplasia, neoplasia, inflammation,”
Gastrointest. Endosc., 75 877
–887
(2012). http://dx.doi.org/10.1016/j.gie.2011.10.004 Google Scholar
E. Robbins,
“The rate of proflavin passage into single living cells with application to permeability studies,”
J. Gen. Physiol., 43 853
–866
(1960). http://dx.doi.org/10.1085/jgp.43.4.853 JGPLAD 0022-1295 Google Scholar
P. A. Janssen et al.,
“To dye or not to dye: a randomized, clinical trial of a triple dye/alcohol regime versus dry cord care,”
Pediatrics, 111 15
–20
(2003). http://dx.doi.org/10.1542/peds.111.1.15 PEDIAU 0031-4005 Google Scholar
A. L. Polglase et al.,
“A fluorescence confocal endomicroscope for in vivo microscopy of the upper- and the lower-GI tract,”
Gastrointest. Endosc., 62 686
–695
(2005). http://dx.doi.org/10.1016/j.gie.2005.05.021 Google Scholar
T. J. Muldoon et al.,
“Noninvasive imaging of oral neoplasia with a high-resolution fiber-optic microendoscope,”
Head Neck, 34 305
–312
(2012). http://dx.doi.org/10.1002/hed.v34.3 Google Scholar
M. K. Quinn et al.,
“High-resolution microendoscopy for the detection of cervical neoplasia in low-resource settings,”
PLoS One, 7 e44924
(2012). http://dx.doi.org/10.1371/journal.pone.0044924 Google Scholar
J. M. Dixon, M. Taniguchi and J. S. Lindsey,
“PhotochemCAD 2: a refined program with accompanying spectral databases for photochemical calculations,”
Photochem. Photobiol., 81 212
–213
(2007). http://dx.doi.org/10.1111/j.1751-1097.2005.tb01544.x PHCBAP 0031-8655 Google Scholar
G. Sharma, W. Wu and E. N. Dalal,
“The CIEDE2000 color-difference formula: implementation notes, supplementary test data, and mathematical observations,”
Color Res. Appl., 30 21
–30
(2005). http://dx.doi.org/10.1002/(ISSN)1520-6378 CREADU 0361-2317 Google Scholar
M. Pedersen et al.,
“Evaluation of contrast measures in relation to observers perceived contrast,”
in Society for Imaging Science and Technology—4th European Conf. Graphics Imaging, and Vision, 10th Int. Symp. Multispectral Colour Science (CGIV 2008/MCS 2008),
253
–258
(2008). Google Scholar
R. C. Haggitt,
“Barrett’s esophagus, dysplasia, and adenocarcinoma,”
Hum. Pathol., 25 982
–993
(1994). http://dx.doi.org/10.1016/0046-8177(94)90057-4 HPCQA4 0046-8177 Google Scholar
J.-F. Fléjou,
“Barrett’s oesophagus: from metaplasia to dysplasia and cancer,”
Gut, 54
(Suppl 1), i6
–i12
(2005). http://dx.doi.org/10.1136/gut.2004.041525 GUTTAK 0017-5749 Google Scholar
Y. H. Park and N. Kim,
“Review of atrophic gastritis and intestinal metaplasia as a premalignant lesion of gastric,”
Cancer, 20 25
–40
(2015). http://dx.doi.org/10.15430/JCP.2015.20.1.25 CANCAR 0008-543X Google Scholar
J. Evans et al.,
“Identifying intestinal metaplasia at the squamocolumnar junction by using optical coherence tomography,”
Gastrointest. Endosc., 65 50
–56
(2007). http://dx.doi.org/10.1016/j.gie.2006.04.027 Google Scholar
L. M. Almond et al.,
“Endoscopic Raman spectroscopy enables objective diagnosis of dysplasia in Barrett’s esophagus,”
Gastrointest. Endosc., 79 37
–45
(2014). http://dx.doi.org/10.1016/j.gie.2013.05.028 Google Scholar
|


