|
|
1.IntroductionTo date, more than 1000 trace volatile organic compounds (VOCs) have been found in exhaled breath at concentrations ranging from ppmv to pptv.1 The VOCs in exhaled breath can be established as biomarkers for particular diseases and metabolic disorders.1 Ammonia is a proven important VOC in breath. This breath molecule is established as a biomarker for clinical diagnostics, such as hemodialysis monitoring,2 diagnosis of hepatic encephalopathy,3 detection of Helicobacter pylori,4 and halitosis.5 Ammonia is a component of the nitrogen cycle resulting from protein metabolism. Ammonia is present in body fluids in two forms: unionized ammonia () and ammonium ion (). Highly toxic is converted to less toxic urea in the liver through the urea and citric acid cycles. Urea is transported to the kidneys via the bloodstream and is then removed from the body by the kidneys in urine. For a healthy person, blood ammonia can be filtered out of the body properly and is made harmless by the liver and kidneys. Dysfunction or impairment of these organs gives rise to increasing ammonia levels in the blood, which is diffused into the lungs and can be exhaled in breath. Ammonia at a very high concentration becomes dangerous for the human body. Therefore, ammonia plays a significant role in the human body. Detailed information on ammonia metabolism can be found in Ref. 6. In most studies, the ammonia concentrations in exhaled breath of healthy subjects alone, or of a small cohort () of healthy volunteers and patients, were measured by using different techniques. To our knowledge, up to now, no studies have considered real-time monitoring of breath ammonia in a large cohort of healthy volunteers, patients with chronic kidney disease (CKD), and patients diagnosed with epilepsy and receiving valproic acid (VAP) therapy. A chemoresistive gas sensor has been developed consisting of flame-made nanostructured , a promising phase for selective detection of breath . This sensor showed selectivity toward acetone, NO, and CO, and accurately detected breath-relevant concentrations down to 400 ppb under 90% relative humidity.7 Spacek et al.8 measured breath ammonia in real time by quartz-enhanced photoacoustic spectrometry and blood ammonia in 10 healthy and 10 cirrhotic participants. Ogimoto et al.9 fabricated quartz crystal microbalance (QCM) sensors and showed that the sensors can detect ammonia in human breath at pathological levels (greater than 3 ppm). Spacek at al. used breath analysis of ammonia, ethanol, hydrogen, and acetone to investigate gastrointestinal physiology. In 30 healthy participants, they measured each metabolite serially over 6 h in control and high protein trials.10 Owen and Farooq11 found breath ammonia levels of 100 to 350 ppb in eight healthy individuals and to 4500 ppb in three patients diagnosed with CKD. Schmidt et al.12 measured ammonia concentrations in exhaled breath of 20 healthy subjects on-line with a commercial cavity ring-down spectrometer and found values of 396 to 2133 ppb. Hibbard and Killard used a commercial photoacoustic laser ammonia analyzer to measure real-time levels of ammonia in exhaled human breath in a small normal healthy population (). They determined an average level of breath ammonia of 265 ppb, ranging from 29 to 688 ppb, and found no correlation between oral breath ammonia and age, sex, body mass index (BMI), or breath carbon dioxide levels.13 Enderby et al.14 measured the levels of ammonia in the exhaled breath of 200 healthy school children aged 7 to 18 years by using selected ion flow tube mass spectrometry (SIFT-MS) and found a concentration range of 112 to 2865 ppb. Neri et al. analyzed the breath of 20 patients and 20 healthy volunteers and found a correlation between expired ammonia and blood urea nitrogen (BUN) levels using ion mobility spectrometry (, ; , ) and cavity ring-down spectroscopy techniques (, ; , ), respectively, both before and at the end of dialysis.15 Narasimhan et al. determined breath ammonia levels in seven patients with end-stage renal disease of 1500 to 2000 ppb before hemodialysis and 150 to 200 ppb after hemodialysis. One of these seven patients showed a correlation between breath ammonia and BUN, with , and between breath ammonia and creatinine, with .16 The further studies related to breath ammonia measurement can be found in, e.g., review articles.17,18 More research in this area is clearly necessary owing to differences in the reported breath ammonia levels. In the present study, the external cavity laser (ECL)-based off-axis cavity-enhanced absorption spectroscopy (OA-CEAS) was applied to noninvasive clinical diagnosis using expired breath ammonia analysis. For this aim, (1) the correlation between breath ammonia levels and blood parameters related to CKD was investigated and (2) the relationship between breath ammonia levels and blood concentrations of VAP was studied. For this purpose, we measured breath ammonia concentrations and correlated these with blood parameters related to epilepsy and CKD. Thus, venous blood and breathed air in a cohort () of patients with CKD (17 men/10 women, aged 45 to 78 years), of healthy volunteers (8 men/7 women, aged 25 to 51 years), and epilepsy patients before and after taking VAP (6 men/4 women, aged 30 to 60 years) were simultaneously sampled. The breath ammonia levels were measured by using ECL-based OA-CEAS. We found breath ammonia levels of 120 to 530 ppb in healthy subjects and 710 to 10,400 ppb in patients with CKD. We observed a statistically significant positive correlation between breath ammonia concentrations and urea, BUN, creatinine, or estimated glomerular filtration rate (eGFR) in all patients. A linear correlation between breath ammonia and urea (, ), BUN (, ), and creatinine (, ) was demonstrated. An exponential relationship between breath ammonia and eGFR () was found. It was demonstrated that taking VAP gave rise to increasing breath ammonia levels: a mean of 636 ppb ranging from 250 to 1090 ppb before taking VAP and a mean of 989 ppb ranging from 450 to 1477 ppb after taking VAP. A statistically significant difference was found between the levels of exhaled in healthy subjects () and in patients with epilepsy before and after taking VAP (). But no correlation between the breath ammonia levels and blood VAP concentrations (, ) was found. The noninvasive technique used in this work can provide rapid routine diagnosis and continuous monitoring of the health status of patients with epilepsy and CKD, e.g., during hemodialysis. 2.Human SubjectsThe subjects for this study were recruited among workers and patients in the Research and Education Hospital of Suleyman Demirel University. Fifteen healthy volunteers (7 women/8 men, aged 25 to 51 years), 10 epilepsy patients diagnosed with epilepsy and receiving VAP therapy (6 men/4 women, aged 30 to 60 years), and 27 patients with CKD (10 women/17 men, aged 45 to 78 years) participated in the study. Exclusion criteria were active infection, cancer, H. pylori infection, liver failure, and pregnancy. Smokers and subjects who consumed alcohol were not included in the study. For biochemical analysis, venous blood samples were collected at the same time as breath ammonia measurements. The demographic, clinical, and laboratory characteristics of patients and healthy subjects are compiled in Table 1. Table 1Demographic, clinical, and laboratory characteristics of 27 patients suffering from CKD, 10 patients diagnosed with epilepsy, and 15 healthy volunteers participated in the study.
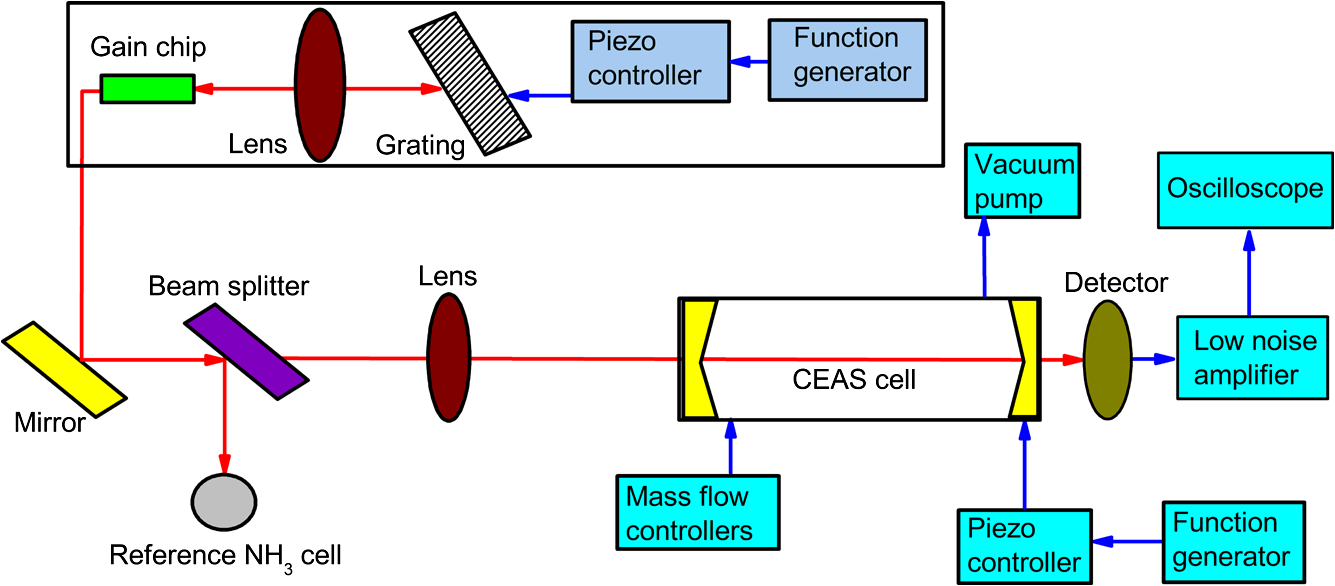
The subjects were required to fast overnight. All samples were taken in the hospital between 08:00 and 11:00 AM. Information was collected regarding age, height and weight, medication, smoking, and alcohol use. The research was approved by the ethics committee of the hospital; all volunteers gave their written informed consent to participate in the study. 3.MethodsDetails of the experimental setup (ECL-based OA-CEAS) used in this study are presented in our earlier work (Fig. 1).19,20 Briefly, a broadly coarse wavelength tuning range of 170 nm () for the spectral range between 1451 and 1621 nm is achieved by rotating the diffraction grating forming ECL configuration in single-mode operation. A mode-hop-free tuning range of is obtained. The linewidths below 140 kHz are recorded. Using the absorption line of ammonia at , detection limit of is demonstrated for 512 averages.20 The laser beam is coupled into the CEAS cavity in the OA alignment via a 50-cm lens and a mirror. The cavity consists of two high reflective mirrors positioned 50 cm apart with a reflectivity of over the spectral range between 700 and 1650 nm with a 2.54-cm diameter and a radius of curvature of 1 m (LayerTec GmbH). The radiation exiting the cavity is focused on an InGaAs fixed gain detector (Thorlabs, PDA10CF-EC) with DC from 150-MHz bandwidth. After amplification (gain factor: ) and filtering (30 kHz low pass filter) by a low-noise amplifier (SRS, SR560), the signal is fed to a digitizing oscilloscope (Tektronix, DPO3034). The oscilloscope output is connected to a computer via USB connection and recorded using Tektronix Analysis Software. The absorption line at is an isolated line and suitable for breath analysis.21 The following procedures for breath collection and analysis are performed to remove residual ammonia in the cell and to prepare the system for the next sample.22–24 The alveolar air sample is collected using a mouthpiece, flutter valve, T-connector, collection bag, and discard bag (Quintron). The separation of the dead-space air from alveolar air is performed by using the disposable polyethylene discard bag. The expired breath air, containing “dead-space” air, is first directed into the discard bag, and then the alveolar air is diverted to the collection bag. To deliver the alveolar air sample collected in the collection bag into the quartz-coated sample cell (CRD Optics), a two-way nonrebreathing valve (Hans Rudolph, Inc.) and a mass flow controller calibrated for exhaled breath (Alicat, MCV-2SLPM-D/5M) are used. Before taking measurements, the cell is evacuated using a vacuum pump (Agilent, IDP3) to the minimum achievable value (), and is then flushed with indoor air for 30 min, because the molecules in indoor air aid to remove from the cell. After filling the cell with pure to a total pressure of 1000 mbar, it is again evacuated. The cell is heated to 35 to 40°C for desorption of ammonia adhered on the mirror surfaces and walls of the cell. The measurement is carried out at a reduced pressure of 50 mbar. The flow rate of the mass flow controller is 1500 sccm. An example for the transmission signal through the CEAS cell filled with alveolar air is depicted in Fig. 2(a). From this Figure, the isolated absorption line of at and the absorption line of and at can be seen. The line strengths are for the absorption line at ,21 for the absorption line at ,21 and for the absorption line at ,25 respectively. In Fig. 2(b), the data in units of percent transmission and FPI peaks are plotted. In Fig. 2(c), the absorption coefficient of at , which is calculated according to Eq. (1), and Voigt fit through the experimental data points are depicted. where is the baseline signal, is the recorded CEAS signal, is the mirror reflectivity, and (50 cm) is the distance between the cavity mirrors.Fig. 2(a) The raw data of the signal through the CEAS cell filled with breath of a patient with CKD. The isolated absorption line of at and the absorption line of and at are shown (solid blue line). The base line () is shown in dashed red line. (b) The data in units of percent transmission (blue line) and FPI peaks (orange line) are plotted. (c) The Voigt fit (green line) and absorption coefficient (blue circles) of ammonia at .  To determine the line strength , the integrated CEAS signal is plotted as a function of the pressure in our previous work.19 The slope of the linear fit through the data points gives a value for of , which is in agreement with the result reported by Webber et al.21 In our earlier work, the integrated absorption is also plotted as function of the concentration, on the basis of Eq. (1).19 A mirror reflectivity can be determined from the slope of the resulting liner fit using Eq. (1). From these measurements, the mirror reflectivity of is determined, which corresponds to an effective path length () of . The ammonia concentration is calculated from the line strength, the area under the absorption line, and the total molecule concentration. The measurements for breath ammonia concentrations were repeated to determine how much of the statistical variation is due to measurement error [Fig. 3(a)]. The mean is 3140 ppb ranging from 3105 to 3178 ppb, the standard deviation (SD) is 26 ppb, and the standard error (SE) is 12 ppb. In order to determine the linear dynamic range, breath ammonia concentration is plotted versus absorption coefficient and area under absorption coefficient over the entire measurement range of the CKD. As shown in Fig. 3(b), the plot is linear for absorption coefficient (, ) and area (, ). 4.Results4.1.Chronic Kidney DiseaseTo measure the eGFR, creatinine, and BUN levels, venous blood samples were taken from volunteers during routine examination. We measured the breath ammonia levels by using ECL-based OA-CEAS technique, and found a range of 120 to 530 ppb for healthy subjects with apparently normal liver and kidney function, and 710 to 10,400 ppb in patients. We observed a good correlation between breath ammonia and serum urea, BUN, creatinine, or eGFR in 27 patients. In Fig. 4, the squares correspond to the experimental data, and the solid lines show fits to the data. A linear correlation between breath ammonia and urea (, ), BUN (, ), or creatinine (, ) was observed. An exponential relationship between breath ammonia and eGFR () was found. Fig. 4Breath ammonia versus urea, BUN, creatinine, and eGFR correlation in 27 CKD patients. The squares correspond to the experimental data. The solid lines show fits to the data. A linear correlation between breath ammonia and urea (, ), BUN (, ), or creatinine (, ) is observed. An exponential correlation between breath ammonia and eGFR () is demonstrated.  4.2.EpilepsyWe used a box-plot analysis to compare the concentrations of ammonia in exhaled breath of epilepsy patients before and after taking VAP and of healthy subjects (Fig. 5). The box-plot analysis is a statistical analysis technique and can be utilized to demonstrate the distribution of a dataset through their quartiles. From the box plot, a mean of 323 ppb ranging from 120 to 530 ppb was obtained from the breath ammonia of healthy volunteers, while the breath ammonia levels of epilepsy patients were ranged from 250 to 1090 ppb with a mean of 636 ppb before taking VAP and from 450 to 1477 ppb with a mean of 989 ppb after taking VAP (Table 2). Therefore, an increased concentration of exhaled ammonia in patients after taking VAP was observed in comparison to those before taking VAP. The concentrations of breath ammonia in healthy people were found to be lower than the levels in epilepsy patients. A statistically significant difference was found between the levels of exhaled in healthy subjects () and in patients with epilepsy before and after taking VAP (). We observed no correlation between the breath ammonia levels and blood VAP concentrations (, ). Fig. 5(a) Box plot comparison of exhaled breath ammonia levels from healthy volunteers and epilepsy patients before and after taking VAP and (b) breath ammonia versus VAP correlation in 10 epilepsy patients.  Table 2Minimum, maximum, quartiles, and mean values of concentrations of exhaled ammonia.
5.Discussion5.1.Technique Used in the Present Work: OA-CEASCurrently, invasive techniques are used to detect the biomarkers that cause significant discomfort to the patient. There is therefore a desire to develop noninvasive techniques of detection. Furthermore, a technique that does not require special training is needed for point-of-care use. The noninvasive breath analysis technique, especially the laser-based method, is a good candidate for this purpose. Despite of the long history of breath test,26 there are still several issues that should be addressed for routine clinical use of breath analysis in hospitals.27,28 Among others, it is very important to develop the ease-to-use, high sensitive, high selective, portable, compact, real-time, and low construction and maintenance cost devices operating at room temperature. Such devices are currently being developed. Detection methods, such as gas chromatography mass spectrometry, SIFT-MS, and proton transfer reaction mass spectrometry are not ideal for practical application in hospitals because they are expensive, bulky, complex, time consuming, and require complicated procedures for sample collection and preconcentration. The laser-based optical techniques, such as OA-CEAS, photoacoustic spectroscopy (PAS), cavity ringdown spectroscopy (CRDS), and multipass cell absorption method, are more compact and can provide real-time analysis without the need for preconcentration. There are commercially available PAS and CRD sensors on the market. PAS sensors are highly sensitive to mechanical and acoustic vibrations, whereas their small size is the main advantage of such sensors. The CRDS method requires high-speed electronics. The OA-CEAS technique used in the present work has several advantages over the other laser-based techniques; it is almost insensitive to vibrations and to fluctuations in pressure and temperature, there is no need for active locking and high-speed electronics, and alignment is simpler. These advantages make the OA-CEAS instrument more suitable for measurements outside the laboratory environment. In our present system, a cheaper laser source and electronics are used in comparison to other commercially available ammonia sensors. Furthermore, our system is able to analyze the breath VOCs in a broad spectral range between 700 and 1620 nm. These could be further highlighted as advantages. The chance of the potential commercial realization of the present technology in a hospital setting can be further increased by the miniaturization of our system. Therefore, miniature optical components, such as in ECLs from Daylight Solutions, should be used. An all-in-one laser diode controller (e.g., MOGbox DLC202 from Moglabs) can be utilized for a more compact setup. Such a controller includes ultralow-noise current driver, temperature controller, ramp generator, piezodrivers, modulator, demodulator (lock-in amp), servo feedback system, and photodetector. A CEAS absorption cell with smaller physical length can be designed by using the mirrors with larger diameter to compensate the detection limit, which is achieved with larger cell length. To further decrease the size of the system, PAS cell can be alternatively used. 5.2.Chronic Kidney DiseaseThe eGFR is used to evaluate how well the kidneys are working and to determine the stage of kidney disease. This test estimates how much blood passes through the glomeruli (the tiny filters in the kidneys) per minute and, therefore, provides information about the volume of blood that is filtered by the kidneys over a given time period. If these filters do not work properly, the kidneys have a reduced or impaired function. The eGFR test is based on the measurements of the creatinine in the blood. Creatinine should be removed from the blood by the kidneys. If kidney function is abnormal, the creatinine level in the blood increases. The eGFR is calculated considering the age, sex, blood creatinine level, and ethnicity.29 The eGFR can be used to diagnose kidney disease in its early stages more reliably than the creatinine test. The eGFR level suggests the severity of kidney disease: if more than , the kidneys are working properly; if it is between 90 and , the kidneys are not working as well as they should (there is kidney disease); and if less than , it indicates kidney failure. However, the eGFR is not useful for everyone. This is not a good test for people who are younger than 18 years, pregnant, overweight, or very muscular.29 The liver produces ammonia and forms urea by combining nitrogen with other elements, such as carbon, hydrogen, and oxygen. The urea is transported from the liver to the kidneys through the bloodstream. The urea can be filtered properly by healthy kidneys. Urea and other waste products can be removed from the body through urine. The BUN test measures the amount of urea nitrogen in the blood and provides information about how well the kidneys and liver are working. Narasimhan et al. found a correlation between breath ammonia and BUN (), and between breath ammonia and creatinine () for one of seven patients.16 Neri et al. showed a relationship between expired ammonia and BUN levels using ion mobility spectrometry (, ; , ) and cavity ring-down spectroscopy techniques (, ; , ), respectively, both before and at the end of dialysis in 20 patients.15 However, they did not evaluate eGFR. Another difference between our study and theirs is the sample size; 27 patients with CKD of different stages participated in our study. A higher number of individuals in a study results in a more accurate result. The ammonia concentrations in mouth-exhaled breath, nose-exhaled breath, and in the oral cavity have been measured and found that the mount-exhaled concentration is lower than the concentration in the oral cavity and higher than the nose-exhaled concentration, indicating that mouth-exhaled is also produced in the oral cavity, in addition from the alveoli.30,31 In a recently published study, it is claimed that the origin of in the oral cavity is the oral fluid urea.32 However, it is known that salivary urea correlates very well to serum urea.33–35 Zuniga et al.36 reported that the salivary urea test has the potential to be used as a method to discriminate patients with CKD. Therefore, the salivary urea cannot be seen independently from the serum urea. Imran et al.37 observed no relationship between eGFR and blood ammonia (). The difference in breath ammonia concentrations and blood ammonia levels observed in CKD patients could be explained by differences in the mucus membranes in the oral cavity and in pulmonary alveoli.31 Therefore, a portable, accurate, easy-to-use, real-time breath ammonia measurement system can be very useful to simplify noninvasive, on-line, and continuous assays of eGFR, creatinine levels, and other clinical parameters related to CKD. Our system can be utilized in the future for this purpose. 5.3.EpilepsyA blood–brain barrier protects the brain from entering toxins. The permeability of the blood–brain barrier can be modified by the components, such as glutamine, which is produced from the irregular synthesis of the urea cycle. Increased glutamine levels can then change the osmotic tendencies around brain tissue giving rise to swelling of the brain.38 Ammonia becomes neurotoxic at higher concentrations. Excessive cerebral ammonia can lead to astrocytic glutamine accumulation and cerebral oedema.39 Ammonia entering the brain is able to affect the gene expression and signal transmission of neurons. The breath ammonia is established as a biomarker for clinical diagnostics of neurological diseases, such as hepatic encephalopathy, which is a consequence of advanced liver disease.3 Liver dysfunction is usually accompanied by hyperammonemia (increasing the blood ammonium levels). Hyperammonemia has been also reported to be associated with patients taking VAP.40,41 An increased concentration of ammonia in blood can probably result in increasing of breath ammonia levels of epilepsy patients. VAP, a branched short-chain fatty acid, is an antiepileptic drug commonly used in the treatment of epilepsy, migraine, and psychiatric disorders. For the first time, to our knowledge, the correlation between breath ammonia levels and blood VAP concentrations was investigated in the present study. In the future, our breath ammonia measuring system has a potential to use in the treatment of epilepsy. More comprehensive studies are necessary in this area. 6.ConclusionsWe applied the ECL-based OA-CEAS to noninvasive clinical diagnosis using expired breath ammonia analysis: (1) the correlation between breath ammonia levels and blood parameters related to CKD was investigated and (2) the relationship between breath ammonia levels and blood concentrations of VAP was studied. The concentrations of breath ammonia in 15 healthy volunteers, 10 epilepsy patients (before and after taking VAP), and 27 patients with different stages of CKD were measured. We found a range of breath ammonia levels of 120 to 530 ppb in healthy subjects and 710 to 10,400 ppb in patients with CKD. A statistically significant linear correlation between breath ammonia and urea (, ), BUN (, ), or creatinine (, ) in 27 patients with CKD was demonstrated. An exponential relationship between breath ammonia and eGFR () was found. The breath ammonia levels were determined to be between 250 and 1090 ppb before taking VAP, and between 450 and 1477 ppb after taking VAP. A statistically significant difference was found between the levels of exhaled in healthy subjects () and in patients with epilepsy before and after taking VAP (). However, no significant correlation between the breath ammonia levels and blood VAP concentrations (, ) was shown. The experimental results show the possibility of using our real-time breath ammonia measurement system for rapid routine diagnosis and continuous monitoring of the health status of patients with epilepsy and CKD. AcknowledgmentsWe gratefully acknowledge financial support by the Scientific and Technological Research Council of Turkey (TUBITAK, 112E559) and Suleyman Demirel University (SDU BAP, 3917-D2-14). ReferencesC. Wang and P. Sahay,
“Breath analysis using laser spectroscopic techniques: breath biomarkers, spectral fingerprints, and detection limits,”
Sensors, 9 8230
–8262
(2009). http://dx.doi.org/10.3390/s91008230 ISJEAZSNSRES 1530-437X0746-9462 Google Scholar
L. R. Narasimhan, W. Goodman and C. K. Patel,
“Correlation of breath ammonia with blood urea nitrogen and creatinine during hemodialysis,”
Proc. Natl. Acad. Sci. U. S. A., 98
(8), 4617
–4621
(2001). http://dx.doi.org/10.1073/pnas.071057598 Google Scholar
S. DuBois et al.,
“Breath ammonia testing for diagnosis of hepatic encephalopathy,”
Digestive Dis. Sci., 50 1780
–1784
(2005). http://dx.doi.org/10.1007/s10620-005-2937-6 DDSCDJ 0163-2116 Google Scholar
D. J. Kearney, T. Hubbard and D. Putnam,
“Breath ammonia measurement in Helicobacter pylori infection,”
Digestive Dis. Sci., 47 2523
–2530
(2002). http://dx.doi.org/10.1023/A:1020568227868 DDSCDJ 0163-2116 Google Scholar
A. Amano et al.,
“Monitoring ammonia to assess halitosis,”
Oral Surg. Oral Med. Oral Pathol. Oral Radiol. Endod., 94 692
–696
(2002). http://dx.doi.org/10.1067/moe.2002.126911 Google Scholar
M. M. Adeva et al.,
“Ammonium metabolism in humans,”
Metabolism, 61 1495
–1511
(2012). http://dx.doi.org/10.1016/j.metabol.2012.07.007 METAAJ 0026-0495 Google Scholar
A. T. Guntner, M. Righettoni and S. E. Pratsinis,
“Selective sensing of by Si-doped for breath analysis,”
Sensors Actuators B, 223 266
–273
(2016). http://dx.doi.org/10.1016/j.snb.2015.09.094 Google Scholar
L. A. Spacek et al.,
“Clinical utility of breath ammonia for evaluation of ammonia physiology in healthy and cirrhotic adults,”
J. Breath Res., 9 047109
(2015). http://dx.doi.org/10.1088/1752-7155/9/4/047109 Google Scholar
Y. Ogimoto et al.,
“Detection of ammonia in human breath using quartz crystal microbalance sensors with functionalized mesoporous nanoparticle films,”
Sensors Actuators B, 215 428
–436
(2015). http://dx.doi.org/10.1016/j.snb.2015.03.103 Google Scholar
L. A. Spacek et al.,
“Breath ammonia and ethanol increase in response to a high protein challenge,”
Biomarkers, 20 149
–156
(2015). http://dx.doi.org/10.3109/1354750X.2015.1040840 Google Scholar
K. Owen and A. Farooq,
“A calibration-free ammonia breath sensor using a quantum cascade laser with WMS 2f/1f,”
Appl. Phys. B, 116 371
–383
(2014). http://dx.doi.org/10.1007/s00340-013-5701-1 Google Scholar
F. M. Schmidt et al.,
“Ammonia in breath and emitted from skin,”
J. Breath Res., 7 017109
(2013). http://dx.doi.org/10.1088/1752-7155/7/1/017109 Google Scholar
T. Hibbard and A. J. Killard,
“Breath ammonia levels in a normal human population study as determined by photoacoustic laser spectroscopy,”
J. Breath Res., 5 037101
(2011). http://dx.doi.org/10.1088/1752-7155/5/3/037101 Google Scholar
B. Enderby et al.,
“Concentrations of some metabolites in the breath of healthy children aged 7–18 years measured using selected ion flow tube mass spectrometry (SIFT-MS),”
J. Breath Res., 3 036001
(2009). http://dx.doi.org/10.1088/1752-7155/3/3/036001 Google Scholar
G. Neri et al.,
“Real-time monitoring of breath ammonia during haemodialysis: use of ion mobility spectrometry (IMS) and cavity ring-down spectroscopy (CRDS) techniques,”
Nephrol. Dial. Transplant, 27 2945
–2952
(2012). http://dx.doi.org/10.1093/ndt/gfr738 NDTREA Google Scholar
L. R. Narasimhan, W. Goodman and C. K. N. Patel,
“Correlation of breath ammonia with blood urea nitrogen and creatinine during hemodialysis,”
Proc. Natl. Acad. Sci. U. S. A., 98 4617
–4621
(2001). http://dx.doi.org/10.1073/pnas.071057598 Google Scholar
N. T. Brannelly, J. P. Hamilton-Shield and A. J. Killard,
“The measurement of ammonia in human breath and its potential in clinical diagnostics,”
Crit. Rev. Anal. Chem.,
(2016). http://dx.doi.org/10.1080/10408347.2016.1153949 CCACBB 1040-8347 Google Scholar
S. J. Davies, P. Spanel and D. Smith,
“Breath analysis of ammonia, volatile organic compounds and deuterated water vapor in chronic kidney disease and during dialysis,”
Bioanalysis, 6 843
–857
(2014). http://dx.doi.org/10.4155/bio.14.26 Google Scholar
I. Bayrakli and H. Akman,
“Ultrasensitive, real-time analysis of biomarkers in breath using tunable external cavity laser and off-axis cavity-enhanced absorption spectroscopy,”
J. Biomed. Opt., 20 037001
(2015). http://dx.doi.org/10.1117/1.JBO.20.3.037001 JBOPFO 1083-3668 Google Scholar
I. Bayrakli,
“External cavity diode laser-based off-axis cavity enhanced absorption spectroscopy in the spectral range between 1000 nm and 1620 nm for trace gas measurements,”
J. Near Infrared Spectrosc., 23 237
–243
(2015). http://dx.doi.org/10.1255/jnirs.1173 Google Scholar
M. E. Webber, D. S. Baer and R. K. Hanson,
“Ammonia monitoring near with diode-laser absorption sensors,”
Appl. Opt., 40 2031
–2042
(2001). http://dx.doi.org/10.1364/AO.40.002031 APOPAI 0003-6935 Google Scholar
M. J. Thorpe et al.,
“Cavity-enhanced optical frequency comb spectroscopy: application to human breath analysis,”
Opt. Express, 16 2387
–2397
(2008). http://dx.doi.org/10.1364/OE.16.002387 OPEXFF 1094-4087 Google Scholar
C. Wang, A. Mbi and M. Shepherd,
“A study on breath acetone in diabetic patients using a cavity ringdown breath analyzer: exploring correlations of breath acetone with blood glucose and glycohemoglobin A1C,”
IEEE Sensors J., 10 54
–63
(2010). http://dx.doi.org/10.1109/JSEN.2009.2035730 Google Scholar
O. Vaittinen et al.,
“Adsorption of ammonia on treated stainless steel and polymer surfaces,”
Appl. Phys. B, 115 185
–196
(2014). http://dx.doi.org/10.1007/s00340-013-5590-3 MEDIAV 0025-7974 Google Scholar
L. S. Rothman et al.,
“The HITRAN molecular spectroscopic database and HAWKS (HITRAN atmospheric workstation): 1996 edition,”
J. Quantum Spectrosc. Radiat. Transfer, 60 665
–710
(1998). http://dx.doi.org/10.1016/S0022-4073(98)00078-8 Google Scholar
J. Huh, D. Yi and B. Gam, Korea Traditional Medicine Book, Nae Yi Won, Seoul, Korea
(1613). Google Scholar
T. H. Risby and S. F. Solga,
“Current status of clinical breath analysis,”
Appl. Phys. B, 85 421
–426
(2006). http://dx.doi.org/10.1007/s00340-006-2280-4 Google Scholar
W. Cao and Y. Duan,
“Current status of methods and techniques for breath analysis,”
Crit. Rev. Anal. Chem., 37 3
–13
(2007). http://dx.doi.org/10.1080/10408340600976499 CCACBB 1040-8347 Google Scholar
, “What is eGFR?,”
(2016) http://www.kidneyfund.org/prevention/tests-for-kidney-health/egfr-test.html Google Scholar
T. Wang et al.,
“Analysis of breath, exhaled via the mouth and nose, and the air in the oral cavity,”
J. Breath Res., 2 037013
(2008). http://dx.doi.org/10.1088/1752-7155/2/3/037013 Google Scholar
D. Smith et al.,
“A selected ion flow tube mass spectrometry study of ammonia in mouth- and nose-exhaled breath and in the oral cavity,”
Rapid Commun. Mass Spectrom., 22 783
–789
(2008). http://dx.doi.org/10.1002/(ISSN)1097-0231 RCMSEF 0951-4198 Google Scholar
W. Chen et al.,
“The origin of mouth-exhaled ammonia,”
J. Breath Res., 8 036003
(2014). http://dx.doi.org/10.1088/1752-7155/8/3/036003 Google Scholar
E. M. Cardoso et al.,
“Assessment of salivary urea as a less invasive alternative to serum determinations,”
Scand. J. Clin. Lab. Invest., 69 330
–334
(2009). http://dx.doi.org/10.1080/00365510802588076 SJCLAY 0036-5513 Google Scholar
T. Akai et al.,
“Salivary urea nitrogen as an index to renal function: a test-strip method,”
Clin Chem., 29 1825
–1827
(1983). Google Scholar
K. T. Sein and G. Arumainayagam,
“Correlation between serum urea and salivary urea,”
Clin Chem., 33 2303
–2304
(1987). Google Scholar
M. E. Zuniga et al.,
“Validation of the salivary urea test as a method to diagnose chronic kidney disease,”
J. Nephrol., 25 431
–436
(2012). http://dx.doi.org/10.5301/jn.5000022 Google Scholar
M. Imran et al.,
“Is blood ammonia influenced by kidney function? A prospective study,”
Clin. Biochem., 45 363
–365
(2012). http://dx.doi.org/10.1016/j.clinbiochem.2011.12.015 Google Scholar
J. M. Berg, J. L. Tymoczko and L. Stryer,
“Protein turnover and amino acid catabolism,”
Biochemistry, 633
–659
(2002). Google Scholar
D. Haussinger et al.,
“Hepatic encephalopathy in chronic liver disease, a clinical manifestation of astrocyte swelling and low-grade cerebral edema,”
J. Hepatol., 32 1035
–1038 2000). http://dx.doi.org/10.1016/S0168-8278(00)80110-5 Google Scholar
Y. L. Tseng et al.,
“Risk factors of hyperammonemia in patients with epilepsy under valproic acid therapy,”
Medicine, 93 e66
(2014). http://dx.doi.org/10.1097/MD.0000000000000066 Google Scholar
A. V. Chicharro, A. J. de Marinis and A. M. Kanner,
“The measurement of ammonia blood levels in patients taking valproic acid: looking for problems where they do not exist,”
Epilepsy Behav., 11 361
–366
(2007). http://dx.doi.org/10.1016/j.yebeh.2007.06.015 Google Scholar
BiographyIsmail Bayrakli is an assistant professor at Suleyman Demirel University. He received his MSc degree in 2005 and PhD in physics in 2008 from the Technical University of Berlin and Humboldt University, Berlin, Germany. His research interests include tunable single- and double-mode diode lasers, ultrasensitive and ultraresolution laser-based biomedical sensors, and breath analysis. Aysenur Turkmen received her BSc degree in electronic and telecommunication engineering from Suleyman Demirel University in 2013. Since 2013, she has been an MSc student at Suleyman Demirel University. Hatice Akman is a research assistant at Suleyman Demirel University. She received her MSc degree in electronic and telecommunication engineering from Suleyman Demirel University in 2011. Since 2012, she has been a PhD student at Suleyman Demirel University. |
||||||||||||||||||||||||||||||||||||||||||||||||||||||||||||||||||||||||