
|
|
1.IntroductionIn the field of biomedical imaging, the application of high-resolution, noninvasive techniques is crucial. Photoacoustic imaging (PAI), often also called optoacoustic imaging, fulfills these requirements and the method has already found widespread application in preclinical research.1–7 It provides images with high optical contrast and acoustic resolution in a range extending to 5 cm subcutaneously.8 The contrast of a PA image is dependent on the optical, mainly the absorption properties of the object under investigation. Since blood is the prominent intrinsic absorber in the visible and near-infrared spectral range (absorption coefficient on the order of for green light9), PAI is a well-suited technique for imaging the vasculature. Using multispectral excitation, functional properties such as blood oxygenation can also be examined, taking advantage of the change of the hemoglobin absorption spectrum with oxygen saturation.10 Since PAI is based on the detection of acoustic waves, its combination with ultrasound (US) techniques is straightforward. The contrast of a pulse-echo US image is based on the varying echogenicity among different tissue components. Echogenicity is determined by tissue mechanical properties, since it refers to diffuse echoes that are caused by local density and compressibility variations. Usually the B-mode images are shown where the anatomical or diagnostic information is mostly retrieved from the speckle pattern statistics. In US transmission imaging, rather than the detection of backscattered signals, the information contained in the transmitted sound wave is used for image formation. This method is often used to obtain quantitative information about the speed-of-sound (SOS) distribution within the object or to create attenuation maps. Methods have been proposed, e.g., by Jaeger et al.,11 for deriving the SOS distribution using pulse-echo sonography. However, a more direct way of obtaining physical quantities such as SOS or attenuation is the collection of the transmitted rather than the backscattered part of the incoming acoustic wave. Thus, most often, both modalities are required to obtain full information about the acoustic properties of an object. Due to the different contrast mechanisms of PA and US imaging, the information content can be increased compared with a single modality by combining the two methods. To be able to take advantage of the complementary image contrast, it is important that the images are coregistered. US pulse-echo images can then, for example, help in the interpretation of PA images by adding missing tissue boundaries, thereby facilitating the identification of structures from their location. In the reconstruction of PA images, often a constant SOS is assumed, which may limit the maximum achievable resolution.12,13 The resulting blurring artifacts can be corrected by implementing the SOS data from US transmission imaging in the reconstruction. In the same way, the quality of the US pulse-echo images can also be improved using the known SOS heterogeneities. There are different approaches for the implementation of combined PA and US imaging techniques. A rather straightforward method is to add illumination equipment for PA excitation to an existing US imaging device.14–17 Here, common piezoelectric US transducers are used for the generation and the detection of sound waves. Another possibility is the laser-US (LUS) method, where PA US excitation is used for the generation of the incoming sound waves, facilitating simultaneous dual-mode PA and US imaging. Manohar et al.18 and Resink et al.19 used the same light source for PA and US excitations by placing external absorbing targets in the path of the illuminating laser pulses. LUS waves generated at these absorbers traversed the sample and were detected by an array of piezoelectric sensors, together with photoacoustically excited sound waves from inside the sample. Anis et al.20 also presented a setup for combined optoacoustic and LUS imaging. The incoming sound waves were generated at point-like optical absorbers that were located opposite to the piezoelectric array to obtain data for SOS tomography. Piezoelectric devices are usually optimized for US imaging and work at typical diagnostic frequencies between 2 and 15 MHz and narrow bandwidth, thus limiting the spatial resolution to about . They are, therefore, not ideal for gathering thermoelastically excited sound waves that exhibit very broad bandwidths. Among other specialized devices, optical sensors have proven to be ideally suited for the detection of PA sound waves.21–23 In a previous work, we presented simultaneous PA and LUS pulse-echo tomography using a free-beam Mach–Zehnder interferometer for US detection.24 In addition to its broad bandwidth, another big advantage of this detector is its transparency for traversing sound waves. This feature enables hybrid PA and LUS section imaging by adding an additional acoustic reflector as proposed by Nuster et al.25 The surface of this cylindrical mirror is covered with a light-absorbing layer, where focused sound waves are generated upon illumination. Although the combination of PA and LUS pulse-echo imaging provided the expected features of complementary contrast and enhanced detectability of tissue structures, it lacked the possibility to quantify SOS heterogeneities. Therefore, we extend our previous work in the current study to a trimodality all-optical PA, LUS pulse-echo, and SOS section imaging setup, where detection and generation of sound waves are done purely optically. An array of absorbers acts as LUS sources for SOS imaging and the Mach–Zehnder interferometer acts as an integrating line detector for the transmitted signals. Furthermore, we propose a modified inverse Radon transform for the reconstruction of PA and LUS pulse-echo images in the presence of the known SOS distribution. In the following, a detailed description of the experimental setup including its characterization and an explanation of the reconstruction algorithms is given. The performance is tested in experiments on tissue mimicking phantoms, where the resolution and the sensitivity of the SOS imaging setup are also determined. Finally, the phantom images are used to compare a reconstruction assuming constant SOS with the modified reconstruction that uses SOS images obtained from US transmission data. 2.MethodsA setup for the acquisition of coregistered PA and US section images is presented. It can be regarded as an upgrade of a previously reported setup for hybrid PA and US section imaging with optical US detection proposed by Nuster et al.25 A method was described for simultaneous PA and pulse-echo US section imaging using focused detection. We extended this setup by adding US transmission imaging for the determination of the SOS distribution within the investigated object. The incoming US waves for this imaging mode are generated photoacoustically at absorbing targets outside the object, using part of the same laser pulse for illumination of the sample.26 With a special arrangement of these targets, signals for all three imaging modalities can be acquired with the same detector. 2.1.Experimental SetupA scheme of the measurement setup is shown in Fig. 1. Fig. 1Illustration (top view) of the experimental setup for combined pulse-echo, transmission laser-US, and PAI. R: cylindrical acoustic mirror and PA source for pulse-echo US imaging, sa: sample, abs: external absorbers for SOS imaging, CL: cylindrical lenses, L: lenses, : distance between reflector and detector, : distance between sample and detector, : distance between sample and reflector, : diameter of the sample, and : distance between closest external absorber and detector. 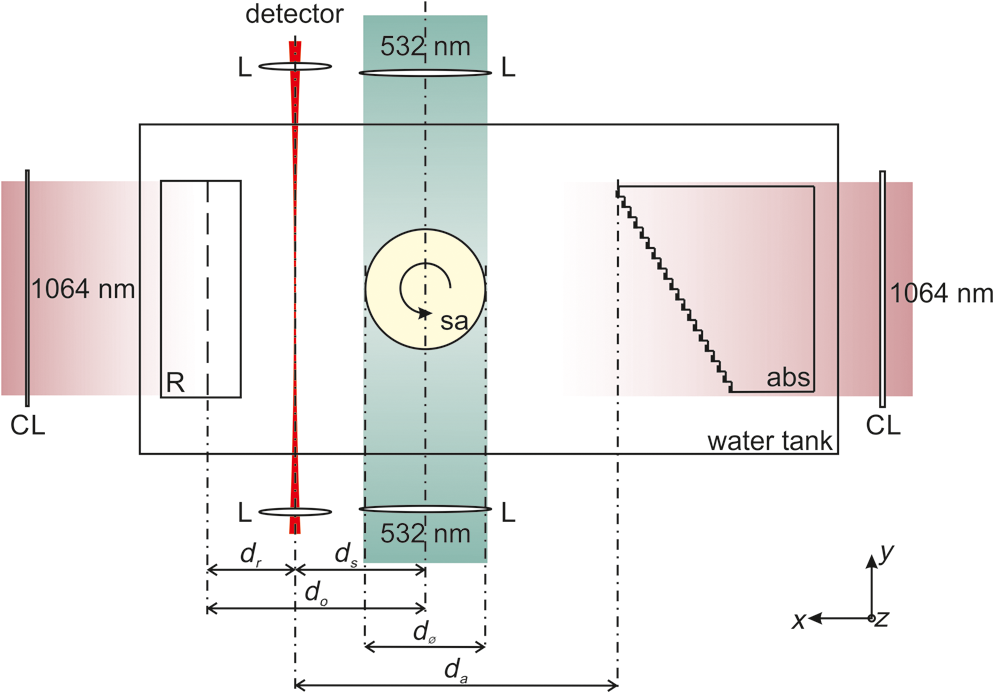 For the propagation of US waves, water was used as a coupling medium. Thus the sample, the detector, and the external absorbers were placed in a water tank. The detector was a laser beam, which was one branch of a Mach–Zehnder interferometer.22 A pressure wave intersecting the detection beam locally changed the refractive index of water, thereby causing a change in the optical path length. Behind the water tank, the sensing beam and the reference beam, which was guided outside the water bath, were brought to interference and an amplitude modulation proportional to the optical phase shift was then measured using a balanced photodetector. The temporal resolution of the line detector is limited by the diameter of the detection beam,22,27 thus a convex lens was used for forming a beam waist with a minimum diameter of about in the center of the water tank. Near-infrared light pulses with 1064-nm wavelength and 10-ns pulse duration were emitted by an Nd:YAG-laser system with a repetition rate of 10 Hz. A part of the pulse energy was coupled into two optical fibers with a 1-mm core diameter and was used for the illumination of optical absorbers located outside the imaging object for PA generation of broadband US pulses. For SOS imaging, one of these 1-mm fibers guided light to 20 external absorbers that served as sources for US waves traversing the sample. The pulse energy exiting the fiber was about 16 mJ. Each of the absorbing targets was arranged at a different distance to the detector in such a way that the detected US signals could be assigned to the corresponding sources due to their different times of flight. This was achieved using a cascaded transparent polymer substrate having a step width of 2 mm and a step height of 1 mm. An approximately 1-mm broad line of black acrylic paint was centered on each step, serving as the absorbing target for sound generation. The step height divided by the temperature-dependent SOS in water determined the time delay between two subsequently arriving signals, which was about 700 ns. Illumination of this staircase-shaped absorber with a single laser pulse resulted in the emission of a burst of 20 US waves, each of them traversing the sample along a different path. The -distance (along the direction of the detection laser beam) between two neighboring paths was given by the step width of the polymer substrate. For a less pixelated image, the sample was moved in the -direction by fractions of the step width in order to increase the effective number of absorber positions. For line-shaped illumination, a cylindrical lens (CL) was used to focus the light onto a narrow area of the absorbers with a width in the -direction of about 1 mm. Thus, the US sources were each about in size giving a good signal-to-noise ratio of the received signals. As these sources were oriented parallel to the integrating line sensor, their finite size did not affect the bandwidth of the recorded acoustic waves. Moreover, the relatively large size of the absorbers limited diffraction effects of the US waves at their source leading to a more directional propagation.26 Since the lateral spreading due to diffraction increases with distance, the spacing between the closest absorber and the detector was minimized (). For pulse-echo US imaging, the curved surface of a plano-concave cylindrical glass lens was coated with a 100-nm chromium layer and served as absorber for the PA generation of the insonifying US pulses. NIR light coming from the second optical fiber was used for illumination. The radius of curvature of the lens was 25 mm and its dimensions in the - and -directions (vertical direction) were 50 and 25 mm, respectively. The depth of the generated focused acoustic field is governed by the numerical aperture (NA) of the CL.25 Optimal focusing properties of the generated ultrasonic waves were achieved by placing a horizontal slit with a 5-mm width to the back of the absorber, giving an NA of 0.1. The light leaving the fiber was collimated with a CL. Another CL with different focal lengths was used to focus the light and narrow the illumination spot to the area of the slit (). At the same time, the concave surface of the cylindrical glass lens acted as an acoustic mirror for collecting the arriving US waves and focusing them onto the line detector. When the distances between the reflector and the detector () and the sample and the reflector () fulfill the mirror equation: , where is the focusing length of the mirror equaling half its radius, the detection is focused into a selected slice of the sample. PA signals were generated within the sample by illuminating it with another part of the same laser pulse as used for illumination of the external absorbers. The NIR-light pulses were frequency doubled to 532 nm and were coupled into a bifurcated fiber bundle with two line-shaped end faces, having areas of . These end faces were then imaged onto the surface of the sample with collecting lenses. Separation between PA signals emitted by the sample and backscattered US signals was possible due to their different arrival times. This allowed them to be measured simultaneously. The current setup was designed for objects with diameters of 16 mm or less. A detailed description of the formation of PA and pulse-echo LUS section images with the help of a concave acoustic mirror is given by Nuster et al.25 For all imaging modalities, the complete image can only be reconstructed upon gathering data from many different views. For this reason, the sample was mounted on a rotation stage, which allowed a full rotation about the -axis with 0.9 deg increments during the measurements. For SOS imaging, the sample was moved in the -direction with an increment of after a full sample rotation and the measurement was started again. This procedure was repeated three times, so the total number of sources for US transmission imaging was increased from 20 to 80 with a distance of from each other. To avoid an overlap between the SOS and pulse-echo LUS signals, the data for the SOS image had to be measured in a separate experiment with the same setup while blocking the illumination beams for the LUS and PA modes. 2.2.Data Processing and Image Reconstruction2.2.1.Reconstruction of the speed-of-sound distributionIn an acoustically homogeneous medium, acoustic waves propagate at constant speed. Therefore, when no object is present in their path, the arrival times of the generated undistorted US signals can be determined. When the pressure waves traverse regions with higher (lower) SOS on their way to the sensor they accelerate (decelerate), thus arriving at the detector sooner (later) compared with the undisturbed signals. The deviation of the time-of-flight (TOF) between waves travelling at constant speed and those covering the same distance with varying SOS thus contains information of the present SOS inhomogeneities. For the reference measurement in water, the TOF of the US waves emitted by the absorbers was determined with the sample removed. For the signals generated by one absorber at a certain distance to the detector, the shift between the arrival times of the disturbed wave compared with that traveling with constant speed is given by where is the arrival time of the undistorted wave and that of the wave traversing the sample. Equation (1) can also be expressed in terms of the line integrals of the inverse SOS (or slowness): with as the propagated path, the SOS at position , and the SOS in water.According to Snell’s law, the acoustic wave is refracted when entering a medium with different SOSs. Thus, rather than being a straight ray, is bent in the presence of an interface, which has an effect on the arrival time of the distorted wave. However, for small SOS variations of about 10% or less and for the small propagation distances occurring in the given setup, it can be assumed that the acoustic waves only minimally change their direction during propagation and refraction can be neglected.13 Moreover, it has been shown that the SOS in tissues depends only very weakly on the frequency and thus for most practical applications, dispersion can be neglected as well.28 Thus, for this reconstruction, we use a straight ray approximation similar to the procedure proposed by Jin and Wang.29 In weakly refractive tissues, can be linearized to , which is the (straight) reference ray in the homogeneous medium and Eq. (2) becomes Since is assumed to be a straight line, Eq. (3) represents a linear relationship between and the difference in the slowness with and without the sample being submerged in water.The measurement of can now be used to reconstruct the SOS image in the following way. With the help of the Mach–Zehnder interferometer, after each laser pulse, 20 (and after shifting the target 80) individual time delay values are collected along the detection beam. For a complete reconstruction of the SOS image, data must be gathered from many different views. For this reason, the sample is rotated around an axis parallel to with an angular increment of 0.9 deg. At each -position, this gives a set of time delays as a function of position along the detection beam and of rotation angle, representing a Radon transform of the slowness difference. The reconstruction of the SOS distribution requires an inverse Radon transform applied to the data. The slowness of water is added to the result, yielding and finally . 2.2.2.Photoacoustic and ultrasound image reconstructionFor the image reconstruction in the photoacoustic tomography and US modes in the presence of SOS heterogeneity, we used two approaches: The first one is a reconstruction that assumes a constant average SOS with a value that is optimized for image resolution. In this reconstruction, the acoustic signal from a small object (e.g., a small blood vessel or a point-like absorber inserted in the sample) was analyzed in the data obtained during a full rotation of the sample. Due to the line-shaped integrating detector, the arrival time of this signal follows a sinusoidal function. The symmetry line of this sine function gives the propagation time from the rotation axis to the line detector. In the presence of SOS variations, this time is the traveling distance of waves from the rotation axis to the detector (via the reflector) divided by the average SOS. For US imaging, it is the distance from the emitting absorber to the rotation axis and back to the detector. To reconstruct a section image, the signals are time shifted by , followed by a two-dimensional (2-D) inverse Radon transform. The second approach takes into account the spatial variations of SOS obtained from the US transmission measurement. Again, a straight ray approximation is used. The difference to the first approach is that the signals at a given time are not backprojected to a line parallel to the detector as in the standard inverse Radon transform, but rather to a line with constant TOF. These iso-TOF lines are calculated from the measured SOS distribution and deviate more or less from straight lines as shown in Fig. 2. Fig. 2Schematic depicting the occurrence of bent iso-TOF lines in the presence of SOS inhomogeneities.  A similar reconstruction has been used for point-like detectors, where signals are backprojected to surfaces with constant TOF, deviating from the spherical surfaces in the constant SOS case.13 The PA image is reconstructed from the recorded pressure signals measured at line orientations (see Fig. 2). Applying a Hilbert transform yields a filtered set of signals, . At a given point , the filtered signals at appropriate time delays are summed up to give the reconstructed value, . The time delays are the TOF values to the line detector at all rotation angles: where is the TOF given by is the distance from the line detector to the rotation axis. The TOF is calculated in the coordinate system of the detector, which is related to the Cartesian coordinates of the reconstruction byFor reconstruction of the US pulse-echo image, essentially the same algorithm is used, but it has to be taken into account that a wave scattered at a point in the object has to cross the SOS distribution between detector and this point twice. 2.3.Characterization of the SetupThe setup for dual-mode PA and pulse-echo US section imaging has already been carefully characterized by Nuster et al.25 For the dual-mode measurements shown here, only minor changes were made compared with this earlier work. We adjusted the imaging and object distances in a way that they allowed for measurements of objects having a diameter of about 16 mm (, ). Here, we focus on the characterization of the setup for US transmission imaging as this represents the new part of the work. With the chosen distances, the transmitted US signals arrive at the detector approximately at the same time as the reflected pulse-echo LUS signals; thus, the SOS and the dual-mode measurements were performed sequentially. 2.3.1.In-plane resolutionThe resolution and sensitivity were estimated using phantom measurements. For this purpose, a phantom consisting of a 20-mm cylindrical agar–milk matrix (made from a solution with 1.8 g agar and 40 ml water to which 2 ml milk was added) was built that contained cylindrical holes with different sizes, one copper wire and a black human hair. The diameters of the holes, which had circular cross sections, were 1, 2, 3, and 5 mm, and they were filled with black gelatin (1 g gelatin in 10 ml water and black ink), water to which black ink was added, transparent gelatin (same concentration as before), and rapeseed oil, respectively. The SOS of the various materials was evaluated separately by means of TOF measurements. Their values were for the agar matrix, for gelatin, for rapeseed oil, and for water. A photograph of the phantom is shown in Fig. 3(a), where the dimensions of the insets and the corresponding SOS values are also given. This configuration of materials and size distributions was chosen for determining the limit regarding the size of the reconstructed SOS distributions. As the phantom had a constant cross section in the -direction, it could be regarded as a 2-D object. Therefore, scanning in the vertical direction was not necessary and just one selected plane was imaged. For dual-mode PA and pulse-echo LUS imaging, the cylindrical sample was rotated five times and then the data were averaged prior to image reconstruction. As dual-mode and transmission imaging were performed sequentially, an inclined polymer plate was placed in front of the staircase-shaped polymer target during data acquisition of the PA and LUS signals. This way, US waves reflected at the staircase-shaped target that would arrive at the detector at the same time as the pulse-echo LUS signals traveling via the acoustic mirror were deflected away from the sensor. For SOS measurements, only the 20 external absorbers arranged in front of the sample were illuminated, the other light sources were switched off and no averaging was used. 2.3.2.Out-of-plane resolutionFor SOS section imaging, it is important to know the resolution in the -direction. To determine this out-of-plane resolution, a phantom providing a sharp transition of SOS in the -direction was fabricated. It consisted of a 16 mm scattering agar cylinder (concentration about 2 wt% in water and milk) with a 6 mm cylindrical hole that was filled up to half of its height with water (to which black ink was added) and to the rest of its height with rapeseed oil. The concentration of the agar solution was lower than that of the phantom used for determination of the in-plane resolution, thus its SOS was also lower (about ). A picture of the phantom and the SOS values of its constituents are depicted in Fig. 4(a). The -scan increment was 1 mm and the total scan length was 16 mm. At each of these 17 -positions, the sample performed four full rotations with an angular increment of 0.9 deg. Between rotations the sample was shifted relative to the absorbers by in the -direction. Fig. 4(a) Schematic of a phantom used for determining the out-of-plane resolution and the sensitivity of the SOS imaging setup. The agar cylinder had 16 mm and the central hole had 6-mm diameter. (b) Vertical cross section of a stack of obtained SOS images. The vertical and horizontal lines indicate the coordinates at which the profiles shown in (c) and (d) were calculated. (c) Vertical SOS profile for estimation of the -resolution. (d) Horizontal profile. 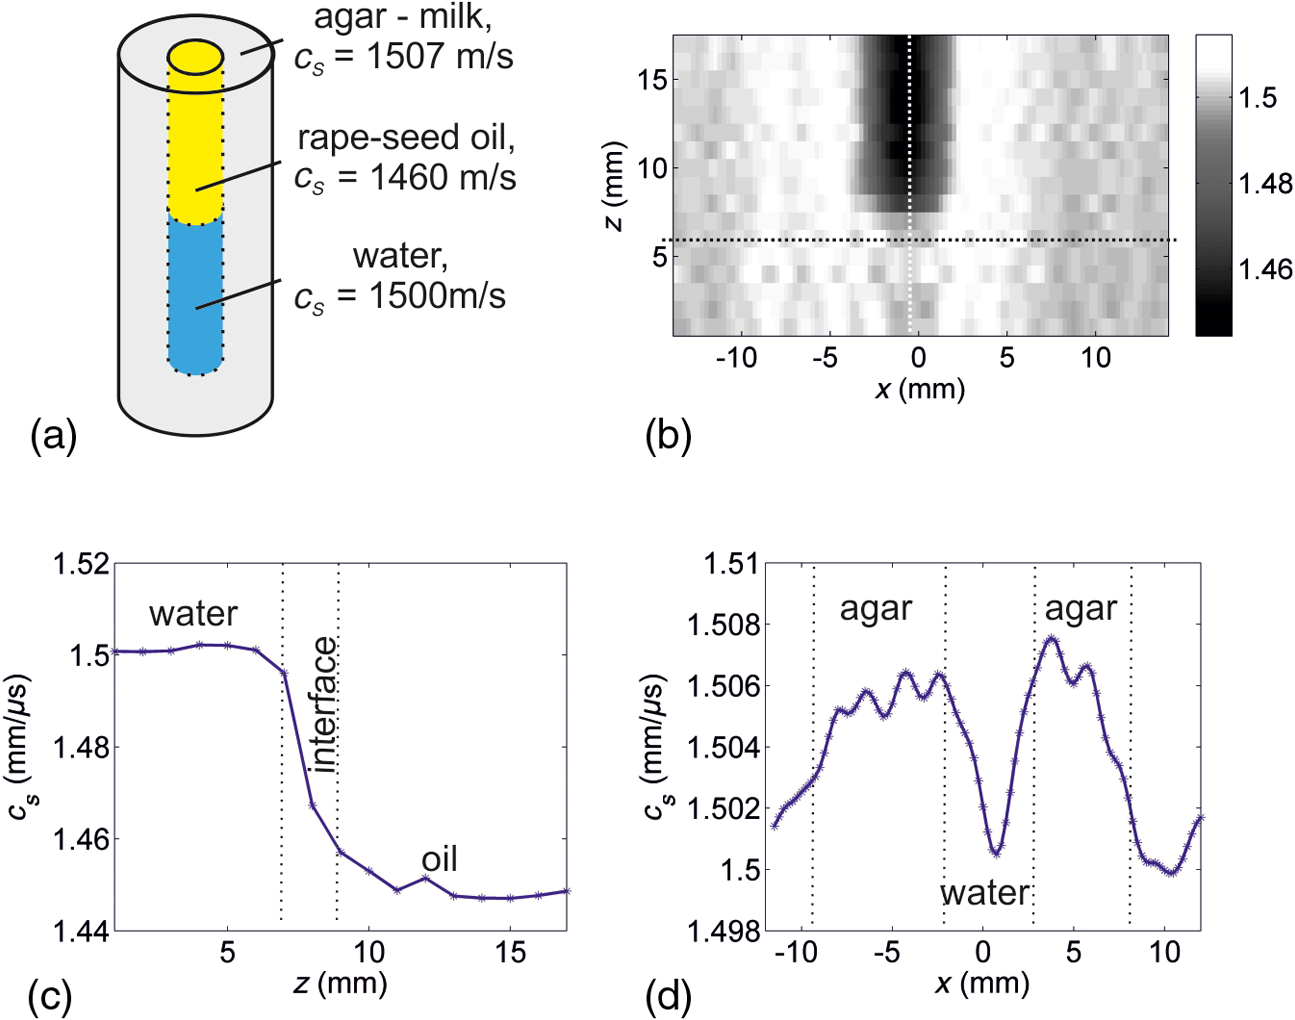 3.Results3.1.In-Plane ResolutionIn Fig. 3(b), the 1-mm inset appears bigger than it actually is and also the resulting SOS value does not correspond to the correct value of gelatin but is about too low (about 1520 compared with ). This might be due to the fact that this structure is smaller than the resolution limit of the setup. The 2-mm gelatin inset on the other hand is fully reconstructed with its correct size and SOS. Thus, it can be concluded that the actual resolution of the setup lies between 1 and 2 mm. As the interface between the agar and the oil is well defined, it should appear as a sharp edge in the case of infinite resolution. The smooth transition region appearing in the measured profile in Fig. 3(c) can be attributed to the limited resolution. From its width, a resolution of 1.8 mm can be estimated for the current setup. This value can be regarded as the width of the edge spread function of the system and was the distance required for the SOS to drop from to (90% to 10% of the SOS difference between agar and oil). 3.2.Complementary ContrastFigure 3(d) shows the fusion image of all three imaging modalities of the same phantom. It is obtained by combining the pulse-echo LUS (blue), the PA (green), and the SOS (red) information in an RGB false color image. The overlaid PA and LUS images were corrected for the SOS heterogeneity as described above. When comparing the different objects, the complementary contrast of the three imaging modalities becomes obvious. The black hair only appears in the PA image due to its strong optical absorption but is invisible in the SOS image due to its small size and also does not show up in LUS reflection mode because its acoustic properties do not differ strongly enough from that of the surrounding agar. The black water and gelatin structures also provide good contrast for PAs, while the clear gelatin, the oil, and the wire are not visible in the PA image. The copper wire with its high acoustic contrast can clearly be seen with pulse-echo LUS, but its diameter is only and thus is much below the resolution limit of the SOS imaging system. As not only the SOS of the rapeseed oil differs clearly from that of the agar, but also its acoustic impedance, the oil inset can be seen with both transmission and pulse-echo LUS imaging techniques. The transparent gelatin is visible in the SOS image only because the acoustic impedance of gelatin is very similar to that of the chosen agar–milk mixture and the sensitivity of the pulse-echo LUS system was not good enough to distinguish between these two materials. For samples like the presented phantom with many constituents exhibiting different properties, all three imaging modalities are needed to obtain the complete information. 3.3.Out-of-Plane Resolution and SensitivityFigure 4(b) shows a vertical cross section in the middle of the three-dimensional SOS distribution, which was obtained by stacking all the reconstructed section images. The transition region between water and oil is clearly visible and its width can be estimated from the vertical profile displayed in Fig. 4(c). The corresponding value was used for calculating the resolution in the -direction,30 which was about 2 mm. The phantom also provides a good model for a rough estimation of the sensitivity of the setup. The SOS difference between the agar–milk matrix and water was about . Figure 4(d) shows a profile obtained in the horizontal direction across a selected slice in the water–agar region. The profile exhibits distinguishable jumps between the expected SOS values of water and agar. Thus, it can be concluded that with the current setup SOS variations within an object of about can be easily discriminated. 4.DiscussionThe proposed setup for trimodality section imaging allows for the coregistration of images revealing the optical and acoustic contrasts of an object. The contrast mechanisms of the two LUS imaging modalities are related as the echogenicity, which provides contrast in pulse-echo US imaging, is also dependent on the SOS that is obtained by US transmission imaging. In the presented setup, the achievable resolution in pulse-echo mode is much better than in LUS transmission mode (about compared with 1.8 mm), thus many more detailed structures are observed. However, in some cases, all three techniques are needed to gather the full information of the imaging object. Strong impedance mismatches can prevent US transmission through the object, making backscattering the only mechanism for receiving imaging information about structures with acoustic contrast. In the opposite case, in a sample or a buried structure with very low echogenicity, some variations in SOS may still exist that are revealed by transmission measurements. An example is given above. The phantom designed for estimating the achievable in-plane resolution of the SOS imaging setup represents a good model where the complete information of the imaged object can only be obtained by combining all three presented imaging methods [see Fig. 3(d)]. In SOS section imaging, the resolution is primarily limited by the size of the LUS sources. This would imply a resolution on the order of 1 mm. For acquisition of signals in one plane, the distance between sources (after shifting the target) is . This oversampling cannot improve the resolution but rather leads to a smoother appearance of the SOS images. The fact that the resolution, both in-plane and out-of-plane, is about 2 mm is most likely due to the spreading of the waves by diffraction at the source and by diffraction and refraction at the object. Due to the cascaded arrangement, the distances between the absorbers and the detector increase by 1 mm per step. Without the object, therefore, a time trace contains 20 peaks which are separated by about 660 ns from each other depending on the water temperature-dependent SOS. This provides a limitation for the maximum allowed time shift of the signals in the presence of SOS inhomogeneities. Depending on the size of the object for correct results, the relative SOS difference between the sample and water must not exceed a certain value. For example, in an object having a diameter of 16 mm, the SOS should not differ by more than from water. This value increases for smaller objects. In addition to providing information about the acoustic properties of an object, knowledge of the SOS distribution can be used to improve the quality of the PA and pulse-echo LUS images when it is incorporated in the reconstruction. Without considering SOS variations, a simpler alternative is to assume a uniform SOS in the imaging object and its surroundings. It has been shown that this approach also leads to reasonably good images when an (often heuristically found) optimal average SOS value is used in the reconstruction.13 However, for high-resolution images, better results can be achieved by taking into account the varying SOS. The difference is shown in Fig. 5, where PA and pulse-echo LUS fusion images of the agar–gelatin–oil phantom reconstructed in both ways are compared. Fig. 5(a) Fusion RGB image of the PA (red) and LUS (green) section images of a phantom reconstructed using an optimized value for the SOS. (b) The same image reconstructed by taking into account the SOS distribution in the inverse Radon transform.  In Fig. 5(a), the reconstruction was performed using a constant, optimized value for that was found according to the procedure outlined in Sec. 2.2.2, and in Fig. 5(b) the adapted inverse Radon transform as described above was applied. Due to the high absorption of the black ink, the penetration depth of the green light used for PA excitation is very short, thus it is completely absorbed in a small region near the surface. As a consequence, the black water and gelatin structures appear as thin rings rather than full circles in the reconstructed image. In Fig. 5(a), where the reconstruction was performed using a single value for the SOS, not all the structures are correctly displayed. In the PA image, the edges of the 3-mm water-filled hole centered at , , for example, are blurred in the direction of the oil inclusion due to the perturbation caused by the SOS inhomogeneity. In the LUS image, the copper wire, which should appear as a point in the section image, becomes slightly stretched. This effect can be corrected by adaption of the chosen SOS value then, however, the oil structure cannot be reconstructed correctly but appears as a double ring. In this case, it is not possible to find an optimal SOS value for correct reconstruction. However, these issues can be corrected when incorporating the knowledge of the SOS distribution in the reconstruction. The results are shown in Fig. 5(b) where the blurring artifacts disappeared. 5.ConclusionThe setup described in this work uses the full potential of laser-generated US, both inside and outside the investigated object, to demonstrate trimodality section imaging. Simultaneity of PA and pulse-echo LUS imaging is achieved using the same laser pulse for excitation of PA signals inside the sample and for illumination of external absorbers for the generation of the insonifying US waves. Subsequently performed SOS imaging using LUS transmission allows for correlating the three obtained images. The US signals that have been either generated inside or that have interacted with the investigated object are gathered using a broadband interferometric detector. The obtained SOS images exhibit a resolution of less than 2 mm and are sufficiently sensitive to distinguish SOS variations of only . Moreover, including the SOS distribution in the reconstruction is used for improving the accuracy of the PA and LUS images. This is achieved using a modified inverse Radon transform, where back projection is performed along lines of constant TOF rather than straight lines. The presented setup might provide promising results in the imaging of small animals. AcknowledgmentsThis work has been supported by the Austrian Science Fund (FWF), Project No. S10502-N20. ReferencesM. H. Xu and L. V. Wang,
“Photoacoustic imaging in biomedicine,”
Rev. Sci. Instrum., 77
(4), 041101
(2006). http://dx.doi.org/10.1063/1.2195024 RSINAK 0034-6748 Google Scholar
P. Beard,
“Biomedical photoacoustic imaging,”
Interface Focus, 1
(4), 602
–631
(2011). http://dx.doi.org/10.1098/rsfs.2011.0028 Google Scholar
J. Laufer et al.,
“In vivo preclinical photoacoustic imaging of tumor vasculature development and therapy,”
J. Biomed. Opt., 17
(5), 056016
(2012). http://dx.doi.org/10.1117/1.JBO.17.5.056016 JBOPFO 1083-3668 Google Scholar
R. Ma et al.,
“Multispectral optoacoustic tomography (MSOT) scanner for whole-body small animal imaging,”
Opt. Express, 17
(24), 21414
–21426
(2009). http://dx.doi.org/10.1364/OE.17.021414 OPEXFF 1094-4087 Google Scholar
S. A. Ermilov et al.,
“3D laser optoacoustic ultrasonic imaging system for preclinical research,”
Proc. SPIE, 8581 85810N
(2013). http://dx.doi.org/10.1117/12.2008811 PSISDG 0277-786X Google Scholar
S. Manohar et al.,
“Photoacoustic mammography laboratory prototype: imaging of breast tissue phantoms,”
J. Biomed. Opt., 9
(6), 1172
–1181
(2004). http://dx.doi.org/10.1117/1.1803548 JBOPFO 1083-3668 Google Scholar
S. Manohar et al.,
“Characterization of a clinical prototype for photoacoustic mammography and some phantom studies,”
Proc. SPIE, 5697 27
(2005). http://dx.doi.org/10.1117/12.590060 PSISDG 0277-786X Google Scholar
C. Kim et al.,
“Deeply penetrating in vivo photoacoustic imaging using a clinical ultrasound array system,”
Biomed. Opt. Express, 1
(1), 278
–284
(2010). http://dx.doi.org/10.1364/BOE.1.000278 BOEICL 2156-7085 Google Scholar
A. Roggan et al.,
“Optical properties of circulating human blood in the wavelength range 400–2500 nm,”
J. Biomed. Opt., 4
(1), 36
–46
(1999). http://dx.doi.org/10.1117/1.429919 JBOPFO 1083-3668 Google Scholar
D. Faber et al.,
“Oxygen saturation-dependent absorption and scattering of blood,”
Phys. Rev. Lett., 93
(2), 028102
(2004). http://dx.doi.org/10.1103/PhysRevLett.93.028102 PRLTAO 0031-9007 Google Scholar
M. Jaeger et al.,
“Computed ultrasound tomography in echo mode for imaging speed of sound using pulse-echo sonography: proof of principle,”
Ultrasound Med. Biol., 41
(1), 235
–250
(2015). http://dx.doi.org/10.1016/j.ultrasmedbio.2014.05.019 USMBA3 0301-5629 Google Scholar
Y. Xu and L. V. Wang,
“Effects of acoustic heterogeneity in breast thermoacoustic tomography,”
IEEE Trans. Ultrason., Ferroelectr., Freq. Control, 50
(9), 1134
–1146
(2003). http://dx.doi.org/10.1109/TUFFC.2003.1235325 Google Scholar
X. L. Dean-Ben, V. Ntziachristos and D. Razansky,
“Effects of small variations of speed of sound in optoacoustic tomographic imaging,”
Med. Phys., 41
(7), 073301
(2014). http://dx.doi.org/10.1118/1.4875691 MPHYA6 0094-2405 Google Scholar
J. J. Niederhauser et al.,
“Combined ultrasound and optoacoustic system for real-time high-contrast vascular imaging in vivo,”
IEEE Trans. Med. Imaging, 24
(4), 436
–440
(2005). http://dx.doi.org/10.1109/TMI.2004.843199 ITMID4 0278-0062 Google Scholar
R. G. M. Kolkman et al.,
“Real-time in vivo photoacoustic and ultrasound imaging,”
J. Biomed. Opt., 13
(5), 050510
(2008). http://dx.doi.org/10.1117/1.3005421 JBOPFO 1083-3668 Google Scholar
A. Aguirre et al.,
“Coregistered three-dimensional ultrasound and photoacoustic imaging system for ovarian tissue characterization,”
J. Biomed. Opt., 14
(5), 054014
(2009). http://dx.doi.org/10.1117/1.3233916 JBOPFO 1083-3668 Google Scholar
M. Jaeger et al.,
“Deformation-compensated averaging for clutter reduction in epiphotoacoustic imaging in vivo,”
J. Biomed. Opt., 17
(6), 066007
(2012). http://dx.doi.org/10.1117/1.JBO.17.6.066007 JBOPFO 1083-3668 Google Scholar
S. Manohar et al.,
“Concomitant speed-of-sound tomography in photoacoustic imaging,”
Appl. Phys. Lett., 91
(13), 131911
(2007). http://dx.doi.org/10.1063/1.2789689 APPLAB 0003-6951 Google Scholar
S. Resink et al.,
“Multiple passive element enriched photoacoustic computed tomography,”
Opt. Lett., 36
(15), 2809
–2811
(2011). http://dx.doi.org/10.1364/OL.36.002809 OPLEDP 0146-9592 Google Scholar
F. Anis et al.,
“Image reconstruction and system optimization for three-dimensional speed of sound tomography using laser-induced ultrasound,”
Proc. SPIE, 8581 85814T
(2013). http://dx.doi.org/10.1117/12.2008813 PSISDG 0277-786X Google Scholar
P. C. Beard, E. Z. Zhang and B. T. Cox,
“Transparent Fabry Perot polymer film ultrasound array for backward-mode photoacoustic imaging,”
Proc. SPIE, 5320 230
(2004). http://dx.doi.org/10.1117/12.531332 PSISDG 0277-786X Google Scholar
G. Paltauf et al.,
“Photoacoustic tomography using a Mach-Zehnder interferometer as acoustic line detector,”
Appl. Opt., 46 3352
–3358
(2007). http://dx.doi.org/10.1364/AO.46.003352 APOPAI 0003-6935 Google Scholar
H. Gruen et al.,
“Three-dimensional photoacoustic imaging using fiber-based line detectors,”
J. Biomed. Opt., 15
(2), 021306
(2010). http://dx.doi.org/10.1117/1.3381186 JBOPFO 1083-3668 Google Scholar
G. Wurzinger et al.,
“Simultaneous three-dimensional photoacoustic and laser-ultrasound tomography,”
Biomed. Opt. Express, 4
(8), 1380
–1389
(2013). http://dx.doi.org/10.1364/BOE.4.001380 BOEICL 2156-7085 Google Scholar
R. Nuster et al.,
“Hybrid photoacoustic and ultrasound section imaging with optical ultrasound detection,”
J. Biophotonics, 6
(6–7), 549
–559
(2013). http://dx.doi.org/10.1002/jbio.v6.6/7 Google Scholar
G. Wurzinger et al.,
“Combined photoacoustic and speed-of-sound imaging using integrating optical detection,”
Proc. SPIE, 8943 89433L
(2014). http://dx.doi.org/10.1117/12.2041256 PSISDG 0277-786X Google Scholar
R. Nuster et al.,
“Photoacoustic microtomography using optical interferometric detection,”
J. Biomed. Opt., 15
(2), 021307
(2010). http://dx.doi.org/10.1117/1.3333547 JBOPFO 1083-3668 Google Scholar
P. N. T. Wells,
“Ultrasonic imaging of the human body,”
Rep. Prog. Phys., 62 671
–722
(1999). http://dx.doi.org/10.1088/0034-4885/62/5/201 RPPHAG 0034-4885 Google Scholar
X. Jin and L. V. Wang,
“Thermoacoustic tomography with correction for acoustic speed variations,”
Phys. Med. Biol., 51
(24), 6437
–6448
(2006). http://dx.doi.org/10.1088/0031-9155/51/24/010 PHMBA7 0031-9155 Google Scholar
J. Jose et al.,
“Passive element enriched photoacoustic computed tomography (PER PACT) for simultaneous imaging of acoustic propagation properties and light absorption,”
Opt. Express, 19
(3), 2093
–2104
(2011). http://dx.doi.org/10.1364/OE.19.002093 OPEXFF 1094-4087 Google Scholar
BiographyGerhild Wurzinger studied technical physics at the University of Technology in Graz, Austria, and at the University of Parma, Italy. Before she started her PhD at the Department of Physics at the University of Graz she worked as a scientific employee at the NanoTecCenter Weiz and in the R&D department of ACC Austria. Currently, she is concerned with the development of a combined photoacoustic and laser ultrasound imaging system. Robert Nuster received his PhD in experimental physics from the Karl-Franzens-University Graz, Austria, in 2007 with a thesis on development and application of optical sensors for laser induced ultrasound detection. From 2008 to 2011 he was a postdoctoral research fellow at the Karl-Franzens-University Graz. Since 2011 he has been a senior postdoctoral research fellow. His current research interests include photoacoustic imaging, characterization of materials by laser ultrasound and ultrasound sensor development. Guenther Paltauf received his PhD in physics from the Karl-Franzens-Universitaet Graz, Austria in 1993. After postdoctoral studies in Graz, the University of Bern, Switzerland and the Oregon Medical Laser Center in Portland, Oregon, he is now associate professor at the Department of Physics at the University of Graz. His research interests are photoacoustic imaging, laser ultrasonics and photomechanical laser-tissue interactions. |


