|
|
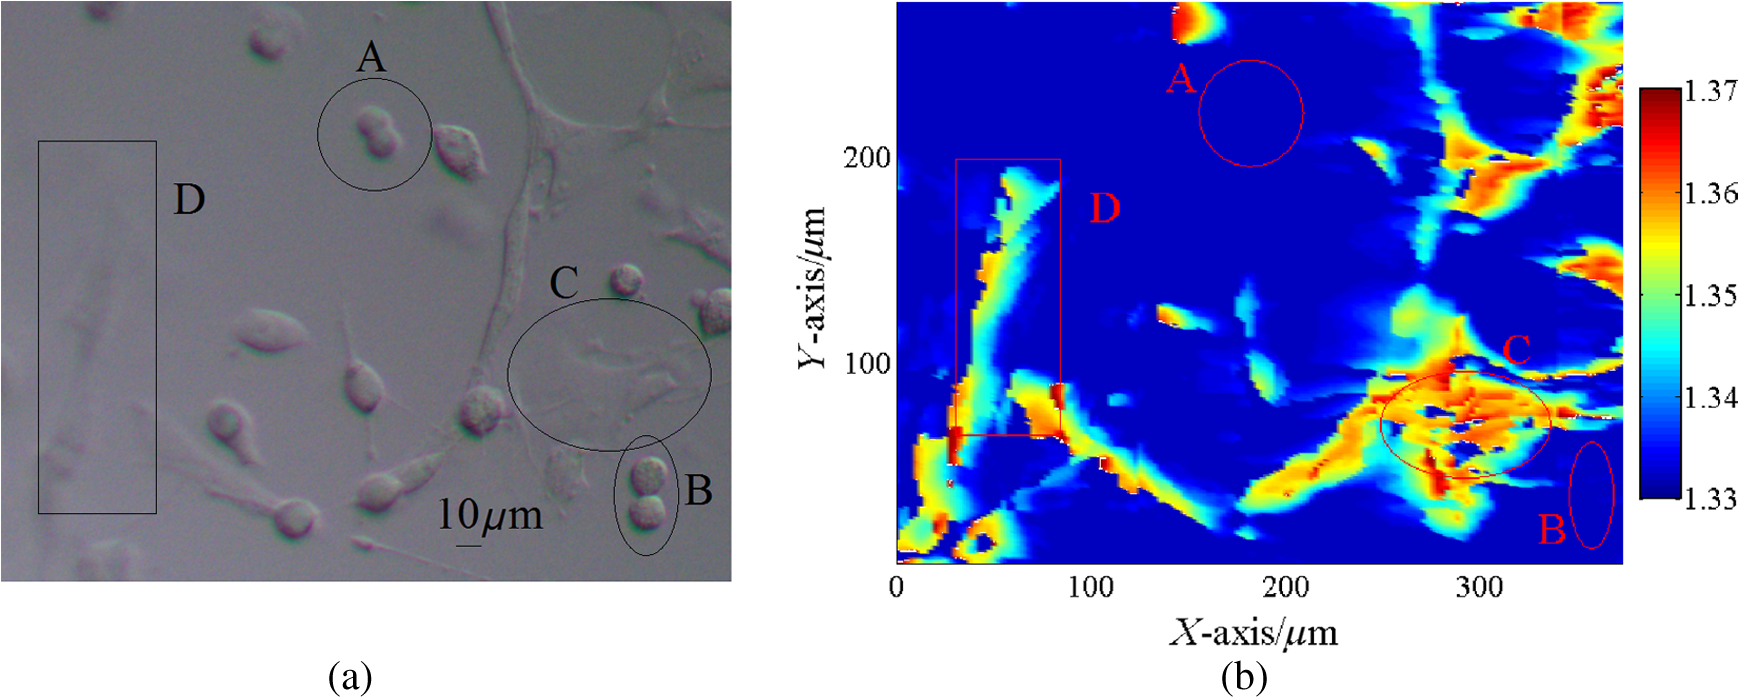
1.IntroductionIn recent years, it has been widely recognized that a better understanding of basic cellular physical characteristics, including shape, size, and refractive index (RI), is of crucial importance in biological studies, cell light scattering, laser trapping, flow cytometry, and disease diagnosis.1 RI is particularly indispensable, because such physical parameters provide fundamental information about the composition and structure of cells from a unique viewpoint. The cells are inhomogeneous, composed of protein, lipid, DNA, inorganic salt, and other constituents. A change in the proportion of each constituent inside a cell will alter its RI value. Different kinds of cells have unfamiliar appearances in size and different proportions of constituents. Parasitization by malaria-inducing Plasmodium falciparum leads to structural, biochemical, mechanical, and thereby RI distribution changes in host red blood cells.2 Giannios et al.3 compared the complex RI of tumorous and normal mucosa with a multiwavelength prism coupling refractometer. The significant index contrast between normal and diseased states indicates that RI is a potential marker of colorectal dysplasia. In these cases, the RI imaging of the cells plays the role of an effective indicator to discriminate cells, reveal cell states, and diagnose diseases. What is more, RI imaging of cells provides a label-free and nondestructive window into pathology and biological imaging.4 Current RI measurement of cells emphasizes the detection of the phase of transmission light that goes through the cell, optimizing and promoting a retrieval algorithm or reconstruction process, and determines/vanishes the influence of cell thickness. These transmission-type techniques include tomographic phase microscopy,1 spatial light interference microscopy,4 digital holographic microscopy,5,6 and phase contrast microscopy.7,8 These techniques have been developed or applied in the RI measurement of cells for about 10 years, during which period varieties of remarkable results were presented. However, many transmission-type techniques obtained RI information by measuring phase distribution indirectly. It is a result of mean cell RI combined with the thickness distribution of the cell. The indispensable cell thickness requires an extra survey method with high precision.9 What is more, almost all of the transmission-type techniques require complex retrieval algorithms or reconstruction processes. The digital holography of total internal reflection could provide the reflection phase profile from the internal change of the RI of the sample.10 Reflection interference contrast microscopy is used in the marker-free phenotyping of tumor cells.11 Berguiga et al.12 applied scanning surface plasmon microscopy (SSPM) to image living adherent cells with excellent sensitivity. For SSPM, it might be complicated to evaluate the influence of the cells and their living environment on the metal film. Furthermore, the thickness of the metal film is an important parameter in calculation; recycling use of prisms for SSPM might be troublesome after multiple surface cleanings. It is significant that little attention is paid to the reflection-type method, even though its advantage of being free from cell thickness is outstanding compared with the transmission strategies. In this paper, a typical reflection-based technique with micrometer spatial resolution named scanning focused refractive index microscopy (SFRIM) is applied in the RI imaging of cocultured cells in their living environment, aiming to provide the RI profile of inhomogeneous materials. This method is robust, simple, and easy to handle. In our previous study, SFRIM has been applied to waveguides, photochromic materials, and photorefractive materials.13 The spatial discrimination of SFRIM is significantly better than traditional reflection-based methods. The RI information is deduced with the simple derivative total internal reflection method, while the complex retrieval algorithm or reconstruction process is unnecessary. The precision of RI estimation is less than 0.002.13 Differently from the SSPM methods, a coated metal film is not needed in our apparatus. The cells are cultured directly on the prism. Both the shape and RI distribution of cells are clearly presented in the experimental results. The experimental results here prove that SFRIM is a promising tool in the field of biological optics. 2.Setup and MaterialsThe diagram setup of SFRIM for cell imaging is shown in Fig. 1(a). The detection beam from laser L (), after passing through a polarizer PO and a long-working-distance objective lens O, is focused on the horizontal interface of a trapezoidal prism P. S-polarized light is used here. The sample S is on the upper surface of the prism. P is fixed on the three-dimensional translation stages T1 (M126, Physik Instrumente, Germany). A one-dimensional linear detector (Hamamatsu S3903-512Q) D, fixed on translation stage T2 (MTS50-Z8, Thorlabs, America), moves along the -axis and records the reflected light. The pixel size of the detector is . A CCD (CCE-B013-U, Mightex, Canada) is used to record optical bright-field images of the cells and to help locate the focal point. All information is collected with Labview software. Because the detector receives part of the reflected light, spatial resolution of SFRIM is 0.8 and in horizontal directions,13 smaller than the size of the focal point. The incident angle of the focused beam varies across a range that covers the critical angle at the sample–prism interface, and the angle-dependent reflectance curve can be directly recorded by the detector. Accuracy of RI estimation is calculated to be less than 0.002.13 The scanning speed is , mainly decided by the response time of the detector. As a TIR-based technology, the penetration depth is at the wavelength level (). Fig. 1(a) Schematic diagram of SFRIM. L, laser; PO, polarizer; O, objective; S and P are sample and prism, respectively; D is the detector; T1 and T2 are translation stages. (b) Shape of the homemade culture room, including the prism, PDMS, cell, and DMEM. (c) Schematic diagram of the liquid-sealing process, which is done for the convenience of taking bright field images. P is the prism, S is the cell sample, and SL is the sealing liquid. 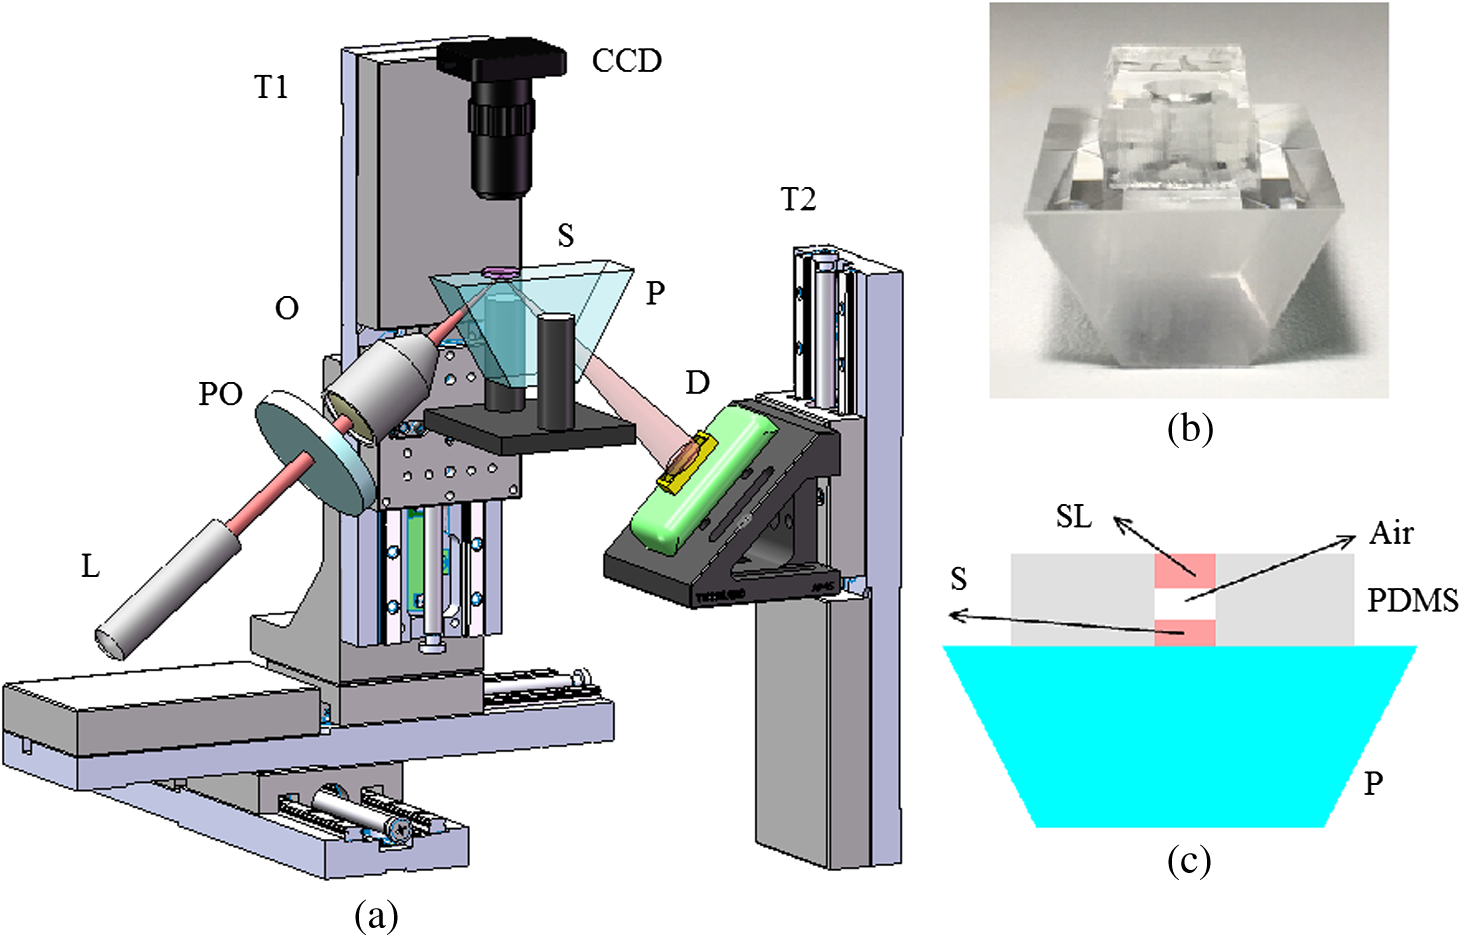 The RI values are obtained by the critical angle, above which total internal reflection occurs. For ideal nonabsorbing and nonscattering samples, an inflection point of the reflected light can be detected at the critical angle. However, a cell sample is absorbing and light scattering, which makes the critical angle difficult to determine visually using the reflectance curve. Therefore, the derivative total reflection method (DTRM) is used for better location of the critical angle. Based on the Fresnel equation, the reflectance for s-polarized light is14 where and are the RI of the prism and the incident angle, respectively. and are the intermediate variables. is the extinction coefficient, , and and are the scattering coefficient and the absorption coefficient, respectively.15 The critical angle is located at the maximum of the first derivative of Eq. (1). The above result is suitable for p-polarized light, as well.The angle-dependent reflectance curve is calculated using13 where and are the reflected light distributions of the cell sample and air, respectively, and is the intensity distribution of the background light without the incident laser. is determined using13 where denotes the pixel coordinate corresponding to the light beam with an incident angle , is the distance between adjacent pixels, is a constant distance parameter, is the base angle of the prism, and and are constant parameters. Calibration of the system should be performed to calculate and using standard samples, deionized water, and alcohol. Once is determined, the RI value of the cell can be deduced with Snell’s law14The cells are cultured in a homemade culture room [Fig. 1(b)]. First, cuboid polydimethylsiloxane (PDMS) with a size of is prepared. A hole with a diameter of 6 mm is drilled through it. Then the PDMS is put onto the prism. The PDMS will automatically closely attach to the prism. The prism and the PDMS are sterilized in alcohol beforehand. Then the cells in Dulbecco’s modified Eagle's medium (DMEM) are injected into the hole with the aid of a pipette. The volume of the injected liquid is . Four kinds of samples are prepared: sample 1, DMEM only; sample 2, mouse microglial cells in DMEM; sample 3, synovial cells in DMEM; sample 4, mouse microglial cells and synovial cells in DMEM. Last, the samples are put in an incubator with for 8 h. This is long enough for the cells to sufficiently adhere to the upper surface of the prism. All the processes are conducted in a bioclean room. The PDMS material is widely used in integrated microfluidic chip or other applications for its outstanding and unusual rheological properties.16 Combined with the external cavity laser, microlens, and microfluidic channels, the PDMS-based integrated chip is capable of determining the RI of single living cell.17,18 In contrast, our approach is simply prepared and robust. A CCD camera is located above the prism to monitor the RI imaging. The bright-field images are taken as follows: pipette DMEM, take bright-field images, and liquid-seal the sample with one layer of DMEM. In this case, a layer of air remains between the two liquid layers [Fig. 1(c)]. On the one hand, this process suppresses the effect of the DMEM on the bright-field images and improves imaging quality. On the other hand, the existence of the sealing liquid effectively prevents the evaporation of the bottom DMEM and maintains a relatively stable environment for cells. 3.Result and DiscussionThe samples are scanned at room temperature (). The RI of the DMEM is shown in Fig. 2(a). The RI value is , which proves the accuracy of SFRIM. The variation of the value is less than 0.0005, proving the precision of RI estimation by SFRIM. This result determines the background RI values of the liquid in which the cells are immersed. Fig. 2(a) RI of the DMEM. (b) Bright-field images of mouse microglial cells taken by a CCD camera. The black frame indicates the scanned area. (c) RI imaging of mouse microglial cells.  The RI imaging of sample 2 is presented in Fig. 2. The scanning time is about 2 min. The outline of the cell is determined according to the RI value compared with that of the immersion liquid. Comparing Figs. 2(a) and 2(b), the size and morphology distribution of the cell agree well with those of the bright-field images. It can be seen from the result that the size of the mouse microglial cell is about , and the cell RI varies from 1.365 to 1.345. The RI of the central part of the cell is higher than that of the edge area. This phenomenon can be explained by the fact that as a reflection-type technology, SFRIM detects the information of the prism–sample interface. The detection penetration depth toward the cell is on the order of the laser wavelength, which is less than . Once the mouse microglial cells have adhered to the prism, the central parts should contain more information about the constituents of the cell, while the DMEM should exist at the edge area, between the cell membrane and the prism. The RI imaging of the synovial cells is shown in Fig. 3 (sample 3). The RI values are in the range of 1.368 and 1.345. The synovial cells should be tiled on the upper surface of the prism with sufficient adherence. Figure 3(a) is taken before RI imaging measurement. The time interval between Figs. 3(b), 3(c), 3(e), and 3(f) is 20 min. Figure 3(d) is taken after the measurements. It should be noted that RI of the cell outlined with a red frame is decreasing, while its size is reducing at the same time. If a cell is in a dehydration state, its size will reduce. However, the RI values should be higher, since the concentration of the cytoplasm increases. A reasonable explanation is that the decrease of both RI and size represents the departure of the cell from the prism. When the mitosis process begins, the shape of the cell should return to a spherical appearance. In the period from prophase to anaphase, the cell departs the prism. Then, during the telophase, one cell is separated into two identical parts and slowly stretches back to a long striped shuttle shape. In other words, our imaging records the activity of a cell divided into two parts. The activities of a cell during one part of its cell cycle are recorded in the viewpoint of RI imaging. Fig. 3Bright-field images taken (a) before and (d) after the RI imaging measurement. (b) and (c) are the RI images of (a). (e) and (f) are the RI images of (d). (b), (c), (e), (f) are scanned successively with a time interval of 20 min. The areas A–E refer to the same cell.  The measured RI distribution of cocultured cells is shown in Fig. 4 (sample 4). An obvious phenomenon is that the morphology of the cells in the RI imaging [Fig. 4(b)] generally agrees with the bright-field images [Fig. 4(a)], apart from several detail parts. The cells in area A are selected as representative of the discrepancy. Combining the result in Fig. 3, the unseparated cells should be in the mitosis process, which departs from the prism. In such cases, the cells may not be recorded in the RI imaging, so is the cell in area B. Observe the ellipsoid and round cells in Fig. 4(a); it might be arbitrary to distinguish the ellipsoid mouse microglial cells and round synovial cells visually. However, all the round cells are “missing” in the RI imaging [Fig. 4(b)], while the ellipsoid ones are recorded clearly. One conclusion that can be drawn is that the unrecorded cells should be synovial cells in the mitosis process, while the round or ellipsoid cells are mouse microglial cells. The cells are discriminated in this manner. In addition, areas C and D in the bright-field images are vague [Fig. 4(a)]. On the contrary, the RI imaging of the same area is clear at a glance. This shows another advantage of RI imaging in biological optics. Many researchers have reported their quantitative results with different cells. In Refs. 3, 4, and 8, the phase distribution is provided, which contains both the thickness and the RI information. RI of a pollen grain immersed in glycerol is reported between 1.46 and 1.53.5 Other reported RIs of different animal cells vary between 1.36 and 1.41.1,4,6,17,18 The three-dimensional mapping of a HeLa cell shows that the RI of the inner organelle and cell nucleus is higher than that of the cytomembrane ().1 Phillips’s result shows the RI of the edge part of a red blood cell () is lower than that of the inner parts (), since the edge parts mainly contain the cytomembrane.7 In our apparatus, the RI information about the surface of the cells is recorded, and the measured values mainly vary within 1.36 and 1.37. We hypothesize that the surface mostly consists of cytomembrane and agrees well with the former reports. 4.ConclusionWe applied the SFRIM technique in the investigation of living cells. The RI imaging of cells is obtained in a reflection-based method. Shape, size, and RI distribution information of the cells are determined in a nondestructive and label-free manner. Our method is robust and direct, and free from complex retrieval algorithms or reconstruction processes. As the first TIR-based quantitative RI mapping technique, SFRIM provides a new approach to monitor RI of cells under different environments. AcknowledgmentsThe authors have no conflicts of interest to disclose. This research is supported by the Natural Science Foundation of China (Grant Nos. 61475078 and 61405097); the Science and Technology Program of Tianjin (Grant Nos. 15JCQNJC02300 and 15JCQNJC02600); the International Science & Technology Cooperation Program of China (Grant No. 2013DFA51430); and the Social Welfare Projection of the Ministry of Environmental Protection (Grant No. 201309010). ReferencesW. Choi et al.,
“Tomographic phase microscopy,”
Nat. Methods, 4
(9), 717
–719
(2006). http://dx.doi.org/10.1038/nmeth1078 1548-7091 Google Scholar
Y. K. Park et al.,
“Refractive index maps and membrane dynamics of human red blood cells parasitized by Plasmodium falciparum,”
Proc. Natl. Acad. Sci. U. S. A., 105
(37), 13730
–13735
(2008). http://dx.doi.org/10.1073/pnas.0806100105 Google Scholar
P. Giannios et al.,
“Complex refractive index of normal and malignant human colorectal tissue in the visible and near-infrared,”
J. Biophotonics,
(2016). http://dx.doi.org/10.1002/jbio.201600001 Google Scholar
Z. Wang et al.,
“Spatial light interference microscopy (SLIM),”
Opt. Express, 19
(2), 1016
–1026
(2011). http://dx.doi.org/10.1364/OE.19.001016 OPEXFF 1094-4087 Google Scholar
F. Charrière et al.,
“Cell refractive index tomography by digital holographic microscopy,”
Opt. Lett., 31
(2), 178
–180
(2006). http://dx.doi.org/10.1364/OL.31.000178 OPLEDP 0146-9592 Google Scholar
B. Rappaz et al.,
“Measurement of the integral refractive index and dynamic cell morphometry of living cells with digital holographic microscopy,”
Opt. Express., 13
(23), 9361
–9373
(2005). http://dx.doi.org/10.1364/OPEX.13.009361 OPEXFF 1094-4087 Google Scholar
K. G. Phillips, S. L. Jacques and O. J. T. McCarty,
“Measurement of single cell refractive index, dry mass, volume, and density using a transillumination microscope,”
Phys. Rev. Lett., 109
(11), 118105
(2005). http://dx.doi.org/10.1103/PhysRevLett.109.118105 Google Scholar
C. L. Curl et al.,
“Refractive index measurement in viable cells using quantitative phase-amplitude microscopy and confocal microscopy,”
Cytometry Part A, 65
(1), 88
–92
(2005). http://dx.doi.org/10.1002/(ISSN)1552-4930 Google Scholar
Y. C. Lin and C. J. Cheng,
“Determining the refractive index profile of micro-optical elements using transflective digital holographic microscopy,”
J. Opt., 12
(11), 115402
(2010). http://dx.doi.org/10.1088/2040-8978/12/11/115402 Google Scholar
III W. M. Ash and M. K. Kim,
“Digital holography of total internal reflection,”
Opt. Express, 16
(13), 9811
–9820
(2008). http://dx.doi.org/10.1364/OE.16.009811 OPEXFF 1094-4087 Google Scholar
K. Klein et al.,
“Marker-free phenotyping of tumor cells by fractal analysis of reflection interference contrast microscopy images,”
Nano Lett., 13
(11), 5474
–5479
(2013). http://dx.doi.org/10.1021/nl4030402 NALEFD 1530-6984 Google Scholar
L. Berguiga et al.,
“Time-lapse scanning surface plasmon microscopy of living adherent cells with a radially polarized beam,”
Appl. Opt., 55
(6), 1216
–1227
(2016). http://dx.doi.org/10.1364/AO.55.001216 Google Scholar
T. Q. Sun et al.,
“Scanning focused refractive-index microscopy,”
Sci. Rep., 4 5647
(2014). http://dx.doi.org/10.1038/srep05647 SRCEC3 2045-2322 Google Scholar
M. Born and E. Wolf, Principles of Optics, Pergamon, New York
(1959). Google Scholar
C. F. Bohren and D. R. Huffman, Absorption and Scattering of Light by Small Particles, John Wiley and Sons, Hoboken, New Jersey
(2008). Google Scholar
P. Zuo et al.,
“A PDMS/paper/glass hybrid microfluidic biochip integrated with aptamer-functionalized graphene oxide nano-biosensors for one-step multiplexed pathogen detection,”
Lab Chip, 13 3921
(2013). http://dx.doi.org/10.1039/c3lc50654a LCAHAM 1473-0197 Google Scholar
X. J. Lian et al.,
“Determining refractive index of single living cell using an integrated microchip,”
Sens. Actuators A, 133 349
–354
(2007). http://dx.doi.org/10.1016/j.sna.2006.06.045 Google Scholar
W. Z. Song et al.,
“Refractive index measurement of single living cells using on-chip Fabry-Pérot cavity,”
Appl. Phys. Lett., 89 203901
(2006). http://dx.doi.org/10.1063/1.2387965 APPLAB 0003-6951 Google Scholar
BiographyTeng-Qian Sun completed his bachelor’s degree in the school of physics at Nankai University, China, in June 2011. Currently, he is studying for a doctoral degree in the School of Physics at Nankai University. His PhD studies cover the refractive index microimaging of biomedical, waveguide, and nonlinear materials. He has 4 years of experience in optical imaging. Qing Ye received his PhD in optics from Nankai University, China, in 2008, then joined the School of Physics, Nankai University. Since 2010, he has been an associate professor of optics at Nankai University, specializing in optical coherence tomography, optical clearing, and optical property measurement of biotissue. Fen Hu received her PhD in biophysics in 2008, then joined the School of Physics, Nankai University, China. Her research interests include function of ion channels of biomembranes. Shi-ke Liu completed her bachelor’s degree in the School of Electrical and Information Engineering from the Harbin Institute of Technology, China, in June 2014. Currently, she is studying for a master’s degree in the School of Physics at Nankai University. Her studies cover the refractive index microimaging of biomedical and optical imaging. Xiao-Wan Wang received her bachelor’s degree from the School of Physics, Nankai University, in 2013. Currently, she is studying for a master’s degree in the School of Physics at Nankai University. Her research interests include refractive index measurement and optical imaging. Jin Wang received her master’s degree in biomedical engineering in 2007, then joined the School of Physics, Nankai University, China. She received her PhD in optics from Nankai University, China, in 2013. Her research interests include optical clearing, refractive index measurement of biotissue, and optical coherence tomography. Zhi-Chao Deng is a PhD student at Nankai University in Tianjin, China. He graduated from the School of Physics from the same university in 2011. Now he is mainly engaged in research on biomedical photonics. He has about 5 years of experience in the study of tissue refractive indexes. Jian-Chun Mei completed his master’s degree in the School of Physics at Nankai University, China, in 2010. The same year, he became an engineer and started to work in the Advanced Technology Institute, Nankai University. He is mainly engaged in research on photoelectric detection and optical instrument design. Wen-Yuan Zhou received his master’s degree and doctoral degree in 1996 and 2002, respectively. From 2003 to 2012, he worked as an associate professor at Nankai University. Since 2012, he has been a professor of optics at Nankai University. His main research topics are highly sensitive photon detection, photon imaging technology, and application of biological sensors. Chun-Ping Zhang has been a professor of physics at Nankai University since 1995. His main research topics are optical properties and applications of photochromic materials and biomedical photonics. Xin-Yu Wang received his PhD in physics from Nankai University, China, in 2002, then joined the School of Physics, Nankai University. Since 2004, he has been an associate professor of optics at Nankai University, specializing in disease-related proteins and protein function relationships. Lei-Ting Pan received his PhD in optics from Nankai University, China, in 2009, then joined the School of Physics, Nankai University. Since 2013, he has been an associate professor of optics at Nankai University, specializing in biomedical effects of light and application of advanced optical technology in biomedical research. Jian-Guo Tian received his PhD from Nankai University in 1991, then started to teach at the same university as an assistant professor. In 1995, he became a professor. Since 2001, he has been a specially appointed professor at Nankai University. He is mainly engaged in condensed matter physics and photonics involving optical nonlinear mechanisms and application of photoelectric material properties. |