
|
|
1.IntroductionGliomas are a type of brain tumor that invade the normal brain, making it difficult for a surgeon to precisely identify which tissue is cancer especially when operating close to the margins that are radiographically defined with magnetic resonance imaging (MRI). This is very important clinically because 80% of recurrences originate from residual cancer remaining after surgery.1 Moreover, due to the eloquence of brain tissue, the removal of normal brain close to the margins could have dire consequences including impairment of cognitive functions.2,3 Standard imaging techniques using MRI and intraoperative visual inspection do not detect the full extent of glioma invasion into normal brain, motivating the need for rapid invasive cancer detection during brain tumor resection. Optical techniques are seeing increased use for disease detection and surgical guidance.4 In particular, Raman spectroscopy gives molecular information at the tissue surface based on the vibrational modes of molecular species and has been used for cancer detection in a number of organs.5–10 We have previously developed a hand-held spontaneous Raman near-infrared (IR) spectroscopy probe system capable of intraoperative brain cancer detection in patients with grade 2 to 4 gliomas with sensitivity and specificity.11 During brain cancer resection procedures, the level of ambient light can usually be kept to a minimum in order to minimize its impact on optical signals obtained with instruments operating in the near-IR. However, clinical translation and routine use of surgical guidance optical systems could be facilitated by reducing their sensitivity to the effects of ambient light sources in the operating room (OR) such as OR lights, neuronavigation systems, and light from windows.12 To address this issue, we have used supervised machine learning with artificial neural networks (ANNs) to accurately distinguish cancer from normal brain tissue in vivo from Raman spectroscopy data. ANN uses a nonparametric model, which is suited for handling the inconsistent effects of light artifacts on the Raman spectra. It is able to adapt to nonlinear changes in optical signal caused by sources of lights in the OR. This improves the robustness of the Raman spectroscopy technique for brain cancer detection, making it easier to integrate into the neurosurgical workflow. Reducing the volume of residual cancer improves patient prognosis,13,14 and radiographically complete resection can help reduce the recurrence rate and increase patient survival.15,16 2.MethodsOur previous 17-patient dataset11 was used to assess the ability of ANN to distinguish cancer from normal brain tissue under the presence of light artifacts from OR sources. The Raman spectroscopy system was used at the Montreal Neurological Institute and Hospital on patients undergoing brain tumor resection for grade 2 to 4 gliomas. Informed consent was acquired for all patients, with oversight provided by the Montreal Neurological Institute ethics review board. The Raman spectroscopy system is described previously,11 consisting of a hand-held fiberoptic probe (EMVision LLC, Florida), a 785-nm excitation laser (Innovative Photonic Solutions, New Hampshire), and a high-resolution charge-coupled device spectroscopic detector (ANDOR Technology, Belfast, UK). Seven fibers are used for detection and one central fiber is used for laser excitation. The probe samples tissue with a 0.5-mm surface diameter and a sampling depth up to , with the majority of the signal coming from approximately the first 500 microns depth of tissue.11 The probe was used during surgery to measure 5 to 15 tissue locations per patient, with an emphasis placed on areas of invasive cancer toward the periphery of the tumor. Each acquisition consisted of one background measurement with the laser off, and three averaged measurements with the laser on, for a total acquisition time of 0.2 s. Neuronavigation tracking was performed for each measurement using a StealthStation (Medtronic, Minnesota), to colocate the measurements on preoperative MRI. Biopsy samples were taken superficially at each location for neuropathology assessment based on hematoxylin and eosin staining. Sources of light in the OR include the neurosurgical microscope, which provides a white light source as well as a blue light source typically used for fluorescence detection (OPMI Pentero, Zeiss, Germany), the IR source of the tracking unit for the neuronavigation system (StealthStation, Medtronic, Minnesota), and the overhead surgical lights (Model 380, Dr Mach, Germany), hereafter referred to as OR lights. Note however that for all of the acquired in vivo spectra, the light on the neurosurgical microscope was turned off. MATLAB® (Mathworks, Inc.) was used for analysis. All spectra, with or without ambient OR light sources, were preprocessed using background subtraction (laser off) to minimize the impact of ambient light contributions, for normalization by laser power, and for autofluorescence removal based on an iterative polynomial fit.17 Tissue classification based on Raman spectra was performed using feedforward ANN, a supervised machine learning technique inspired by the function of biological neurons.18 ANN constructs a network consisting of layers of neurons, where each neuron in one layer is connected to each neuron in the next layer (Fig. 1). The neurons in the first layer are also connected to the input data (Raman spectra), and the neurons in the last layer are connected to the output, in this case determining the tissue type as cancer or normal brain. Connections between neurons have weights, which are learned based on training data using backpropagation. Each neuron also applies a transfer function to the weighted sum of inputs, which is what makes ANN able to model complex nonlinear interactions if the transfer function is nonlinear. Once the ANN model is trained using known data, it can be used to predict classes (tissue types) for test data. The Neural Network Toolbox in MATLAB® 2016a was used for ANN classification, using the “feedforwardnet” functionality. The ANN was created with 30 total neurons in the hidden layers: 20 neurons in the first hidden layer and 10 neurons in the second hidden layer. The number of neurons and layers in a network control the complexity of the model and optimizing these parameters is essential; too many neurons and/or layers may cause overfitting to the training data, while too few may lack sufficient complexity to distinguish spectrally distributed differences between tissues. More than one layer also allows the model to assess different levels of detail in the data (narrow versus wide peaks for instance). In practice, these parameters can be chosen using optimization functions such as grid search (used for this data), random search, or genetic algorithms. The tangent sigmoidal transfer function was used for both hidden layers and a linear transfer function was used for the output layer. Levenberg–Marquardt backpropagation was used to train the network weights. The choice of transfer function and training method determines network training properties (training speed, robustness to noise, and so on) as well as what the network is able to model. We have chosen default parameters that allow us to model nonlinear effects, but there are a variety of different transfer functions (linear, log-sigmoid, tan-sigmoid, hard-limit, rectified linear unit, and so on) and training methods (conjugate gradient, Levenberg–Marquardt, resilient backpropagation, Broyden–Fletcher–Goldfarb–Shanno quasi-Newton, and so on) which can be used.19–23 Performance metrics of accuracy, sensitivity, and specificity were determined using leave-one-out cross-validation, where each sample is in turn considered the testing set, with the remaining data being the training set. Fig. 1Illustrating the structure of the ANN used for classification of Raman spectra (bottom). Each node applies a nonlinear function to the weighted sum of inputs. The final output layer determines the tissue classification. Note that more neurons (30) were used than what is pictured here for the final model. 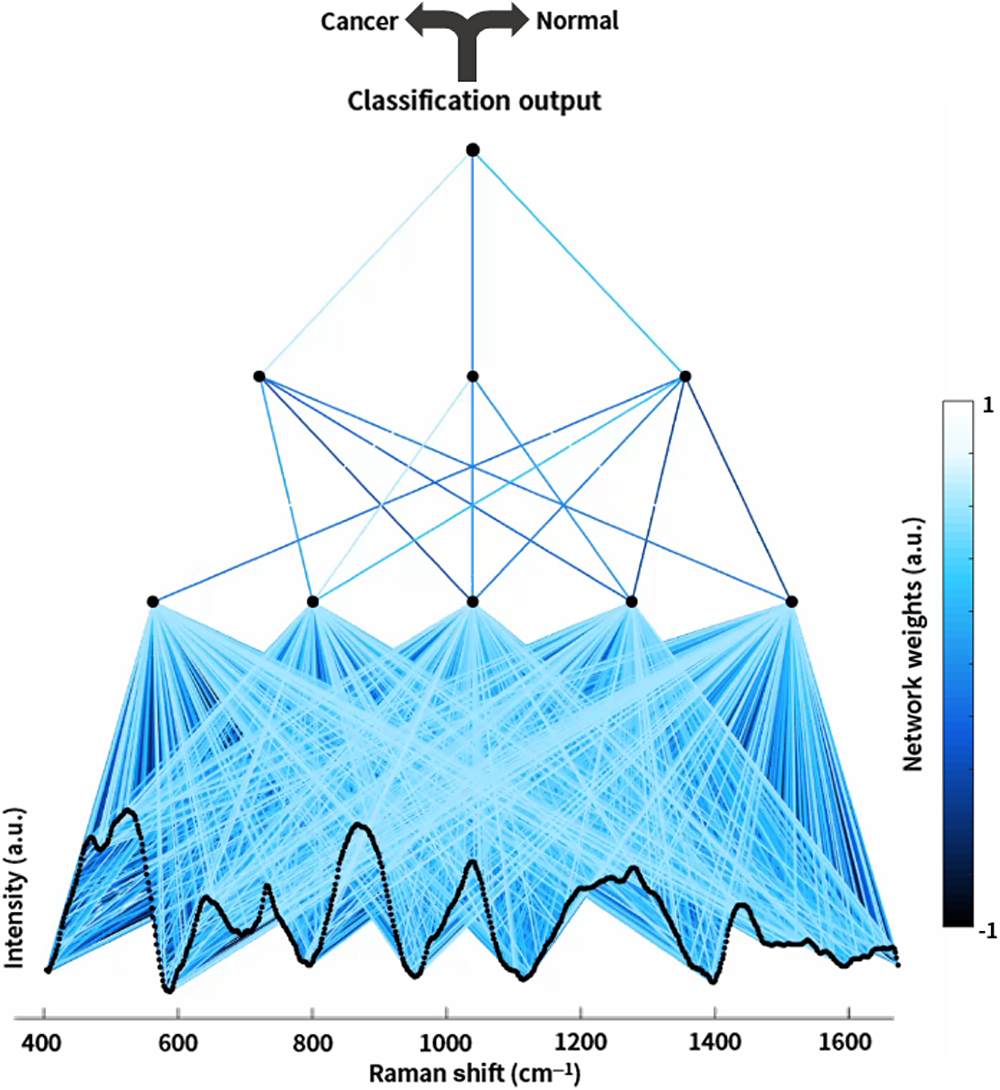 Classification was used in distinguishing measurements of cancer tissue from normal brain. Under normal Raman spectroscopy probe operation, measurements were made with overhead OR lights pointing away from the surgical cavity and with the IR source of the neuronavigation system turned away. However, despite the use of background subtraction for all measurements, a subset of measurements was nevertheless affected by those sources of ambient light. This can be attributed to the variation of ambient light signal from different sources and changing conditions in the OR (movement, shadows, modulated light, probe position and orientation, and so on), as well as the impact of ambient light on methods for removing background fluorescence.24,25 The effects of ambient light sources can be automatically detected based on assessment of the acquired spectra, leading to the exclusion of the measurement for surgical decision-making. The spectral effects of these light sources on the background and raw spectra are distinct (see Fig. 2 and Sec. 3 for details), and it is based on these spectral signatures in the raw spectra that we are able to easily identify spectra with substantial light artifacts, where the effects of light sources are clearly visible based on these spectral signatures. Classification with ANN was performed both on the original dataset ( measurements), where samples with substantial light artifacts were excluded, as well as on the larger dataset with those samples included ( measurements, 16 of which had substantial light artifacts). Classification was also performed using the boosted trees method, as described previously,11 for comparison with the performance of ANN. Boosted trees uses an ensemble of decision trees to distinguish between classes, with each tree operating on the residual of the previous tree.26,27 In this technique, each decision tree operates on the residual of the previous tree, applying threshold decisions to Raman spectral bands. Ambient light artifacts can produce offsets in intensity and nonlinear distortions in the acquired Raman spectra, due to tissue optics and strong spectral signatures produced by these light sources. Boosted trees uses decision trees, which apply threshold values at particular spectral bands. Because these threshold values are fixed, it is unable to adapt to nonlinear spectral distortions, making it unsuitable for handling the effects of ambient light sources. Basically, boosted trees is unable to encode information about variations in intensities at particular spectra bands. This motivates the use of ANN, which is able to model nonlinear processes due to the use of nonlinear transfer functions, and can also encode variations in intensities since each neuron stores this information (weighted sum of its connections). Fig. 2(a) Hand-held Raman spectroscopy probe. (b) Mean preprocessed Raman spectra acquired on calf brain tissue for white matter (light and dark red) and gray matter (light and dark blue), under no lights (dark red and dark blue) and with high intensity OR lights (light red and light blue). (c and d) Raw spectra acquired on (c) white matter and (d) gray matter in calf brain, with no preprocessing applied, under different light conditions: no lights (black), microscope white light on high intensity (purple), microscope blue light on high intensity (blue), IR source of the neuronavigation system (red), and overhead OR surgical lights on high intensity (turquoise).  The analysis of spectra from in vivo brain tissue in humans provided only a limited number of measurements affected by ambient light artifacts. To insure sufficient statistics, further comparative analysis was performed on spectra from ex vivo calf brain tissue to validate the effectiveness of ANN for tissue classification under the presence of light artifacts. Three calf brains were used with a total of 330 measurements taken in the OR (161 from white matter and 169 from gray matter). The probe was placed in contact with the brain tissue for each measurement. Each acquisition consisted of one background measurement with the laser off, and three averaged measurements with the laser on, for a total acquisition time of 0.2 s. Spectra were measured under different light conditions: no lights; high and low intensity OR lights (maximum and minimum intensity); high, medium, and low intensity microscope white lights (50%, 25%, and 5% intensity); high, medium, and low intensity microscope blue lights (50%, 25%, and 5% intensity); and the IR source from the neuronavigation system. Light sources were aimed directly at the sampled tissue. In total 93 out of the 330 measurements were taken under no lights. See Table 1 for details of how many measurements were taken under different light conditions. Table 1Number of measurements of calf brain tissue taken under different light conditions, for gray and white matters.
Spectra were preprocessed using background subtraction, instrument response correction using measurements of an SRM2241 reference standard (National Institute of Standards and Technology, Maryland), autofluorescence removal, and normalization (standard normal variate). ANN was used to classify tissue as either white or gray matter. The ANN was created with 32 total neurons in the hidden layers: 22 neurons in the first hidden layer and 10 neurons in the second hidden layer. These parameters (number of neurons and number of layers) were determined using grid search parameter optimization, iterating over a range of possible values for each parameter. The tangent sigmoidal transfer function was used for both hidden layers, and a linear transfer function was used for the output layer. Levenberg–Marquardt backpropagation was used to train the network weights. Classification was also performed using boosted trees for comparison. Cross-validation for classification was performed per-brain, where all of the spectra from one of the brains were considered the testing data and the spectra from the other brains were the training data. This was repeated for each of the three brains. 3.ResultsThe hand-held fiberoptic probe was used to take intraoperative measurements of Raman spectra during brain tumor resection for 17 patients at the Montreal Neurological Institute and Hospital [Fig. 2(a)]. Important spectral differences between samples with cancer tissue versus normal brain are associated with variation in cholesterol and phospholipids (700 and ), proteins (), and nucleic acid (1540 to ).10,11,28 Details about the spectral areas affected by different sources of light such as microscope lights, overhead OR lights, LCD screens, and windows, can be found in our previous work.12 The spectral bands affected by these other light sources can overlap with important Raman signals, impeding the ability to properly use the available information for tissue classification. In the in vivo dataset considered in this work, however, the surgical microscope lights were turned off for all measurements, and so it has been determined from their spectral signatures that the main potential sources of ambient light during neurosurgery were overhead OR lights and the IR source of the neuronavigation system. OR surgical lights contribute mainly in the visible part of the spectrum with a typical decaying intensity in the near-IR while contributions from the IR source of the neuronavigation system produce a signal across the spectral range, though primarily in the near-IR and IR range. Multivariate analysis was performed to make use of the available spectral data. Table 2 shows the classification performance of boosted trees and ANN for distinguishing tissue types with or without the presence of measurements with light artifacts. Table 2Classification performance of boosted trees and ANNs for distinguishing cancer from normal brain in datasets where those measurements with light artifacts are excluded and included, respectively.
All performance metrics are for both methods when excluding light artifacts. When measurements with light artifacts are included, boosted trees sees a substantial performance drop in accuracy, sensitivity, and specificity. ANN continues to perform at almost the same level despite the inclusion of light artifacts, with 19% greater sensitivity and 7% greater specificity when compared with boosted trees. This is because ANN can model nonlinear effects and encodes information about variations in intensities at particular spectral bands, which is essential for modeling the offsets and spectral distortions caused by light sources. Boosted trees does not encode this type of information. ANN uses nonlinear transfer functions applied to the weighted sums of network connections at each neuron, allowing it to model complex nonlinear effects. In contrast, boosted trees employs an ensemble of decision trees, in which each decision tree does not transmit any information to subsequent decision trees other than whether the Raman signal at particular spectral bands is above or below thresholds. The actual intensity value at a spectral band is lost in the boosted trees model, making it extremely difficult to account for the contribution of confounding signals in the spectra. Further validation was performed on ex vivo calf brain tissue (three calf brains with a total of 330 measurements). Multivariate analysis was used to assess the capabilities of ANN for distinguishing white matter from gray matter in the presence of light artifacts. To illustrate these differences, Fig. 2(b) shows the mean Raman spectra for white and gray matter, with no lights and white high intensity OR lights. Raw spectra (before preprocessing) are provided in Figs. 2(c) and 2(d) for a number of light conditions. The neuronavigation IR source and the OR lights produce spectrally broad contributions to the acquired spectra, whereas the microscope lights contribute a signal that is spectrally sharper at a number of different band ranges. The OR lights produce a notably larger contribution for gray matter than for white matter, which may be because less light is reflected compared with white matter. For the processed Raman spectra, it is evident from Fig. 2(b) that many of the spectral features and peaks remain despite the presence of light artifacts but are offset or deformed by the polluted signal, particularly for gray matter tissue. This motivates the use of ANN for tissue classification, which is able to adapt to nonlinear distortions. Table 3 shows the classification performance of boosted trees and ANN for distinguishing gray matter from white matter in calf brain with or without the presence of measurements with light artifacts. Table 3Classification performance of boosted trees and ANNs for distinguishing gray matter from white matter (in ex vivo calf brain tissue) in datasets where measurements with light artifacts are excluded and included, respectively.
ANN continues to perform at almost the same level (97% to 100% accuracy) despite the inclusion of light artifacts, whereas boosted trees sees a substantial drop in accuracy. This is consistent with the in vivo findings, suggesting that ANN is better suited to handle the nonlinear effects of ambient light sources on spectra. The ability to detect cancer tissue in a manner that is robust to the effects of light artifacts is critical for improving the ease of clinical use of Raman spectroscopy in vivo. There are often numerous potential sources of ambient light in an OR that may interfere with the acquisition of spectra during surgical operations. Thus, the use of ANN for tissue classification can help facilitate clinical translation of Raman spectroscopy techniques. 4.DiscussionRaman spectroscopy is able to detect invasive brain cancer in glioma patients. We have developed a system using a hand-held probe that can be used for rapid intraoperative cancer detection. Raman spectra are acquired to provide molecular information that can be used to distinguish between normal brain and cancer tissue, based on supervised machine learning algorithms. Gliomas typically recur at tumor remnants in the resection cavity, and so the ability to detect this cancer during surgery may improve the completeness of resection, and thus impact patient survival. Approaching radiographically complete resection can yield substantial survival advantages,16,29 particularly for low-grade gliomas.13,30–32 Sources of light commonly found in the OR can limit the detection capabilities of Raman spectroscopy if their impact is not properly managed either physically by controlling the intraoperative light environment or through automated exclusion of the measurements during surgery for decision-making. Here, we have demonstrated that ANNs can be used to circumvent these issues by better modeling the nonlinear interactions of extraneous light sources. The nonlinear and adaptive nature of ANNs makes it suitable to modeling these kinds of interactions. Moreover, this technique can be used with existing Raman spectroscopy systems, without the need for complex system hardware implementations such as for wavelength-modulated Raman spectroscopy or filtering techniques.24,25 Although we have demonstrated in the past that Raman spectroscopy can be achieved in the presence of ambient light background during neurosurgery, some light sources are necessary for other standard operating procedures, and so making the use of Raman spectroscopy more robust to ambient light helps improve clinical integration into the surgical workflow. Here, we have demonstrated that an ANN classification technique can be used to circumvent those limitations associated with overhead OR light levels and other sources such as IR light from a neuronavigation system. We have also presented preliminary results suggesting that by using ANN, the surgical microscope lights did not prevent the detection of gray versus white matter in ex vivo calf brain tissue. Further studies would be needed to assess the ability to distinguish cancer versus normal brain in vivo under the surgical microscope lights. Although the application presented in this study is for brain tumor resection, this methodology could be applied to any clinical use of Raman spectroscopy where ambient light is a consideration. AcknowledgmentsEric Marple (EmVision LLC) assisted with system design and validation. Kelvin Mok assisted with neuronavigation techniques. This work was supported by the Fonds de Recherche du Quebec Nature et Technologies, the Natural Sciences and Engineering Research Council of Canada, the Canadian Institute of Health Research, the Groupe de Recherche en Sciences et Technologies Biomedicales, and the Banque Nationale. K.P. and F.L. are cofounders of ODS Medical Inc., a medical device company that seeks to commercialize the Raman spectroscopy system for real-time detection of tissue abnormalities. ReferencesF. K. Albert et al.,
“Early postoperative magnetic resonance imaging after resection of malignant glioma: objective evaluation of residual tumor and its influence on regrowth and prognosis,”
Neurosurgery, 34
(1), 45
–60
(1994). http://dx.doi.org/10.1227/00006123-199401000-00008 NEQUEB Google Scholar
W. Stummer et al.,
“Counterbalancing risks and gains from extended resections in malignant glioma surgery: a supplemental analysis from the randomized 5-aminolevulinic acid glioma resection study. Clinical article,”
J. Neurosurg., 114
(3), 613
–623
(2011). http://dx.doi.org/10.3171/2010.3.JNS097 JONSAC 0022-3085 Google Scholar
I.-F. Talos et al.,
“Supratentorial low-grade glioma resectability: statistical predictive analysis based on anatomic MR features and tumor characteristics,”
Radiology, 239
(2), 506
–513
(2006). http://dx.doi.org/10.1148/radiol.2392050661 RADLAX 0033-8419 Google Scholar
R. Weissleder and M. J. Pittet,
“Imaging in the era of molecular oncology,”
Nature, 452
(7187), 580
–589
(2008). http://dx.doi.org/10.1038/nature06917 Google Scholar
A. Mahadevan-Jansen et al.,
“Development of a fiber optic probe to measure NIR Raman spectra of cervical tissue in vivo,”
Photochem. Photobiol., 68
(3), 427
–431
(1998). http://dx.doi.org/10.1111/j.1751-1097.1998.tb09703.x PHCBAP 0031-8655 Google Scholar
A. S. Haka et al.,
“In vivo margin assessment during partial mastectomy breast surgery using Raman spectroscopy,”
Cancer Res., 66
(6), 3317
–3322
(2006). http://dx.doi.org/10.1158/0008-5472.CAN-05-2815 Google Scholar
M. Boncheva et al.,
“Depth profiling of stratum corneum hydration in vivo: a comparison between conductance and confocal Raman spectroscopic measurements,”
Exp. Dermatol., 18
(10), 870
–876
(2009). http://dx.doi.org/10.1111/exd.2009.18.issue-10 EXDEEY 0906-6705 Google Scholar
A. Mizuno et al.,
“Near-infrared Fourier transform Raman spectroscopic study of human brain tissues and tumours,”
J. Raman Spectrosc., 25
(1), 25
–29
(1994). http://dx.doi.org/10.1002/jrs.v25:1 JRSPAF 0377-0486 Google Scholar
S. Koljenović et al.,
“Discriminating vital tumor from necrotic tissue in human glioblastoma tissue samples by Raman spectroscopy,”
Lab. Invest., 82
(10), 1265
–1277
(2002). http://dx.doi.org/10.1097/01.LAB.0000032545.96931.B8 Google Scholar
S. N. Kalkanis et al.,
“Raman spectroscopy to distinguish grey matter, necrosis, and glioblastoma multiforme in frozen tissue sections,”
J. Neurooncol., 116
(3), 477
–485
(2014). http://dx.doi.org/10.1007/s11060-013-1326-9 Google Scholar
M. Jermyn et al.,
“Intraoperative brain cancer detection with Raman spectroscopy in humans,”
Sci. Transl. Med., 7
(274), 274ra19
(2015). http://dx.doi.org/10.1126/scitranslmed.aaa2384 STMCBQ 1946-6234 Google Scholar
J. Desroches et al.,
“Characterization of a Raman spectroscopy probe system for intraoperative brain tissue classification,”
Biomed. Opt. Express, 6
(7), 2380
–2397
(2015). http://dx.doi.org/10.1364/BOE.6.002380 BOEICL 2156-7085 Google Scholar
J. S. Smith et al.,
“Role of extent of resection in the long-term outcome of low-grade hemispheric gliomas,”
J. Clin. Oncol., 26
(8), 1338
–1345
(2008). http://dx.doi.org/10.1200/JCO.2007.13.9337 Google Scholar
N. Sanai et al.,
“An extent of resection threshold for newly diagnosed glioblastomas,”
J. Neurosurg., 115
(1), 3
–8
(2011). http://dx.doi.org/10.3171/2011.2.JNS10998 JONSAC 0022-3085 Google Scholar
N. Sanai and M. S. Berger,
“Glioma extent of resection and its impact on patient outcome,”
Neurosurgery, 62
(4), 753
–764
(2008). http://dx.doi.org/10.1227/01.neu.0000318159.21731.cf NEQUEB Google Scholar
M. Lacroix et al.,
“A multivariate analysis of 416 patients with glioblastoma multiforme: prognosis, extent of resection, and survival,”
J. Neurosurg., 95
(2), 190
–198
(2001). http://dx.doi.org/10.3171/jns.2001.95.2.0190 JONSAC 0022-3085 Google Scholar
J. Zhao et al.,
“Automated autofluorescence background subtraction algorithm for biomedical Raman spectroscopy,”
Appl. Spectrosc., 61
(11), 1225
–1232
(2007). http://dx.doi.org/10.1366/000370207782597003 APSPA4 0003-7028 Google Scholar
L. Fausett, Fundamentals of Neural Networks: Architectures, Algorithms and Applications, Pearson Education, New York City
(2006). Google Scholar
W. Duch and N. Jankowski,
“New neural transfer functions,”
J. Appl. Math. Comput. Sci., 7
(3), 639
–658
(1997). Google Scholar
W. Duch and N. Jankowski,
“Survey of neural transfer functions,”
Neural Comput. Surv., 2 163
–213
(1999). Google Scholar
M. Leshno et al.,
“Multilayer feedforward networks with a nonpolynomial activation function can approximate any function,”
Neural Netw., 6
(6), 861
–867
(1993). http://dx.doi.org/10.1016/S0893-6080(05)80131-5 Google Scholar
S. Ayat et al.,
“A comparison of artificial neural networks learning algorithms in predicting tendency for suicide,”
Neural Comput. Appl., 23
(5), 1381
–1386
(2012). http://dx.doi.org/10.1007/s00521-012-1086-z Google Scholar
R. Caruana and A. Niculescu-Mizil,
“An empirical comparison of supervised learning algorithms,”
in Proc. of the 23rd Int. Conf. on Machine Learning,
161
–168
(2006). http://dx.doi.org/10.1145/1143844.1143865 Google Scholar
S. Dochow et al.,
“Etaloning, fluorescence and ambient light suppression by modulated wavelength Raman spectroscopy,”
Biomed. Spectrosc. Imaging, 1
(4), 383
–389
(2012). http://dx.doi.org/10.3233/BSI-120031 Google Scholar
J. Zhao et al.,
“Clinical Raman measurements under special ambient lighting illumination,”
J. Biomed. Opt., 19
(11), 111609
(2014). http://dx.doi.org/10.1117/1.JBO.19.11.111609 JBOPFO 1083-3668 Google Scholar
J. H. Friedman,
“Stochastic gradient boosting,”
Comput. Stat. Data Anal., 38
(4), 367
–378
(2002). http://dx.doi.org/10.1016/S0167-9473(01)00065-2 CSDADW 0167-9473 Google Scholar
E. Bauer and R. Kohavi,
“An empirical comparison of voting classification algorithms: bagging, boosting, and variants,”
Mach. Learn., 36
(1–2), 105
–139
(1999). http://dx.doi.org/10.1023/A:1007515423169 Google Scholar
A. Beljebbar et al.,
“Ex vivo and in vivo diagnosis of C6 glioblastoma development by Raman spectroscopy coupled to a microprobe,”
Anal. Bioanal. Chem., 398
(1), 477
–487
(2010). http://dx.doi.org/10.1007/s00216-010-3910-6 ABCNBP 1618-2642 Google Scholar
W. Stummer et al.,
“Extent of resection and survival in glioblastoma multiforme: identification of and adjustment for bias,”
Neurosurgery, 62
(3), 564
–576
(2008). http://dx.doi.org/10.1227/01.neu.0000317304.31579.17 NEQUEB Google Scholar
M. J. McGirt et al.,
“Extent of surgical resection is independently associated with survival in patients with hemispheric infiltrating low-grade gliomas,”
Neurosurgery, 63
(4), 700
–707
(2008). http://dx.doi.org/10.1227/01.NEU.0000325729.41085.73 NEQUEB Google Scholar
M. S. Berger et al.,
“The effect of extent of resection on recurrence in patients with low grade cerebral hemisphere gliomas,”
Cancer, 74
(6), 1784
–1791
(1994). http://dx.doi.org/10.1002/(ISSN)1097-0142 CANCAR 0008-543X Google Scholar
G. E. Keles, K. R. Lamborn and M. S. Berger,
“Low-grade hemispheric gliomas in adults: a critical review of extent of resection as a factor influencing outcome,”
J. Neurosurg., 95
(5), 735
–745
(2001). http://dx.doi.org/10.3171/jns.2001.95.5.0735 JONSAC 0022-3085 Google Scholar
|


