
|
|
1.IntroductionUpconversion nanoparticles possess high photochemical stability when excited by the light in the near-infrared part of the spectrum and can be easily identified due to being narrow and quite distant from each other with luminescence bands in the shortwave spectral range.1 The use of an upconversion multiphoton process allows to minimize autofluorescence and photodamage of biotissues and to obtain diffuse optical images with excellent contrast.2 These unique properties make upconversion nanoparticles in biophotonics extremely attractive for in vivo and in vitro applications and they are more actively studied for use in microscopy,3 deep biotissue visualization,4 tomography,5 as highly sensitive biosensors,6 for temperature measurement7 and photodynamic therapy.8 Depending on the dopants’ composition and concentration, the upconversion nanoparticles exhibit luminescence bands in blue, green, and are particularly promising for medical applications red and near-infrared spectral ranges.9 The upconversion nanoparticles can be used for the imaging of cancer cells,10 specific fluorescent immunolabeling,11 detection of biomarker molecules,12 and luminescence resonance energy transfer-based protein detection.13 The upconversion nanoparticles have obvious advantages when used in microscopy with multiphoton excitation compared to quantum dots and organic dyes, even despite the fact that their quantum efficiency of light conversion is low and reaches up to 5% (the absolute value depends on the composition, shape, size, and the pumping power density).14 The efficiency of the energy transfer upconversion (ETU) process is much higher than that of other multiphoton processes, since the transformation occurs through real energy levels.15 As an example, ETU is 10 orders of magnitude more efficient than two-photon (2P) absorption without a real intermediate electronic state in similar materials. Quantum yield of the upconversion nanoparticles has quadratic dependence on power density of the exciting light, thus increasing the intensity of the excitation light can considerably increase the quantum yield of luminescence compared to an organic luminescent substance.16 The absence of photobleaching and the unique set of luminescence bands allow the tracking of single nanoparticles and long probing. 17,18 In addition, it is possible to use cheap laser diodes for the upconversion excitation, which makes the method accessible for a wide range of applications.19 The scheme of the infrared radiation conversion process to the luminescence in green and red spectral range for the ion pair is shown in Fig. 1.20 Fig. 1The process of IR-radiation conversion into blue, green, and red luminescence for the ion pair. Solid gray and black arrows represent ground state absorption (GSA) and excited state absorption (ESA). Dashed arrows represent population and depopulation processes which are caused by energy transfer (ET). Color arrows represent light emission. The wavy arrow represents internal conversion. The fluorescence lifetime of the , , and , states of , and the state of in , nanorods taken from Ref. 20.  The efficiency of upconversion is determined by the lifetime of rare-earth ions metastable states, the probability of the exchange interaction, and the electron–phonon interaction. These parameters, in turn, are determined by the distance between ions, the symmetry of the nearest environment, and the presence of quenching impurities.21 The degree of quenching by specific ligands depends on the abundance of these ligands on the surface and on their vibrational energy.22 High-energy oscillators on the surface (such as molecules or ions on their surface which have vibrational energies of 1400 and , respectively23,24) induce nonradiative relaxation of the dopants close to the surface. As long as the vibrations are able to interact directly with the electronic excitations, they will be able to dissipate energy. The vibrating bonds do not have to be chemically attached to the nanoparticle surface. Frequent collisions of molecules in the solvent with the nanoparticle surface provide enough opportunity for the excitation energy to be transferred to the vibrations of solvent molecules. Furthermore, when fluoride nanoparticles get inside lysosomes in the presence of the acidic phagolysosomal fluid, the particles are transformed into mesh-like structures.25 Therefore, if the upconversion particle is not coated with an inert shell, the kinetic characteristics of upconversion luminescence allow establishing not only the mechanisms of the radiation frequency conversion (absorption from the main excited states, energy transfer, multiphonon relaxation, cross-relaxation) but also assessing the degree of interaction between the particles and the environment and their reaction to the quenching molecules and ions. It is important to mention the long luminescence lifetime of upconversion nanoparticles compared to traditional organic luminophores, which can be beneficial for many applications, e.g., when evaluating the effect of a microenvironment on the particles.26 There have been a number of works about so called τ-dots, upconversion nanoparticles which have a characteristic luminescence lifetime based on their size.27 Nevertheless, in the field of laser scanning confocal microscopy (LSM) the researchers face the disadvantages of long luminescence lifetime of upconversion nanoparticles. Unlike 2P microscopy with quantum dots and dyes, upconversion luminescence happens with a time delay because of the transferring of pumping energy between ions and the energy relaxation between levels with a long lifetime. As an excitation source for upconversion nanoparticle, it is convenient to use femtosecond lasers, tunable in near-IR spectral range. They are typically used for the 2P excitation of organic dyes and the second-harmonic generation (SHG) by biological structures. During the 2P excitation and the SHG, the energy density necessary for excitation occurs only in the focus of the lens, thus there is no need to use additional confocal apertures, for a fluorescent signal in the visible spectral range registration the sensitive nondescanned detectors (NDD) is often used. With such a set of the LSM equipment (femtosecond laser and NDD) due to the long decay time of upconversion luminescence, a streaking effect appears along the fast scan axis, when luminescence is still recorded by the sample left behind. When using a confocal aperture due to upconversion luminescence with periods of rise and decay, it is impossible to register the luminescent signal at all. The solution is to use a slow scan speed in scanning microscopy or wide-field illumination microscopy.28 Ideal for upconversion nanoparticles is the use of wide-field illumination in the pulsed mode, with high power density of microseconds or milliseconds duration.29 Similar difficulties arise when using upconversion nanoparticles in microscopy with time-correlated single photon counting (TCSPC). Fluorescence-lifetime imaging microscopy is designed for the time range from picoseconds to nanoseconds, typical of organic dyes.30 So far there have been no publications on using the combination of upconversion particles with phosphorescence-lifetime imaging microscopy with a time range of up to a millisecond. There have been a number of studies that described time-resolved emission measurement methods with the use of a rotating wheel.31,32 The sample was attached to the rotating wheel. Light was focused at the rim of the wheel, so the excitation was performed only when the turning disc carries the sample through the illuminated spot. The obtained images showed a luminescence trace around its circumference with luminescence intensity decreasing as the sample rotates away from the excitation spot. Using the rotation speed of disc one could convert spatial distribution of luminescence intensity into lifetime. Another similar method was described in this article.33 This method utilizes the laminar microflows for time-resolved emission measurements with steady state excitation and detection. Passing a laminar flow through a short illuminated section of a microchannel provided a means for pulsed-like photoexcitation of the luminophores carried by the fluid. The use of LSM to determine the lifetime of the upconversion luminescence is based on similar principles, but the sample remains stationary and the laser scanning beam is moving across its surface. An interesting approach to getting the clear picture of the upconversion nanoparticles distribution during scanning microscopy with high speed is the subsequent image processing. It was shown that by using an image processing method based on Richardson–Lucy deconvolution, it is possible to eliminate the streaking effect that occurs because of the upconversion nanoparticles long lifetime.34 This paper presents a specially developed method for processing images recorded by LSM, using deconvolution that allows using the intensity distribution profile of upconversion luminescence along the fast scan axis to determine the lifetime of the excited states of the erbium ion, as well as to carry out the deconvolution with the aim of getting rid of the streaking effect and to determine the actual position of the particle in the image. 2.Experimental Section2.1.Synthesis and Characterization of Upconversion ParticlesFluoride particles and were synthesized in GPI RAS by the method of coprecipitation from water solutions followed by annealing at 600°C.35 As a dopant for providing the particles with upconversion properties, the nanoparticles were doped with pairs of rare-earth ions , . Phase composition of the solid specimens was evaluated by x-ray diffraction (XRD) (Brucker D8 advanced diffractometer; CuKa radiation). Calculations of the lattice parameters were done using TOPAS software. Hydrodynamic sizes of nanoparticles were determined by multiangle spectrometer of dynamic light scattering Photocor Complex (Photocor, Russia). The upconversion luminescence spectra in the visible spectral range which were used to calculate energy yield were measured as follows.36 The setup consists of a modified Avantes integrating sphere, a LESA-01-Biospec spectrometer, and a 974-nm continuous wave laser. The integrating sphere with an internal diameter of 50 mm and an SMA port under the optical gate was modified so that the hole, through which a fiber with exciting radiation was introduced into the sphere, was oriented at an angle of 90 deg to the SMA port and 90 deg to the sample inside the sphere. The absorption of exciting radiation in the fiber was taken into account by measuring the radiation power at the fiber output with a power meter. Radiation scattered inside the sphere, including the upconversion luminescence, was collected in an SMA/SMA fiber and delivered through this fiber to a LESA-01-Biospec spectrometer. Upconversion luminescence was excited by a 974-nm laser, . Powder samples were placed between two cover slips, which then were fastened together and placed inside the integrating sphere. Spectral data were analyzed using the UnoMomento (Biospec, Russia) program for processing spectra, taking into account the instrumental function of the spectrometer and the integrating sphere. The instrumental function was determined by calibrating the setup with the help of light-emitting diodes with different wavelengths. The optical scheme of the spectrum analyzer allowed the simultaneous measurement of the luminescence spectrum and scattered radiation spectrum in one dynamical intensity range. Energy yield of upconversion luminescence was calculated from the equation where is the output power of the 974-nm laser absorbed by the sample to the difference of the scattered radiation power for the referenced sample and the power by the sample under study. To improve the measurement accuracy, nanoparticles without activator ions were synthesized as the reference nonabsorbing sample.2.2.Upconversion Luminescence Kinetics Visualization with LSMThe kinetic investigations of the upconversion microparticles luminescence were carried out using a Carl Zeiss LSM-710-NLO microscope (Carl Zeiss, Germany) equipped with a pulse femtosecond Chameleon Ultra II laser system (80-MHz pulse laser, 140-fs pulse width, tunable in the 690 to 1060 nm range, Coherent Inc.), at 980-nm excitation. The average power density was determined by measuring the average power at the sample, 5.42 mW, and dividing by the area of a circle with a diameter and equaled around . The luminescence signal from microparticles was registered by three NDD detectors. The set of blocking filters divides the luminescence signal into three spectral ranges: 400 to 490 nm, 490 to 560 nm, and 565 to 700 nm corresponding to each of the NDD detectors (Fig. 2). Fig. 2The experimental setup scheme of LSM synchronized with TCSPC method for luminescence kinetics measuring.  The upconversion microparticles were placed on a thin 0.17-mm cover glass. Images were obtained at the following parameters: air objective, image size , resolution , scanning speed 1.27 to , total image acquisition time 18.7 s. The difference in the measured values for one sample was less than 10% in a 95% probability confidence interval. 2.3.Upconversion Luminescence Kinetics Measurements with TCSPCWithout changing the objective position, the upconversion luminescence from the same point can be registered by the TCSPC part. The TCSPC setup was based on streak camera C9300-508 with streak scope C10627-13 (Hamamatsu, Japan). The upconversion luminescence was excited by Chameleon Ultra II laser system: 80-MHz pulse laser, 140-fs pulse width, 980 nm, . Microparticle irradiation was performed through an air objective of the Carl Zeiss LSM-710-NLO microscope. The particles were placed on a thin 0.17-mm cover glass; the particle under investigation was placed in the center of the image, using the microscope software ZEN 2010 (Carl Zeiss, Germany). The laser was synchronized with a delay generator of the streak scope. We used bleaching mode for the spot. Bleaching time was 1 ms; during this time the bleaching point was irradiated with 80,000 femtosecond laser pulses. The 12.5-ns time interval between pulses was much shorter than the shortest lifetime of or excited states37 so, after the end of the pulse the system could not completely decay because the new pump cycle reinitiates the population increase. This mode could be used as quasicontinuous. The pause time between bleaching series was 2 ms. Output trigger signal at the start of pause time was sent to a streak scope synchronous delay generator to launch the photon counting. Upconversion luminescence was collected using the optical fiber and then delivered to the streak camera registration system. Without changing the objective position, upconversion luminescence from the same point can be registered using LSM method (Fig. 2). 2.4.Algorithm of the Streaking Effect Deconvolution with the Time Parameters CalculationThe image obtained using the LSM method carries information about the values of the luminescence intensity in each point of the image in blue, green, and red spectral ranges (corresponding to the spectral range of detectors NDD-1, NDD-2, and NDD-3). Because of the long upconversion luminescence lifetime and registration without pinhole by the NDD detectors, the sharp strips along the fast scan axis are observed on the obtained images. We shall call such images distorted. They can be presented as a convolution of an undistorted image with a distorting point spread function (PSF). In the case of the upconversion particles, PSF is described by the sum of two exponential functions corresponding to the rise and the decay of the upconversion luminescence38 where is a scanning speed along the fast axis, and are the rise and decay times of the upconversion luminescence, , are the PSF coefficients, is a Dirac delta along the slow scan axis, is a coordinate on the slow scan axis, and is a coordinate on the fast scan axis.The rise and the decay times of the upconversion luminescence, and , as well as the intensity value at the initial time and are the parameters of PSF determined from the upconversion luminescence intensity distribution profile along the fast scan axis. Moreover, it is important to note that the parameters , , , depend on both the particle size and on the microenvironment, and are not fixed for the entire image. The proposed improved method of image processing based on the Lucy–Richardson deconvolution is implemented in the software environment of C # (C Sharp) using an algorithm from a free library ALGLIB. Since the distortion is associated with a long luminescence lifetime, we can split the image line-by-line by the individual pixels along the fast scan axis. Figure 3(a) shows an example of select lines from the source image and the intensity distribution profile corresponding to these lines. Fig. 3The deconvolution procedure for NDD-2 (green region). (a) The original image obtained by LSM with an example of select lines before deconvolution. (b) The experimental intensity distribution data with standard error corresponding to the selected lines (red and blue dots) taken along the fast scan line of the image. Red and blue lines are equivalent to the PSF obtained through the approximation and used for deconvolution. (c) The image after 25 iterations of Richardson–Lucy deconvolution of each line along the fast-scan axis with the PSF shown in (b). (d) The intensity profile for the image after deconvolution.  The following procedure is performed to define the PSF parameters for each line. At the beginning, the boundaries of the rise and the decay of the signal in the line are determined. The maximum brightness value obtained in a line is compared to the noise level. The values to the left and right sides from the maximum point are accepted until they reach the noise level. The obtained sequence is approximated by Eq. (2). The result is a set of parameters: , , , and the correlation coefficient . To perform the deconvolution, only those pairs of parameters for which are taken. Figure 3(b) shows the experimental intensity distribution data with standard error for two lines (red and blue dots) and the PSF obtained through the approximation (red and blue lines). This procedure is performed for each line of the distortion image. The computed pair of parameters is used to derive a nondistorted image using the method of Lucy–Richardson, described as follows: where is an image obtained after iterations, is a PSF, is an inverted PSF such that , , , , and is a distorted image.Figure 3(c) shows the image after the deconvolution (25 iterations). Figure 3(d) shows the profile of the intensity for the image after the deconvolution (25 iterations). Such an approach allows optimizing the algorithm to reduce the computing time and to reduce the complexity, as deconvolution is carried out not for each image point, but only for the range in which the corresponding distribution is found. When using the line-partition image, the parameters are calculated in terms of the distribution function for each individual line, which allows taking into account the dependence of the upconversion luminescence lifetime on the size and the microenvironment, and to improve the accuracy of the method. The number of iterations required for image recovery is 60. The computational complexity of the standard Lucy–Richardson method is , where is an image side in pixels. The computational complexity of the improved method is . The output model parameters are the upconversion luminescence life time and image that characterize the true microparticle’s position. 2.5.In Vitro Cellular StudiesIntracellular distribution of submicroparticles was studied using a human monocytic cell line THP-1. The day before treatment cells were seeded in 35-mm culture Petri dishes with a bottom of thin glass 0.17 mm, preliminarily treated with a 0.1% gelatin solution. The cells were then supplied with a RPMI 1640 medium containing 10% FBS. On the treatment day, an aqueous dispersion of the particles was incubated with cells for over 4 h at 37°C. Cellular imaging was done using an LSM-710-NLO microscope (Carl Zeiss, Germany) equipped with a pulse femtosecond Chameleon Ultra II laser system (80-MHz pulse laser, 140-fs pulse width, tunable in the 690 to 1060 nm range, Coherent Inc.), at 980-nm excitation. 3.Results and DiscussionThe studied fluoride particles , doped with and ion pairs had a fluorite structure, cubic phase. After synthesis using the method of precipitation from aqueous solutions the size of the particles amounted between 50 and 300 nm. After the subsequent annealing at 600°C, the upconversion powders contained the indivisible aggregates with size of 2 to . Details on the XRD and scanning electron microscope (SEM) characterizations can be found in the Appendix. The upconversion luminescence spectra of microparticles, obtained by excitation with 974-nm continuous wave laser at power density and with 980-nm femtosecond laser 80 MHz, 140-fs pulse width, average power density are shown in Fig. 4. Fig. 4Spectra of microparticles upconversion luminescence. The spectra obtained by 974-nm continuous wave laser excitation with the power density and by 980-nm femtosecond laser, 80 MHz, 140-fs pulse width, power density. The microparticles without shell, treated under different conditions: dried at 600°C in the normal atmospheric conditions (dry powder) and dried at a temperature of 600°C in the carbon atmosphere inside the graphite melting pot. 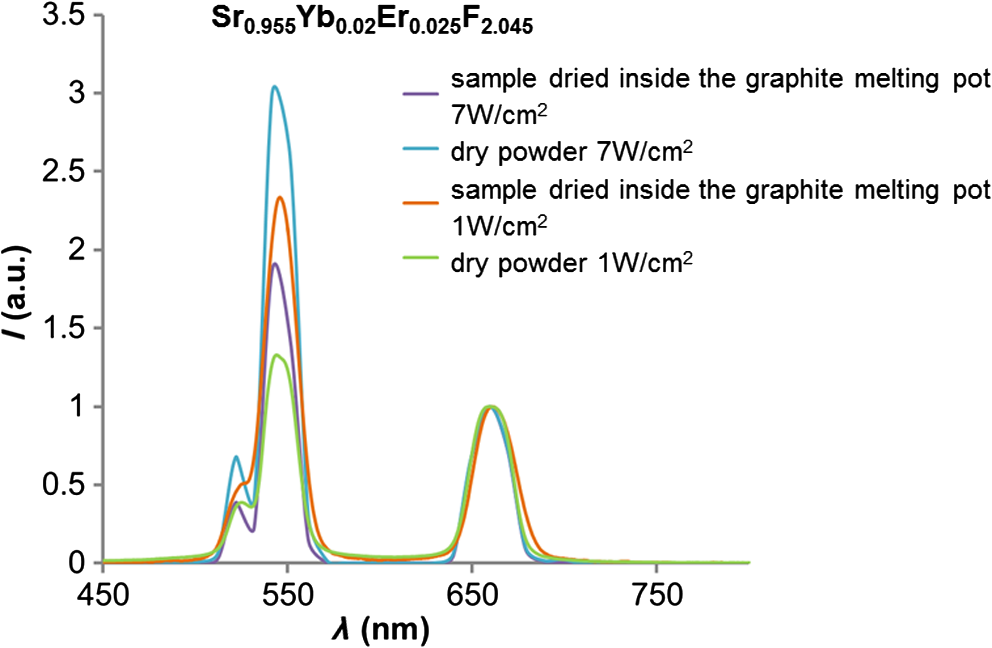 At both types of excitation, the upconverison luminescence shows bands of at 525 nm , 545 nm, , and 665 nm . The efficiency of upconversion in the visible spectral range for the studied particles under 974-nm continuous wave laser excitation at power density was from 1% to 4% depending on the doping ions’ composition and concentration ratio. When using a pulsed mode pumping with a relatively high power density, the upconversion luminescence quantum yield reaches a certain constant value.39 Therefore, at high excitation power densities of to implemented at the femtosecond excitation, the relative brightness of the sample is proportional to the upconversion efficiency at .40 Images obtained for particles doped with and ion pairs by LSM under the excitation at 980 nm, 80 MHz, 140 fs, and the registration of the signal with three NDDs show a distinct streaking effect. The resulting intensity profile of the luminescence tracks shows a rapid rise region of signal intensity that corresponds to the energy transfer between the donor and the acceptor, and an area of slow decay that characterizes the transfer time from the excited state to the ground state, which confirms the multiphoton process of the emitting state population (Fig. 5). Fig. 5Images obtained for and microparticles by LSM under 980-nm excitation and registration of the signal with NDDs. On the top: the LSM images of the two microparticles doped with and ion pairs with the streaking effect. Image acquisition parameters were pixel dwell time, frame , field of view. The graphs: The intensity profile along the fast scan axis represented in the time scale registered by different NDDs that correspond to the upconversion luminescence decay of and of .  The experimental data can be approximated with a well-known theoretical dependency where is an intensity factor, and and are the rise and decay times of upconversion luminescence, respectively. The characteristic decay times amounted to about 0.1 to 1.5 ms, and do not depend on the power density of the exciting radiation in the range of tested power densities from 0.7 to , that correspond to used settings in the control program of the microscope from 1% to 50% of the laser intensity. Since the intensity of upconversion luminescence has a quadratic dependence on the pump power density at low excitation power density, the recorded signal is weaker, leading to an increase of the decay lifetime measurement error.Scanning microscopy images allow quite precise measurement of upconversion luminescence kinetics from individual microparticles. This was confirmed by comparing the profiles of track intensity from upconversion microparticles, obtained using LSM, with kinetics registered using TCSPC (Fig. 2, Secs. 2.2 and 2.3). We synchronized the femtosecond laser excitation with the upconversion luminescence signal registration by streak camera in the visible region, so that it was possible to record the signal from a selected particle at point excitation by TCSPC, and then get the LSM-image of the field with the studied particles. Figure 6 shows kinetic curves decay regions of upconversion luminescence for 525 nm , 545 nm (green spectral range) and 665 nm (red spectral range) transitions, obtained from the same microparticle of the studied sample using both streak-camera and LSM. Fig. 6The decay curves from upconversion microparticles obtained using LSM in comparison with decay curves registered using TCSPC. The upconversion luminescence of decay curves for electronic transitions and (525 and 545 nm, green spectral range) and (665 nm, red spectral range), obtained from the same microparticle at 980-nm excitation using both LSM and TCSPC methods.  As evident from the provided graphs and Table 1, the reproducibility of results is on a sufficiently high level. Table 1The comparison of data for 2-μm NaY0.895Yb0.1Er0.005F4 particle, obtained by the approximation of the streaking effect signal from NDD and kinetics, registered using streak-camera, TCSPC method.
The maximum variation in value of the obtained is about 13% for the sample with the lowest quantum yield. When using the TCSPC method, in order to provide the required accuracy, it is necessary to accumulate the signal for a long time, about 1.5 to 2 h, which makes the process of obtaining the experimental data slow and time-consuming. The method of obtaining the luminescence kinetics from upconversion microparticles using LSM is pretty quick. The image with kinetics is registered by a single scan of the targeted area with maximum speed, which takes about 2 min and there is no need to measure upconversion luminescence lifetime using external techniques. All distribution function parameters necessary for deconvolution are calculated from the distorted image (Sec. 2.4). Thus, it becomes possible to account for the dependence of the upconversion luminescence lifetime on the size of the particle, as well as the properties of the microenvironment, which allows for greatly increased spatial resolution of the image and can be helpful when using upconversion nanoparticles as biosensors and temperature sensors. In addition, the algorithm has been optimized in such way that deconvolution happens not for each point of the image, but only for the area that showed the corresponding distribution, which allows for the reduction of calculation time and computational complexity. Upon obtaining the LSM-image, which consists of the series of images from different channels that are registered by different detectors in different spectral ranges, it is possible to analyze the signal intensity profile from individual microparticles as mentioned above, or using the method of signal deconvolution for any of NDD channels and receive the final image that contains the information about the precise location of the microparticle, the intensity and the upconversion luminescence lifetime of individual electronic transitions. To demonstrate the approach of using the upconversion nanoparticles as probes for the microenvironment on the presence of ions and molecules, we examined the upconversion luminescence lifetime for microparticles doped with , treated under different conditions: dried at 600°C in a normal atmospheric in dry powder and as an aqueous colloid; dried at a temperature of 600°C in an carbon atmosphere inside the graphite melting pot. From the obtained data (Table 2), it follows that the presence of both ions and molecules on the microparticles’ surface leads to a reduction in the upconversion luminescence decay time for transitions in the green spectral region and . Table 2The upconversion luminescence decay times for 2-μm Sr0.955Yb0.02Er0.025F2.045 particles at different surface microenvironment conditions, measured using LSM-method in two spectral ranges.
The presence of ions reduces the decay time of luminescence in green range by that is about 10% of the initial value. It is caused by a decrease of the radiative level population through a multiphonon relaxation process caused by vibrations (Fig. 1). The same process leads to an increase in the radiative level population in the red spectral range, and results in the increase of decay time by that is about 5% of the initial value. The presence of molecules reduces the decay time by in the green range that is about 25% of the initial value and by in the red range that is about 3% of the initial value, correspondingly. Using the method of kinetics registration by LSM, we managed to visualize the accumulation of nanoparticles in biological objects and simultaneously measure the lifetime of upconversion luminescence for these particles. Figure 7 shows the transmission and the upconversion luminescence images of THP-1 cells treated with the upconversion microparticles before and after deconvolution. Fig. 7A demonstration of the streaking effect on the LSM images of THP-1 cells with the mix of microparticles doped with -and - ion pairs. The color images registered by NDD at 980-nm excitation are combined with gray transmitted light image: (a) before and (b) after the deconvolution procedure. Image acquisition parameters were pixel dwell time, frame , field of view, the excitation power density . On the final image, every particle has been assigned a color according to the lifetime color scale obtained from the PSF analysis for each NDD.  The results for two approximately equal large microparticles with different dopants ions are shown in the inset, the upper microparticle contains , and the lower contains . Images after deconvolution for each NDD are colored according to the color time scale. Thus, a particle doped with has a different color and a different decay time of the upconversion luminescence, respectively, in all three measured spectral ranges. The decay times for doped particles within the image amounted to 500 to in blue (), 150 to in green (), and 700 to in red () spectral ranges. The scheme of the electronic levels for the ion pair is provided in Fig. 8. The decay times for doped particles amounted to 100 to in green and 500 to in red spectral ranges. If the particle gets inside the cell, the modification of their surface could occur and in this case luminescence decay time changes. Thus, from the original image consisting of the luminescence intensity in different spectral ranges only by means of subsequent computer processing, the characteristic luminescence lifetimes are extracted, which are important information parameters. 4.ConclusionThe kinetics of upconversion luminescence allow determining the upconversion luminescence rise and decay times, and decide which processes are involved in the population and depopulation of levels from which the luminescence occurs, and analyzing the interaction of microparticles with the environment. Upconversion nanoparticles, being chemically inert, can be good sensors for temperature and illumination in LSM. The principal possibility of using the upconversion nanoparticles without cover as probes for microenvironment was demonstrated in this work. When using a mix of particles with different sizes, it is possible to evaluate not only the characteristics of the individual submicron particles themselves but also to estimate size-dependent particle penetration into different cell compartments. However, with regards to bioapplication use, one should be aware of the possible toxicity of the uncoated nanoparticles. It has been shown that uncoated nanoparticles could be unstable in acidic physiological fluids (e.g., lysosomes).41 In order to improve the upconversion nanoparticles’ safety, surface modifications should be used. It is possible to rationally design nanoparticles with optimal shell thickness, which will be not toxic on the one hand, and on the other hand will be sufficiently sensitive to the presence of quenchers. Suggested method of streaking effect deconvolution allows extracting the intensity and kinetic characteristics for individual energy levels of upconversion microparticles from LSM images. Comparison of the results obtained using this method with the results from TCSPC demonstrated their good correlation, the maximum variation in values was 13%. The method has high sensitivity even to weak signals, and does not require long-time signal accumulation which allows using it for obtaining images with good spatial resolution. AppendicesAppendix:X-Ray Diffraction and Scanning Electron MicroscopeFor XRD measurements of the synthesized samples Bruker D8 Advance diffractometer ( irradiation; Bragg-Brentano geometry; TOPAS software) was used. The studied fluoride particles , doped with and ion pairs have fluorite structure, cubic phase. Typical XRD patterns of such specimens, dried at 600°C (Fig. 9), demonstrated their single-phase character and did not contain additional lines that could be attributed to other phase(s), i.e., proved absence of polymorphous transitions and/or pyrohydrolysis. Fig. 9XRD patterns for synthesized (a) and (b) nanopowder specimens dried at 600°C. Numbers at the peaks correspond to hkl Miller indices.  The NVision 40 workstation and Tescan MIRA-3 SEM were used to record SEM images of the formed nanoparticles. After the synthesis by the method of precipitation from aqueous solutions, the size of the particles was between 50 and 300 nm (Figs. 10 and 11). After the subsequent annealing at 600°C, the upconversion powders contained the indivisible aggregates with size of 2 to (e.g., Figs. 12 and 13). AcknowledgmentsThis work was supported by a grant from the OPTEC Company in 2013, “The investigation of the upconversion nanoparticles luminescence kinetics depending on the nanoparticles composition and biological microenvironment”; RFBR #15-32-21152-mol-a-ved; MES RF, agreement #14.604.21.0014 from 17/06/2014 (RFMEFI60414X0014), Agreement MK-3133.2014.2; FP7-PEOPLE-2013-IRSES No. 612620. ReferencesD. Gamelin, H. Gudel,
“Upconversion processes in transition metal and rare earth metal systems,”
Transition Metal and Rare Earth Compounds, 214 1
–56 Springer, Berlin/Heidelberg
(2001). Google Scholar
C. T. Xu et al.,
“Upconverting nanoparticles for pre-clinical diffuse optical imaging, microscopy and sensing: current trends and future challenges,”
Laser Photonics Rev., 7
(5), 663
–697
(2013). http://dx.doi.org/10.1002/lpor.2013.7.issue-5 Google Scholar
M. Yu et al.,
“Laser scanning up-conversion luminescence microscopy for imaging cells labeled with rare-earth nanophosphors,”
Anal. Chem., 81 930
–935
(2009). http://dx.doi.org/10.1021/ac802072d ANCHAM 0003-2700 Google Scholar
G. Chen and G. Han,
“Theranostic upconversion nanoparticles,”
Theranostics, 3
(4), 289
–291
(2013). http://dx.doi.org/10.7150/thno.6382 Google Scholar
G. Shan, R. Weissleder and S. A. Hilderbrand,
“Upconverting organic dye doped core-shell nano-composites for dual-modality NIR imaging and photo-thermal therapy,”
Theranostics, 3
(4), 267
–274
(2013). http://dx.doi.org/10.7150/thno.5226 Google Scholar
Y. Zhou et al.,
“Inorganic–organic hybrid nanoprobe for NIR-excited imaging of hydrogen sulfide in cell cultures and inflammation in a mouse model,”
Small, 10
(23), 4874
–4885
(2014). http://dx.doi.org/10.1002/smll.v10.23 SMALBC 1613-6810 Google Scholar
A. Pandey et al.,
“Upconversion based temperature sensing ability of Er3+–Yb3+ codoped SrWO4: an optical heating phosphor,”
Sens. Actuators, B, 209 352
–358
(2015). http://dx.doi.org/10.1016/j.snb.2014.11.126 SABCEB 0925-4005 Google Scholar
S. S. Lucky et al.,
“Titania coated upconversion nanoparticles for near-infrared light triggered photodynamic therapy,”
ACS Nano, 9
(1), 191
–205
(2015). http://dx.doi.org/10.1021/nn503450t ANCAC3 1936-0851 Google Scholar
C.-C. Mi et al.,
“Microwave-assisted one-pot synthesis of water-soluble rare-earth doped fluoride luminescent nanoparticles with tunable colors,”
J. Alloys Compd., 525
(5), 154
–158
(2012). http://dx.doi.org/10.1016/j.jallcom.2012.02.095 Google Scholar
C. Wang et al.,
“Simultaneous isolation and detection of circulating tumor cells with a microfluidic silicon-nanowire-array integrated with magnetic upconversion nanoprobes,”
Biomaterials, 54 55
–62
(2015). http://dx.doi.org/10.1016/j.biomaterials.2015.03.004 BIMADU 0142-9612 Google Scholar
C. Mi et al.,
“Novel microwave-assisted solvothermal synthesis of NaYF4:Yb, Er upconversion nanoparticles and their application in cancer cell imaging,”
Langmuir, 27
(23), 14632
–14637
(2011). http://dx.doi.org/10.1021/la204015m LANGD5 0743-7463 Google Scholar
U. Kostiv et al.,
“Silica-modified monodisperse hexagonal lanthanide nanocrystals: synthesis and biological properties,”
Nanoscale, 7 18096
–18104
(2015). http://dx.doi.org/10.1039/C5NR05572E NANOHL 2040-3364 Google Scholar
J. Zhang et al.,
“Synthesis of NaYF4:Yb/Er/Gd up-conversion luminescent nanoparticles and luminescence resonance energy transfer-based protein detection,”
Anal. Biochem., 421
(2), 673
–679
(2012). http://dx.doi.org/10.1016/j.ab.2011.11.008 ANBCA2 0003-2697 Google Scholar
D. H. Kim, J. U. Kang,
“Review: upconversion microscopy for biological applications,”
Microscopy: Science, Technology, Applications and Education, 1 571
–582 Formatex, Badajoz
(2010). Google Scholar
F. Auzel,
“Upconversion and anti-Stokes processes with f and d ions in solids,”
Chem. Rev., 104
(1), 139
–174
(2004). http://dx.doi.org/10.1021/cr020357g Google Scholar
J. F. Suyver et al.,
“Anomalous power dependence of sensitized upconversion luminescence,”
Phys. Rev. B, 71 125123
(2005). http://dx.doi.org/10.1103/PhysRevB.71.125123 Google Scholar
S. W. Wu et al.,
“Non-blinking and photostable upconverted luminescence from single lanthanide-doped nanocrystals,”
Proc. Natl. Acad. Sci., 106
(27), 10917
–10921
(2009). http://dx.doi.org/10.1073/pnas.0904792106 Google Scholar
A. D. Ostrowski et al.,
“Controlled synthesis and single-particle imaging of bright, sub-10 nm lanthanide-doped upconverting nanocrystals,”
ACS Nano, 6
(3), 2686
–2692
(2012). http://dx.doi.org/10.1021/nn3000737 ANCAC3 1936-0851 Google Scholar
M. Nyk et al.,
“High contrast in vitro and in vivo photoluminescence bioimaging using near infrared to near infrared up-conversion in TM3+ and Yb3+ doped fluoride nanophosphors,”
Nano Lett., 8
(11), 3834
–3838
(2008). http://dx.doi.org/10.1021/nl802223f NALEFD 1530-6984 Google Scholar
O. Meza et al.,
“Dynamics of the green and red upconversion emissions in Yb3+-Er3+codoped Y2O3 nanorods,”
J. Nanomater., 2010 491982
(2010). http://dx.doi.org/10.1155/2010/491982 1687-4110 Google Scholar
G. Liu,
“Advances in the theoretical understanding of photon upconversion in rare-earth activated nanophosphors,”
Chem. Soc. Rev., 44 1635
–1652
(2015). http://dx.doi.org/10.1039/C4CS00187G Google Scholar
A. Nadort, J. Zhaob and E. M. Goldys,
“Lanthanide upconversion luminescence at the nanoscale: fundamentals and optical properties,”
Nanoscale, 8 13099
–13130
(2016). http://dx.doi.org/10.1039/C5NR08477F NANOHL 2040-3364 Google Scholar
F. Vetrone et al.,
“Significance of Yb3+ concentration on the upconversion mechanisms in codoped Y2O3: Er3+, Yb3+ nanocrystals,”
J. Appl. Phys., 96 661
–667
(2004). http://dx.doi.org/10.1063/1.1739523 JAPIAU 0021-8979 Google Scholar
S. F. Lim, W. S. Ryu and R. H. Austin,
“Particle size dependence of the dynamic photophysical properties of NaYF4:Yb, Er nanocrystals,”
Opt. Express, 18
(3), 2309
–2316
(2010). http://dx.doi.org/10.1364/OE.18.002309 Google Scholar
R. Li et al.,
“Enhancing the imaging and biosafety of upconversion nanoparticles through phosphonate coating,”
ACS Nano, 9
(3), 3293
–3306
(2015). http://dx.doi.org/10.1021/acsnano.5b00439 ANCAC3 1936-0851 Google Scholar
C. G. Morgan and A. C. Mitchell,
“Prospects for applications of lanthanide-based upconverting surfaces to bioassay and detection,”
Biosens. Bioelectron., 22
(8), 1769
–1775
(2007). http://dx.doi.org/10.1016/j.bios.2006.08.024 BBIOE4 0956-5663 Google Scholar
Y. Lu et al.,
“Tunable lifetime multiplexing using luminescent nanocrystals,”
Nat. Photonics, 8 32
–36
(2014). http://dx.doi.org/10.1038/nphoton.2013.322 NPAHBY 1749-4885 Google Scholar
J. Pichaandi et al.,
“Two-photon upconversion laser (scanning and wide-field) microscopy using Ln3+-doped NaYF4 upconverting nanocrystals: a critical evaluation of their performance and potential in bioimaging,”
J. Phys. Chem. C, 115
(39), 19054
–19064
(2011). http://dx.doi.org/10.1021/jp206345j Google Scholar
Q. Zhan et al.,
“Optimization of optical excitation of upconversion nanoparticles for rapid microscopy and deeper tissue imaging with higher quantum yield,”
Theranostics, 3
(5), 306
–316
(2013). http://dx.doi.org/10.7150/thno.6007 Google Scholar
S. Trautmann et al.,
“Fluorescence lifetime imaging (FLIM) in confocal microscopy applications: an overview,”
Berlin, Germany
(2013). Google Scholar
R. W. Wood,
“The time interval between absorption and emission of light in fluorescence,”
Proc. R. Soc. A: Math., Phys. Eng. Sci., 99 362
–371
(1921). http://dx.doi.org/10.1098/rspa.1921.0049 Google Scholar
B. T. Jones et al.,
“A Becquerel-disc phosphoroscope for the measurement of lifetimes in room-temperature phosphorimetry,”
Talanta, 35 647
–650
(1988). http://dx.doi.org/10.1016/0039-9140(88)80147-4 TLNTA2 0039-9140 Google Scholar
V. Nuñez et al.,
“Microfluidic space-domain time-resolved emission spectroscopy of terbium(III) and europium(III) chelates with pyridine-2, 6-dicarboxylate,”
Anal. Chem., 85 4567
–4577
(2013). http://dx.doi.org/10.1021/ac400200x ANCHAM 0003-2700 Google Scholar
C. F. Gainer, U. Utzinger and M. Romanowski,
“Scanning two-photon microscopy with upconverting lanthanide nanoparticles via Richardson-Lucy deconvolution,”
J. Biomed. Opt., 17
(7), 076003
(2012). http://dx.doi.org/10.1117/1.JBO.17.7.076003 JBOPFO 1083-3668 Google Scholar
S. V. Kuznetsov et al.,
“Synthesis and luminescent characteristics of submicron powders on the basis of sodium and yttrium fluorides doped with rare earth elements,”
Nanotechnol. Russ., 7
(11–12), 615
–628
(2012). http://dx.doi.org/10.1134/S1995078012060067 Google Scholar
A. V. Ryabova et al.,
“Spectroscopic research of upconversion nanomaterials based on complex oxide compounds doped with rare-earth ion pairs: benefit for cancer diagnostics by upconversion fluorescence and radio sensitive methods,”
Photonics Lasers Med., 2
(2), 117
–128
(2013). http://dx.doi.org/10.1515/plm-2013-0013 Google Scholar
M. Marin-Dobrincic, E. Cantelar and F. Cusso,
“Temporal dynamics of IR-to-visible up-conversion in LiNbO3:Er3+/Yb3+: a path tophosphors with tunable chromaticity,”
Opt. Mater. Express, 2 1529
–1537
(2012). http://dx.doi.org/10.1364/OME.2.001529 Google Scholar
J. F. Suyver et al.,
“Novel materials doped with trivalent lanthanides and transition metal ions showing near-infrared to visible photon upconversion,”
Opt. Mater., 27
(6), 1111
–1130
(2005). http://dx.doi.org/10.1016/j.optmat.2004.10.021 Google Scholar
M. Pollnau et al.,
“Power dependence of upconversion luminescence in lanthanide and transition-metal-ion systems,”
Phys. Rev. B, 61
(5), 3337
–3346
(2000). http://dx.doi.org/10.1103/PhysRevB.61.3337 Google Scholar
J. Fisher et al.,
“Spectroscopic imaging and power dependence of near-infrared to visible upconversion luminescence from NaYF4:Yb3+, Er3+ nanoparticles on nanocavity arrays,”
J. Phys. Chem. C, 119
(44), 24976
–24982
(2015). http://dx.doi.org/10.1021/acs.jpcc.5b06969 JPCCCK 1932-7447 Google Scholar
R. Li et al.,
“Enhancing the imaging and biosafety of upconversion nanoparticles through phosphonate coating,”
ACS Nano, 9
(3), 3293
–3306
(2015). http://dx.doi.org/10.1021/acsnano.5b00439 ANCAC3 1936-0851 Google Scholar
|
|||||||||||||||||||||||||||||||||||||||||||||||||||||


