
|
|
1.IntroductionConfocal laser scanning microscopy (LSM) has enabled impressive three-dimensional fluorescence imaging. Furthermore, in the case of two-photon excitation LSM (2P-LSM), fluorescent molecules are excited within a very small focal volume.1,2 This high degree of localization in the 2P method enables cross-sectional fluorescence imaging in the absence of a confocal aperture. In addition, near-infrared laser light used for 2P processes is barely absorbed by or scattered in a biospecimen. 2P-LSM can three-dimensionally visualize deep regions within a biospecimen because of these advantages. However, a mismatch of refractive indices in an optical path can induce wavefront aberrations, which degrades the spatial resolution and fluorescence signal of an image.3,4 Spatial light modulators have been shown to correct these aberrations and improve the image quality of biospecimens.5,6 However, these reflective spatial light modulators require the user to change the basic design of an optical path in a conventional microscope. Transmissive liquid-crystal devices have been used in various applications, e.g., radially polarized beam generators, holographic microscopes, stimulated emission depletion microscopes, and optical pickups, to modulate light waves.7–11 These liquid-crystal devices consist of liquid-crystal cells (LCCs), wherein a layer of liquid-crystal molecules is sandwiched between a pair of glass substrates equipped with transparent electrodes.12 These liquid-crystal molecules exhibit directional refractive-index anisotropy that is electrically controllable; therefore, a segmented pattern of a transparent electrode generates a phase distribution that corresponds to the segmented pattern in the wavefront of penetrating light. Phase modulation is controlled by changing the applied voltage. We previously reported a transmissive liquid-crystal device that can compensate for spherical aberrations.13,14 Spherical aberrations are predominant aberrations produced during observations of deep regions in samples and are usually caused by refractive-index differences between a sample and immersion medium.15 This device, which is inserted between the objective lens and revolver of a microscope for correcting spherical aberrations, improved the quality of fluorescence images of deep regions in a fixed-mouse-brain slice treated by an optical clearing reagent in 2P-LSM. However, asymmetric aberrations can also be induced by the shape of a biospecimen and/or a complicated refractive-index distribution in the sample; they can degrade optical performance considerably, even near the sample surface.16 Aberrations in biospecimens and their effects have been experimentally investigated by several authors.17–19 Further, wavefront aberrations can be described using Zernike polynomials.20 Low-order Zernike aberrations, such as primary coma aberration and astigmatism, increase wavefront variance, degrading the Strehl ratio of an optical system considerably. Furthermore, specimen-induced aberrations tend to be dominated by these low-order Zernike aberrations. In the current study, we developed a transmissive liquid-crystal device that can compensate for four low-order asymmetric aberrations: astigmatism in the 0-deg and 45-deg directions, and primary coma aberration in the 0-deg and 90-deg directions [Astig(0), Astig(45), Coma(0), and Coma(90), respectively].21 The device experimentally succeeded in improving the spatial resolution and fluorescence signal (which was originally degraded by asymmetric aberrations) of a bead image under a tilted cover slip and in a cylindrical glass capillary using single-photon excitation LSM (1P-LSM). In this study, we compared this experimental result in 1P-LSM with the numerically calculated results. Furthermore, in preparation for using the device to observe a biospecimen, we observed the bead samples and confirmed the correction effect of the device in 2P-LSM. Finally, we used the device to observe a biospecimen using 2P-LSM. In conclusion, we experimentally demonstrated that the device enhanced the image quality of the biospecimen with a sloping surface shape and a complicated internal refractive-index distribution. 2.Theory and Methods2.1.Function of Transmissive Device for Correcting Asymmetric AberrationsThe device was composed of four laminated LCCs (A0-LCC, A45-LCC, C0-LCC, and C90-LCC) compensating for Astig(0), Astig(45), Coma(0), and Coma(90), respectively. The effective optical diameter of the LCCs was 17.6 mm, which was almost equal to the calculated pupil diameter of the objective lens described later. Each LCC corrected the Zernike aberration of the Zernike coefficient within and for wavelengths of 488 nm and 900 to 910 nm, respectively, which were used for the excitations in the observations described later. The segmented transparent electrodes were formed in one of the two glass substrates in A0-LCC to generate the phase distribution required to correct Astig(0) [Figs. 1(a) and 1(b)]. Similarly, the segmented transparent electrodes for correcting Astig(45), Coma(0), and Coma(90) were formed in A45-LCC, C0-LCC, and C90-LCC, respectively [Figs. 1(c)–1(h)]. In each LCC, the segmented electrodes generated a 32-level quantized phase distribution. We applied voltages to the LCCs as required to generate the Astig(0), Astig(45), Coma(0), and Coma(90) components of the Zernike coefficients (, , , and , respectively) shown in Fig. 1(i), and the phase distribution generated in the four laminated LCCs was measured using a laser interferometer (Zygo PTI 250, Zygo Corporation). When we applied voltage to A0-LCC as required to generate an Astig(0) component of , the device showed the phase distribution of Astig(0) [Fig. 1(i)]. When we applied a voltage only to A45-LCC (), the phase distribution of the device agreed very well with that of Astig(45). Furthermore, we confirmed that the direction of the astigmatic component was rotated by applying a voltage and changing the ratio between the voltages applied to A0-LCC and A45-LCC. For example, when voltages were applied to A0-LCC and A45-LCC as required to generate a phase distribution with the same-magnitude Zernike coefficients (), the device showed the astigmatic component to be in the 22.5-deg direction. Similarly, C0-LCC of and C90-LCC of showed Coma(0) and Coma(90) phase distributions, respectively. When using C0-LCC and C90-LCC (), the device showed the coma component to be in the 45-deg direction. Fig. 1The function of the transmissive device for correcting asymmetric aberrations. (a), (c), (e), and (g) Phase distributions of Astig(0), Astig(45), Coma(0), and Coma(90), respectively. (b), (d), (f), and (h) Schematics of electrode patterns in A0-LCC, A45-LCC, C0-LCC, and C90-LCC, respectively. (i) Actual phase distributions of the device.  2.2.Observation Optical SystemObservations were conducted using an upright microscope (ECLIPSE FN1, Nikon) equipped with a water-immersion/dipping objective lens (CFI Apo LWD 25XW, NA1.1, Nikon) and a confocal scanner (A1R MP+, Nikon), with excitation wavelengths of 488, 900, and 910 nm. In this study, the confocal pinhole aperture was opened completely. The device, with a thickness of 13 mm, was simply inserted between the objective lens and the microscope revolver [Fig. 2(a)]. The device was controlled by applying a voltage via a drive circuit. Figure 2(b) shows the transmittance of the LCC. For the wavelength range 900 to 910 nm, which was used for excitation in 2P-LSM, the transmittance of the LCC was 97%. For the wavelength range 460 to 600 nm, which was used for the fluorescence measurements and excitation in 1P-LSM, the LCC’s transmittance was 92% to 95%. The transmittance of the device composed of the four LCCs was 88% and 72% to 81% for 900- to 910-nm and 460- to 600-nm light, respectively. Fig. 2Experimental setup. (a) Configuration of laser scanning microscope with the liquid-crystal device, and the actual photograph of the device installed between the microscope revolver and the objective lens. (b) Transmittance of the LCC. (c) Schematic of the tilt-sample. The fluorescence beads were placed under the cover slip at tilt angle in the direction. (d) Schematic of the cyl-sample. The fluorescence beads were placed into the cylindrical glass capillary with the longitudinal direction of .  2.3.Sample Preparation and AnalysisFluorescent yellow-green beads with a diameter of were mixed into agarose gel with a refractive index of 1.333. The agarose gel containing the fluorescence beads was poured into a glass-bottom dish, attached with a 0.16- to 0.19-mm thick cover slip at the bottom. The glass-bottom dish was placed upside down on a goniometer stage. We thus observed the beads in the gel through the tilting cover slip. The tilt angle and direction of the cover slip were defined by those of the goniometer stage [tilt-sample in Fig. 2(c)]. The predominant aberrations while observing this tilt-sample were estimated as the primary coma aberration and a certain astigmatism. Meanwhile, melted agar containing beads was sucked into the cylindrical glass capillary with an outer diameter of 0.1 mm and a glass thickness of 0.01 mm (Mark-tube made of soda lime glass, Hilgenberg GmbH). The capillary was fixed on the bottom of the glass-bottom dish and immersed in water [cyl-sample in Fig. 2(d)]. The predominant aberration in the cyl-sample was estimated to be caused by astigmatism while observing the bead located at the center of the capillary. The fluorescence intensity profiles of the bead image across the intensity center along the -, -, and -axes were fitted with a Breit–Wigner–Fano line shape. The average of the approximate curves for five or more bead images was obtained, and the average peak intensities and the average full width at half maximum values along each axis (, , and ) were measured from the average curves. Thy1-YFP-H mice22 were anesthetized with pentobarbital sodium. They were transcardially perfused with phosphate-buffered saline (PBS) followed by 4% formaldehyde in PBS, and their brains were removed. The fixed whole brain was adhered to the bottom of the glass-bottom dish and immersed in PBS. We observed the cortical layer V neurons under a thick blood vessel at the surface of the cerebral cortex of the left brain. The sloping surface shape of the whole brain was estimated to induce the asymmetric aberration. Furthermore, astigmatism was estimated to be induced, especially under the blood vessel. To estimate the spatial resolution in the sample, we utilized dendritic spines with a size smaller than the spatial resolution. The fluorescence intensity profiles of the dendritic spine image across the intensity center along the -, -, and -axes were fitted with a Breit–Wigner–Fano line shape, and the peak intensities and the FWHM values were measured. All animal experiments were performed in accordance with the National University Corporation Hokkaido University Regulations on Animal Experimentation and the Guidelines for Proper Conduct of Animal Experiments (Science Council of Japan). The protocol was approved by the Institutional Animal Care and Use Committee of National University Corporation Hokkaido University (Permit Number: 15-0021). 2.4.Numerical Calculation Using the Object Lens SystemThe point spread function (PSF) of the 488-nm wavelength -polarized collimated light beam with a top-hat intensity distribution was numerically calculated using the beamlet-based wave propagation algorithm (CODEV, Synopsys, Inc.) under the assumption that light was focused through a continuous phase distribution and a 25x/NA1.1 water-dipping objective lens (JP2011-75982A). In this calculation, the continuous phase distribution was placed in a plane perpendicular to the optical axis, 10 mm away from the front of the objective lens along the -axis (which is where the device was actually placed in the experiment). 3.Results3.1.Numerically Calculated Point Spread Function at 488-nm WavelengthFirst, to estimate the correction effect of the device, we numerically calculated the PSF images under a tilted cover slip and in a glass cylinder. The , , and values of the PSF for the sample without any aberrations were 0.23, 0.28, and , respectively [Figs. 3(a)–3(b)]. The difference in the FWHM values between the - and -axes was induced by the polarization direction of incident light. Fig. 3Numerically calculated PSF images at a wavelength of 488 nm. (a) Lateral and axial images without aberrations. (c) and (d) Lateral and axial images under the cover slip at tilt angle in the direction (c) before and (d) after correction. (f) and (g) Lateral and axial images in the glass cylinder with longitudinal direction of (f) before and (g) after correction. Panels (b), (e), and (h) show intensity profiles of the PSF images in (a), (c), (d), (f), and (g), respectively, across the center of the intensity distributions along the -, -, and -axes. The scale bars denote . 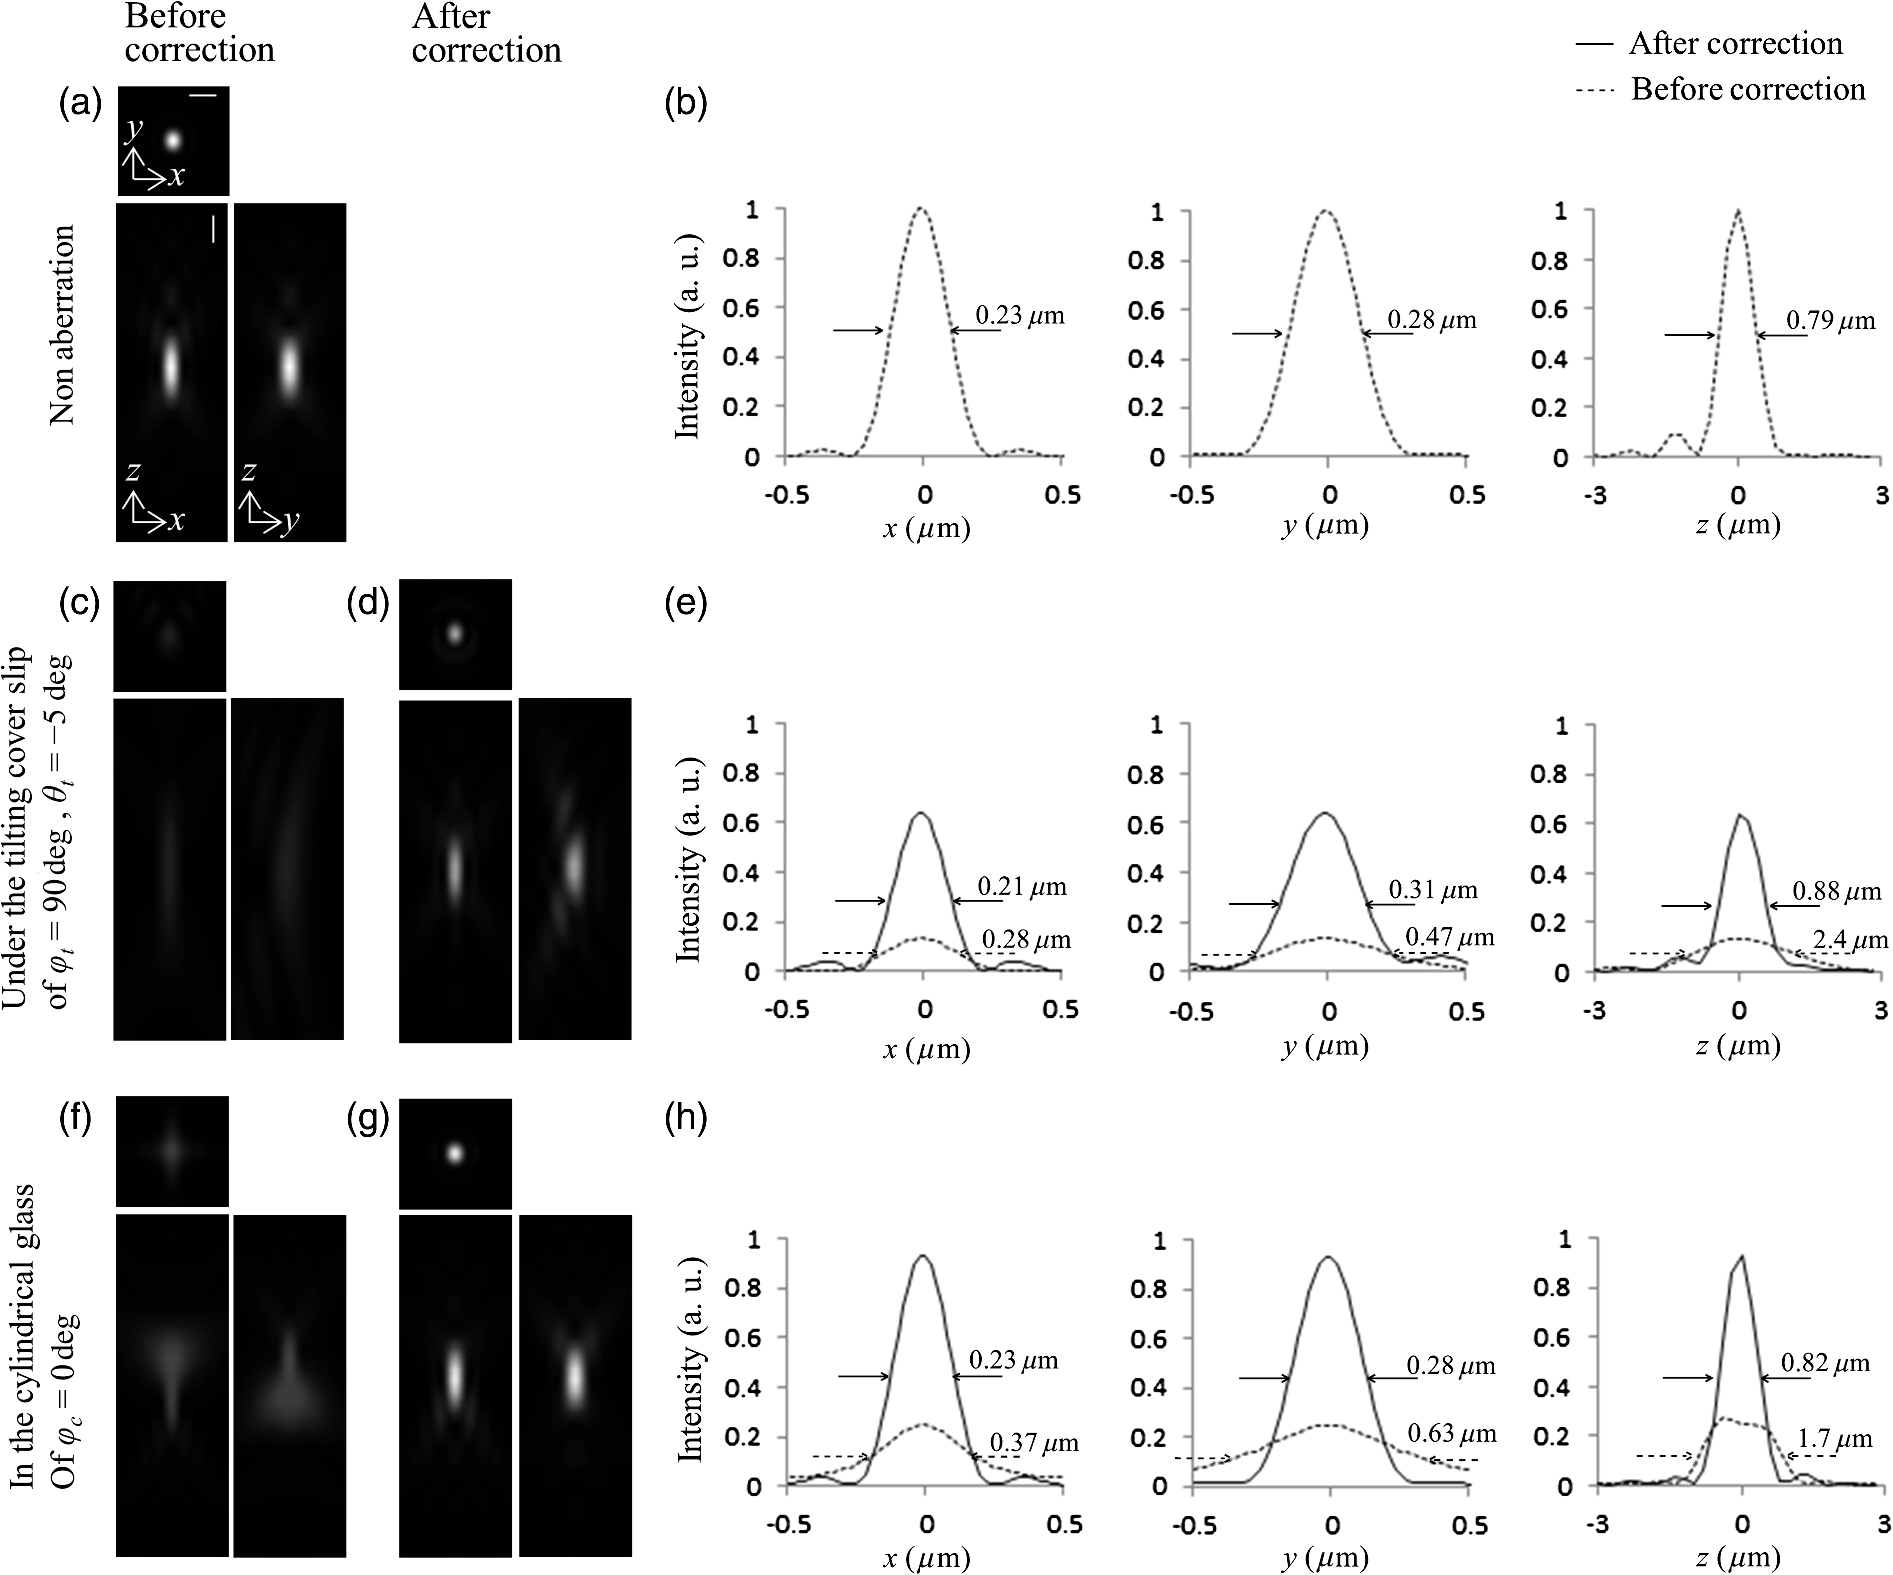 When incident light was focused through a 0.17-mm thick cover slip inclined at in the direction (-axis), the predominant aberrations were Coma(90) of , Astig(0) of , and a second coma aberration with a Zernike coefficient of . The peak intensity of the PSF dropped to 13% of the value for the sample without aberrations (). Additionally, the and the values degraded to 0.47 and , respectively [Figs. 3(c)–3(e)]. After correction with the phase distribution of and , the and the values improved to 0.31 and , respectively. The peak intensity was increased to 64% of ; i.e., the peak intensity was higher than that of the aberrated image. The correction improved the intensity and the FWHM values of the aberrated PSF under the tilted cover slip. However, the PSF was not recovered completely because of the residual second coma aberration. Next, we numerically calculated the PSF images in a glass cylinder with an outer diameter of 0.1 mm and a glass thickness of 0.01 mm, which longitudinally directed in the direction (-axis). The predominant aberration was Astig(0) of . After correction with a phase distribution of , the peak intensity was improved to 93% from 25% ; i.e., the peak intensity was higher than that of the aberrated image [Figs. 3(f)–3(h)]. Furthermore, the and the values decreased to from , and to from , respectively. The value decreased to from . The FWHM values of the corrected PSF were nearly equal to those without aberrations, and the peak intensity was recovered almost completely with the correction. 3.2.Imaging of Beads With Single-Photon Excitation Laser Scanning MicroscopyThe correction effect of the device was experimentally evaluated by 1P-LSM illuminated with 488-nm laser light. First, we observed the tilt-sample, i.e., the fluorescence beads under the tilted cover slip. Under different observation conditions, we observed several beads within a cubed volume located at the center of the field of view; the average peak intensity and the average FWHM of those images were obtained. Before correction by the device, the optical system had an inherent coma aberration in the direction (-axis), and, consequently, the highest quality of the bead image was obtained when the cover slip was inclined at in the direction. Therefore, when we say that the cover slip was inclined at in the direction of (-axis), then the tilting angle is actually relative to , at which the highest quality of the bead image was obtained without correction. In the case of a tilt angle of in the direction of , we first applied a voltage to C90-LCC to correct Coma(90). By varying the voltage applied to C90-LCC repeatedly, we determined the appropriate voltage required to achieve the maximum fluorescence signal. After correction by C90-LCC, the bead image showed an astigmatic point spread function in the 0-deg direction. Therefore, we next applied a voltage to A0-LCC to correct the residual Astig(0). The Zernike coefficients of the phase distributions generated in each LCC, which were required to achieve the maximum fluorescence signal, were and (Table 1). Our device thus improved the spatial resolution and the fluorescence signal in the aberrated bead image by using C90-LCC and A0-LCC [Figs. 4(a)–4(b)]. The value improved to from . Furthermore, the value improved to from , and the fluorescence peak intensity of the corrected image was higher than that of the aberrated image [Fig. 4(c)]. Moreover, in the case of a tilt angle of and tilt direction of , C0-LCC, C90-LCC, A0-LCC, and A45-LCC corrected both the primary coma and astigmatism in the direction and the system’s inherent aberration. The image quality improved, as shown in Figs. 4(d)–4(f), and the peak intensity was higher than that of the aberrated image. Thus, the device improved the spatial resolution and the fluorescence signal, which were degraded by the cover slip with various tilting angles and directions. Table 1Zernike coefficients of the phase distributions generated in each LCC during observation of the tilt-sample.
Fig. 4Images of fluorescence beads in the tilt-sample in 1P-LSM illuminated with 488-nm wavelength laser light. (a) and (b) Lateral and axial images of and (a) before and (b) after correction. Panel (c) shows the average intensity profiles and the average curves of seven bead images with and across the center of the intensity distributions along the -, -, and -axes. (d) and (e) Lateral and axial images of and (d) before and (e) after correction. Panel (f) shows the average intensity profiles and the average curves of six bead images with and across the center of the intensity distributions along the -, -, and -axes. The scale bars denote .  Next, the correction for astigmatism was evaluated by observing the cyl-sample, i.e., the fluorescence beads in the cylindrical glass capillary. When the capillary was longitudinally directed in the direction, we first applied a voltage to A0-LCC to correct Astig(0), after which we corrected the system’s inherent Coma(90) by C90-LCC (Table 2). For correcting each aberration, we determined the appropriate voltages required to achieve the maximum fluorescence signal by varying the voltages applied to each LCC. The adjustment of the applied voltages to each LCC was performed in the above-mentioned order by only one round. Thus, Figs. 5(a)–5(b) demonstrate the improvement in the spatial resolution and the fluorescence signal in the corrected image. The device improved the and values to from and to from , respectively. The value was reduced to from and the peak intensity was higher than that of the aberrated image [Fig. 5(c)]. Furthermore, in the case of the capillary’s longitudinal direction of , A0-LCC and A45-LCC corrected the astigmatism in the direction, and C90-LCC corrected the system’s inherent Coma(90), as shown in Figs. 5(d)–5(f). For correcting each aberration, we determined the appropriate voltages required to achieve the maximum fluorescence signal by varying the voltages applied to each LCC. The adjustment of the applied voltages to each LCC was performed by only one round. The peak intensity of the corrected images was higher than that of the aberrated images. Thus, the device improved the spatial resolution and fluorescence signal, which were degraded in the cylindrical glass capillary in various directions. Table 2Zernike coefficients of the phase distributions generated in each LCC during observation of the cyl-sample.
Fig. 5Images of fluorescence beads in the cyl-sample in 1P-LSM illuminated with 488-nm wavelength laser light. (a) and (b) Lateral and axial images of (a) before and (b) after correction. Panel (c) shows the average intensity profiles and the average curves of the five bead images with across the center of the intensity distributions along the -, -, and -axes. (d) and (e) Lateral and axial images of (d) before and (e) after correction. Panel (f) shows the average intensity profiles and the average curves of seven bead images with across the center of the intensity distributions along the -, -, and -axes. The scale bars denote .  3.3.Imaging of Beads With Two-Photon Excitation Laser Scanning MicroscopyBefore using the device to observe a biospecimen via 2P-LSM, we tested the device in 2P-LSM illuminated by 900-nm wavelength laser light and observed the fluorescence beads to confirm the correction effect of the device. Figures 6(a)–6(b) show the images of a fluorescence bead under the cover slip at the tilt angle of in the direction (the tilt-sample). As with the observation in 1P-LSM, C90-LCC and A0-LCC corrected Coma(90) and Astig(0) induced by the tilted cover slip as well as the system’s inherent Coma(90). The Zernike coefficients generated in each LCC were inversely proportional to the laser wavelength: and . The and values improved to from and to from , respectively, and the peak intensity was higher than that of the aberrated image [Fig. 6(c)]. Fig. 6Images of fluorescence beads in 2P-LSM illuminated with 900-nm wavelength laser light. (a) and (b) Lateral and axial images in the tilt-sample with and (a) before and (b) after correction. Panel (c) shows the average intensity profiles and the average curves of 10 bead images with and across the center of the intensity distributions along the -, -, and -axes. (d) and (e) Lateral and axial images in the cyl-sample of (d) before and (e) after correction. Panel (f) shows the average intensity profiles and the average curves of seven bead images with across the center of the intensity distributions along the -, -, and -axes. The scale bars denote .  Next, we observed the cyl-sample with the capillary’s longitudinal direction of . A0-LCC and A45-LCC corrected the astigmatism in the direction and C90-LCC corrected the system’s inherent Coma(90), as shown in Figs. 6(d) and 6(e). The device improved the and values to from and to from , respectively. The value was reduced to from and the peak intensity was higher than that of the aberrated image [Fig. 6(f)]. In this way, we succeeded in improving the spatial resolution and fluorescence signal as in the 1P-LSM case. 3.4.Imaging of Biospecimen With Two-Photon Excitation Laser Scanning MicroscopyFinally, we used the device to observe a fixed whole mouse brain using 2P-LSM illuminated by 910-nm wavelength laser light. We observed cortical layer V neurons under a thick blood vessel at the surface of the cerebral cortex of the left brain [Fig. 7(a)]. Figure 7(b) shows the wide-field image of the sample, and the thick blood vessel at the brain surface is indicated in the axial images in Fig. 7(b). Furthermore, we observed the sample within a cubed volume located at the center of the field of view at a depth of from the sample surface, i.e., at a depth of from the bottom of the blood vessel [Figs. 7(c)–7(d)]. We first corrected Astig(0) and Astig(45) by A0-LCC and A45-LCC. We determined the appropriate voltage required to achieve the maximum fluorescence signal by varying the voltage applied to A0-LCC, after which we determined the appropriate voltages for A45-LCC. The Zernike coefficients of the phase distributions in each LCC were and . The modulations of were maximum phase modulations in A45-LCC. After correcting astigmatisms, C90-LCC of corrected Coma(90), after which C0-LCC of corrected Coma(0). The modulations of were maximum phase modulations in C90-LCC. The adjustment of the applied voltages to each LCC was performed in the above-mentioned order by only one round. We observed the sample with such a low excitation power that the degradation in the fluorescent intensity induced by photobleaching was . From the images of the dendritic spine, the device clearly improved the image quality [Figs. 7(e) and 7(f)]. After correction with the device, the fluorescence peak intensity of the corrected image was higher than that of the aberrated image [Fig. 7(g)]. The device reduced the and the values to from and to from . Furthermore, the value was reduced to from . This result confirms that the device improves spatial resolution; additionally, the fluorescence signal degraded in the biospecimen, as with the bead sample. Fig. 7Images of the fixed whole brain of the thy1-YFP-H mouse in 2P-LSM illuminated with 910-nm wavelength laser light. (a) Schematic of the fixed-whole-mouse-brain sample. (b) Lateral and axial images before corrections in the area indicated by a rectangle in (a). The arrows in the axial images in (b) indicate the blood vessel. Lateral images (c) before and (d) after correction with the device were obtained in the area indicated by a rectangle in (b). Panels (e) and (f) show lateral and axial images (e) before and (f) after corrections in the areas indicated by the rectangles in (c) and (d), respectively. (g) Intensity profiles across the center of the intensity distribution in (e) and (f) along the -, -, and -axes. The scale bars in (b), (c), (d), (e), and (f) denote 100, 5, and , respectively.  4.DiscussionPreviously, our transmissive device for correcting spherical aberrations, which was inserted between the objective lens and the microscope revolver, improved the image quality by eliminating spherical aberrations. However, asymmetric aberrations, induced by the shape of a sample and/or a complicated refractive-index distribution in the sample, were not corrected by our previous device. In this study, we developed a transmissive device that can correct astigmatism and primary coma aberrations. The device succeeded in improving the spatial resolution and the fluorescence signal originally degraded by asymmetric aberrations in bead samples as well as in a biospecimen. LCC with the matrix electrodes can correct various aberrations as well as astigmatisms and primary coma aberrations with only one LCC,23 increasing the transmittance of the device. However, the unsmooth phase distribution generated by the small number or low fill factor of matrix electrodes might degrade the aberration correction effect. Furthermore, optical performance can be degraded by the diffraction light induced by the gap between matrix electrodes. Conversely, our device can achieve a smooth continuous phase distribution with the small number of electrodes, while the shape of a phase distribution is fixed by the segmented electrode pattern. Furthermore, the aperiodic pattern in the small number of electrodes might reduce the diffraction light. In the case of asymmetric aberrations, the reduction of the Strehl ratio induced by the Zernike aberration of the order is decreased to of that induced by the Zernike aberration of the order with the same-magnitude Zernike coefficient.24 Furthermore, specimen-induced aberrations tend to be dominated by low-order Zernike aberrations.17–19 The aberrated image, thus, was improved considerably by correcting only astigmatism of the second order and primary coma aberration of the third order. Meanwhile, the results of our study suggest that the device can also correct residual higher-order Zernike aberrations by laminating LCCs for correcting these higher-order Zernike aberrations. However, in fact, the many laminated LCCs degrade the transmittance of the device considerably. In the future, improvements of the device’s transmittance will be accomplished and the device will be able to correct more types of aberrations. If the two kinds of electrode patterns for correcting different Zernike aberration functions are, respectively, formed on opposite sides of a glass substrate, independent compensations for these two kinds of the Zernike aberration functions can be achieved with only one LCC.11 The experimental result in the bead samples qualitatively agreed with the numerically calculated result [Figs. 3(c)–3(h), 4(a)–4(c), and 5(a)–5(c)]. Indeed, the predominant functions in Zernike polynomials for aberrations were identical both in the experiments and the numerical calculations (see Secs. 3.1 and 3.2). Furthermore, the corrected and values of the bead images were close to those of the corrected PSFs obtained by the numerical calculation [Figs. 3(e), 3(h), 4(c), and 5(c)]. The slight differences between the numerical and experimental results, such as the peak intensity values and the magnitude of each Zernike coefficient required for the correction, might be induced by several unpredictable differences in presuppositions for the calculation, including the glass thickness in the bead samples, the system’s inherent aberration, and the intensity distribution of incident light. The correction effect of the device was also experimentally confirmed with 2P-LSM. The device showed similar improvements of the fluorescence signal in the bead image to that in 1P-LSM [Figs. 4(c), 5(f), 6(c), and 6(f)]. An adequate result was not obtained in the numerical calculation because the optical performance of the objective lens system used in the calculation was too poor for near-infrared wavelengths.14 However, the similar correction effect in 1P- and 2P-LSM can be explained as follows. The increases in the fluorescence signal are in proportion to the square of the excitation light intensity in the 2P process. Conversely, the Zernike coefficient of the wavefront aberration is inversely proportional to the wavelength and the degradation of the excitation light intensity induced by the wavefront aberration decreases; the increase in the excitation light intensity by the correction in 2P-LSM is lower compared to that in 1P-LSM. These properties suggest that the device can show similar improvements of the fluorescence signals for both 1P- and 2P-LSM. Several aberrations that occurred in the bead samples were estimated using numerical calculations and fluorescence bead images. Indeed, the predicted predominant aberration, i.e., primary coma aberration in the tilt-sample and astigmatism in the cyl-sample, was first corrected in the bead samples. However, such an estimate of the predominant aberration cannot be performed accurately, especially in a biospecimen. We suggest that correction of astigmatism should be performed first and the primary coma aberration should be corrected next, as shown in the observation of the fixed whole brain (see Sec. 3.4), because correction of astigmatism is more effective than that of the primary coma aberration for the improvement of image quality.24 In the observation of the fixed whole mouse brain, the device showed sufficient improvement both in the spatial resolution and in the fluorescence signal, which were estimated using the results in the bead samples. However, the device required the maximum phase modulation of Astig(45) and Coma(90) for correction of the biospecimen. The increase in the phase modulation of the device possibly achieves a greater improvement of the image quality in the fixed whole mouse brain. Our device can provide a simple approach to acquiring high-quality images in a biospecimen with a complicated surface shape and/or distribution of the internal refractive index. This approach does not require biologists to either slice a biospecimen or uniformize a refractive-index distribution in the sample. Furthermore, the device can be applied to a conventional laser scanning microscope without changing the fundamental optical system. Therefore, adaptive optics techniques using our device will be helpful for such fields as clinical research and pathology where prompt preparation and observation are needed. Of course, further improvements of the image quality during the observation of a biospecimen may be achieved by combining our adaptive optics technique and optical clearing reagents to increase the transparency of a sample and to even out the refractive-index distribution in the sample.25,26 In the future, we hope our transmissive device will be able to improve more types of Zernike aberrations and achieve the dynamic correction of various aberrations, including asymmetric and spherical aberrations. 5.ConclusionOur transmissive device for correcting primary coma and astigmatism showed improvements of the spatial resolution and fluorescence signal in bead samples, which was in agreement with the numerical calculation. Furthermore, the device succeeded in improving the image quality of a fixed whole mouse brain in 2P-LSM. The device can provide a simple approach for acquiring higher-quality images in a biospecimen with a complicated surface shape and/or a complicated internal refractive-index distribution. AcknowledgmentsThe authors are grateful to Dr. Y. Kozawa and Professor S. Sato (Institute of Multidisciplinary Research for Advanced Materials, Tohoku University) and Dr. R. Kawakami, Dr. K. Iijima, Dr. K. Otomo, and Mr. K. Sawada (Research Institute for Electronic Science, Hokkaido University) for their helpful advice. This study was partly supported by MEXT/JSPS KAKENHI under Grant No. JP15H05953 “Resonance Bio,” JP25-1699, JP26242082, and JP25560411; the Nano-Macro Materials, Devices and System Research Alliance (MEXT); the Network Joint Research Center for Materials and Devices (MEXT); and Brain/MINDS, AMED, Japan. ReferencesW. Denk et al.,
“Two-photon laser scanning fluorescence microscopy,”
Science, 248
(4951), 73
–76
(1990). http://dx.doi.org/10.1126/science.2321027 SCIEAS 0036-8075 Google Scholar
F. Helmchen and W. Denk,
“Deep tissue two-photon microscopy,”
Nat. Methods, 2
(12), 932
–940
(2005). http://dx.doi.org/10.1038/nmeth818 1548-7091 Google Scholar
S. Hell et al.,
“Aberrations in confocal fluorescence microscopy induced by mismatches in refractive index,”
J. Microsc., 169
(3), 391
–405
(1993). http://dx.doi.org/10.1111/jmi.1993.169.issue-3 JMICAR 0022-2720 Google Scholar
M. Booth,
“Adaptive optics in microscopy,”
Phil. Trans. R. Soc. A, 365
(1861), 2829
–2843
(2007). http://dx.doi.org/10.1098/rsta.2007.0013 PTRMAD 1364-503X Google Scholar
J. A. Kubby, Adaptive Optics for Biological Imaging, 109
–149 CRC Press, Boca Raton
(2013). Google Scholar
N. Matsumoto et al.,
“Correction of depth-induced spherical aberration for deep observation using two-photon excitation fluorescence microscopy with spatial light modulator,”
Biomed. Opt. Express, 6
(7), 2575
–2587
(2015). http://dx.doi.org/10.1364/BOE.6.002575 BOEICL 2156-7085 Google Scholar
Y. Kozawa et al.,
“Lateral resolution enhancement of laser scanning microscopy by a higher-order radially polarized mode beam,”
Opt. Express, 19
(17), 15947
–15954
(2011). http://dx.doi.org/10.1364/OE.19.015947 OPEXFF 1094-4087 Google Scholar
S. Ipponjima et al.,
“Improvement of lateral resolution and extension of depth of field in two-photon microscopy by a higher-order radially polarized beam,”
Microscopy, 63
(1), 23
–32
(2014). http://dx.doi.org/10.1093/jmicro/dft041 Google Scholar
G. Brooker et al.,
“In-line FINCH super resolution digital holographic fluorescence microscopy using a high efficiency transmission liquid crystal GRIN lens,”
Opt. Lett., 38
(24), 5264
–5267
(2013). http://dx.doi.org/10.1364/OL.38.005264 OPLEDP 0146-9592 Google Scholar
K. Otomo et al.,
“Two-photon excitation STED microscopy by utilizing transmissive liquid crystal devices,”
Opt. Express, 22
(23), 28215
–28221
(2014). http://dx.doi.org/10.1364/OE.22.028215 OPEXFF 1094-4087 Google Scholar
S. Ohtaki et al.,
“The applications of a liquid crystal panel for the 15 Gbyte optical disk system,”
Jpn. J. Appl. Phys., 38
(Pt 1), 1744
–1749
(1999). http://dx.doi.org/10.1143/JJAP.38.1744 Google Scholar
N. Hashimoto, Optical Applications of Liquid Crystals, 62
–117 Institute of Physics Publishing, Bristol
(2003). Google Scholar
A. Tanabe et al.,
“Transmissive liquid crystal devices correcting the spherical aberrations in laser scanning microscopy,”
Proc. SPIE, 9335 933502 2015). http://dx.doi.org/10.1117/12.2076342 Google Scholar
A. Tanabe et al.,
“Correcting spherical aberrations in biospecimen using transmissive liquid crystal device in two-photon excitation laser scanning microscopy,”
J. Biomed. Opt., 20
(10), 101204
(2015). http://dx.doi.org/10.1117/1.JBO.20.10.101204 JBOPFO 1083-3668 Google Scholar
M. J. Booth et al.,
“Aberration correction for confocal imaging in refractive-index-mismatched media,”
J. Microsc., 192
(Pt 2), 90
–98
(1998). http://dx.doi.org/10.1111/j.1365-2818.1998.99999.x JMICAR 0022-2720 Google Scholar
R. Arimoto and J. M. Murray,
“A common aberration with water-immersion objective lenses,”
J. Microsc., 216
(Pt 1), 49
–51
(2004). http://dx.doi.org/10.1111/j.0022-2720.2004.01383.x JMICAR 0022-2720 Google Scholar
M. Schwertner et al.,
“Measurement of specimen-induced aberration of biological samples using phase stepping interferometry,”
J. Microsc., 213
(Pt 1), 11
–19
(2004). http://dx.doi.org/10.1111/j.1365-2818.2004.01267.x JMICAR 0022-2720 Google Scholar
X. Tao et al.,
“Live imaging using adaptive optics with fluorescent protein guide-stars,”
Opt. Express, 20
(14), 15969
–15982
(2012). http://dx.doi.org/10.1364/OE.20.015969 OPEXFF 1094-4087 Google Scholar
M. Rueckel et al.,
“Adaptive wavefront correction in two-photon microscopy using coherence-gated wavefront sensing,”
Proc. Natl. Acad. Sci. U. S. A., 103
(46), 17137
–17142
(2006). http://dx.doi.org/10.1073/pnas.0604791103 Google Scholar
M. Born and E. Wolf, Principles of Optics, 767
–772 4th ed.Pergamon Press, London
(1970). Google Scholar
A. Tanabe et al.,
“Transmissive liquid-crystal device correcting primary coma aberration and astigmatism in laser scanning microscopy,”
97171N
(2016). http://dx.doi.org/10.1117/12.2209459 Google Scholar
G. Fen et al.,
“Imaging neuronal subsets in the transgenic mice expressing multiple spectral variants of GFP,”
Neuron, 28
(1), 41
–51
(2000). http://dx.doi.org/10.1016/S0896-6273(00)00084-2 NERNET 0896-6273 Google Scholar
P. Xiao et al.,
“An optical tomography PSF almost insensitive to aberrations: the benefit of a spatial incoherent illumination,”
97170I
(2016). http://dx.doi.org/10.1117/12.2210950 Google Scholar
J. C. Wyant, K. Creath, Applied Optics and Optical Engineering, 11 28
–39 Academic Press, New York
(1992). Google Scholar
T. Staudt et al.,
“2, 2’-thiodiethanol: a new water soluble mounting medium for high resolution optical microscopy,”
Microsc. Res. Tech., 70
(1), 1
–9
(2007). http://dx.doi.org/10.1002/(ISSN)1097-0029 MRTEEO 1059-910X Google Scholar
H. Hama et al.,
“Scale: a chemical approach for fluorescence imaging and reconstruction of transparent mouse brain,”
Nat. Neurosci., 14
(11), 1481
–1488
(2011). http://dx.doi.org/10.1038/nn.2928 NANEFN 1097-6256 Google Scholar
BiographyAyano Tanabe received her MSc degree in engineering from the University of Electro-Communications. She is pursuing her PhD at Hokkaido University, Japan. She is also involved in development of liquid-crystal devices at Citizen Holdings Co. Ltd. Her research interests include applications of active optics to biomedical imaging. Terumasa Hibi received his BSc, MSc, and PhD from Nagoya City University. He is a specially appointed lecturer at the Research Institute for Electronic Science, Hokkaido University. He has expertise in cell biology and microscopy. Sari Ipponjima is pursuing her PhD at Hokkaido University, Japan. Her current research interests concern applications of biomedical imaging. She has an MSc in information science from Hokkaido University and his BSc degree in physics from Nara Women's University. Kenji Matsumoto is an engineer at Citizen Holdings Co. Ltd. His recent interests are optics of microscopy and holography. He has a bachelor’s degree in engineering from the University of Electro-Communications. Masafumi Yokoyama is the chief engineer at Citizen Holdings Co. Ltd. He graduated from Tokyo University of Science in 1987. Makoto Kurihara graduated from Tokyo University of Science in 1985. He is interested in liquid crystals and their applications. Nobuyuki Hashimoto has a BSc, MSc, and PhD from Waseda University. Since, joining Citizen Holdings Co. Ltd., he has been involved in developing applications of liquid crystal optics in displays, holography, optical data storage, laser printers, telescopes, and bio-imaging. He is a member of SPIE, OSJ and a fellow of OSA. He is the president of the holography research group (HODIC) of OSJ. |


