
|
|
1.IntroductionArticular cartilage (AC) works as a cushion on the bony ends to attenuate the inner stress of the skeletal system.1 In microstructure, AC tissue is organized into four distinctive zones from the surface to the subchondral bone. Accordingly, the biochemical compositions of AC, such as water, collagen fibrils, and proteoglycans (PGs), vary with depth.2–4 The mechanical functions of AC heavily rely on its zonal structure and compositions; both mechanical lesions and biochemical alterations can lead to AC degeneration. Therefore, morphology, mechanical properties, and biochemical alterations are the main concerns to assess the degeneration of AC.5 Longitudinal histology of AC is a common and reliable way to morphologically grade physical damage and pathological degeneration.6,7 However, destruction to cartilage tissue is generally inevitable in preparation of conventional histology slices. To minimize the injury to joints, morphological assessment based on optical arthroscopy is developed and applied to clinically diagnosing the AC denegation.8–10 Currently, it remains difficult to detect early osteoarthritis (OA) with arthroscopic examination only.11 There have been specialized optical probes, such as confocal arthroscopy12,13 and endoscopic optical coherent tomography (OCT),14,15 developed to examine AC degeneration in vivo. However, the properties of light propagation in the cartilage matrix have not yet to be fully investigated. The propagating properties of light reveal the interactions between light and AC matrix, which potentially provides noninvasive ways to assess the degeneration of AC, especially early pathological variations. Since AC is a highly inhomogeneous, anisotropic, and optical turbid tissue,16 the propagation of light is strongly influenced by its scattering nature, which is further determined by the tissue composition and substructure along the optical path.17 Therefore, thoroughly characterizing the light propagations in the AC matrixes under various physiological conditions is the foundation to develop optical techniques that can reliably assess the degeneration of AC at an early stage. Refractive index (RI) that characterizes how the optical medium alters the propagating path of the light is one of the most important optical parameters. Our previous study has reported that the depth-dependent property of RI was related to PGs in AC tissue.18 The impact of mechanical wear and biochemical alteration to the depth distribution of RI still need to be further investigated. As far as we know, the only previous study of such a subject was an OCT-based measurement in which the AC samples from bovine patellar were digested in trypsin and collagenase solutions, respectively, to evaluate the depth dependencies of RI under normal and biochemically degenerated AC samples.19 Limited by the thickness of the AC sections, the RI distribution was determined with three different depths, which may be not sufficient to characterize the RI distribution. The results showed that there was no significant difference between the overall RI of the normal and chemically degenerated AC samples. This study adopted a previously developed technique based on confocal microscopy20 to measure the RI distributions of AC samples, which were artificially degenerated with linear mechanical sliding or enzymic digestion. To mimic the loading circumstances of humans, the AC samples were collected from kangaroo knees, because kangaroo is a typical mammal adopting bipedal locomotion and the contact pressure in its knee joint was demonstrated in the physiological range of humans.21 AC degenerating models treated by mechanical wear or trypsin penetration were created to simulate different types of cartilage degrades. For both mechanical and enzymic models, two subgroups were further adopted to simulate two different degrees of degeneration, respectively. The RI data were measured with interval along depth direction. The depth fluctuation of RI was characterized by using a previously developed method.18 2.Materials and Methods2.1.Specimen CollectionThe collection and process of cartilage samples used in this study followed an animal study protocol approved by the Animal Ethics Committee of University of Western Australia, complying with the requirements of Australia Code of Practice for the Care and Use of Animals for Scientific Purposes (7th Edition 2004) and Animal Welfare Act WA (2002). A total of 15 knee joints were collected from 3-years-old female western gray kangaroos (Macropus fuliginosus). To minimize the impacts of sample deterioration, the kangaroos were slaughtered 2 h before the corresponding tests. The cartilage surfaces of the femoral condyles were visually inspected to eliminate the existence of OA. The 15 knees were grouped for mechanical wear (), enzymic treatment (), and control (). For control group, three cylindrical AC plugs with subchondral bones () were punched off from central medial femoral condyles of the three joints. Each AC plug was then manually cut into two halves along the cylinder axis for RI measurement and histology process, respectively. The half AC plug used for RI measurement was immediately frozen with liquid nitrogen followed by frozen sectioning procedure. The other half retained for histology preparation was fixed in 10% neutral buffered formalin solution for 24 h. 2.2.Enzymic TreatmentThe macromolecular degradation catalyzed by proteolytic enzymes was accepted as a typical feature of the AC degeneration at the early and middle stages.22 Since trypsin was reported effective for the PG digestion as well as a slight simultaneous effect on the collagen network,23,24 it was employed in this study to create a pathologically degenerated AC model. A total of six AC cylindrical AC plugs () were punched off from the central loading areas of six medial femoral condyles. To simulate different levels of PG loss in AC tissue, the six AC plugs were divided into two groups for () and () trypsin-ethylenediamine tetra-acetic acid (EDTA) (T4174, Sigma-Aldrich, Castle Hill, Australia). Both groups were incubated at 37°C and digested in the trypsin solutions for 2 h. After the enzymic treatment, the AC plugs were also axially cut into two halves for RI measurement and histology process, respectively. 2.3.Mechanical WearA cartilage-to-cartilage sliding model was adopted to create mechanical wear on the AC samples. The mechanical wear was conducted with a custom-designed linear reciprocating slide apparatus (Fig. 1). A femoral AC block and its corresponding tibial block were oppositely mounted in the upper and lower sample holders. The lubricant was phosphate-buffered saline solution (PBS, pH 7.4). The lubricant bath was fixed on a motion base, which could be horizontally reciprocated at a preset speed and cyclic frequency. The sliding displacement was set to 4 mm for all tests. A constant load was vertically applied to the upper sample holder during the entire mechanical test. Two different wear protocols were adopted to simulate the mechanical circumstances of short-term running and long-term walking, as summarized in Table 1 (short-term high-speed test and long-term low-speed test). These parameters (load, time, and speed) ensured that the cartilage contact pressures were within the normal physiological range.21 Fig. 1Schematic diagram of the linear reciprocating slide apparatus. Driven by stepper motor, the lower sample was horizontally slid against the upper sample. A constant normal load was applied to the upper sample during the test.  Table 1Summary of mechanical wear protocols.
Note: The applied loads were static and constant throughout a test and vertically applied to the samples. The movement of the two opposing cartilage samples was horizontal reciprocating linear sliding. The lubricant medium was 1× PBS. The two wear protocols adopted different normal loads, sliding speeds, and testing time. Six couples of cartilage blocks () attached with 5-mm subchondral bones were sawn from the central areas of the medial femoral condyles and the opposing tibial plateaus (Fig. 2). Three cartilage couples were repeated for each wear protocol. Once a wear test was completed, a cylindrical AC plug with the same size as other groups () was punched off from the central loaded region of the femoral AC block (upper sample). The cylindrical AC plug was then cut into two halves for RI measurement and histology process, respectively. Fig. 2AC blocks () for mechanical wear tests were collected from the areas shown as dashed rectangles: (a) femoral condyle and (b) tibial plateau. After mechanical test, a cylindrical AC plug () was punched off from the control area of the medial femoral condyle (shown as the solid line circles) for RI measurement and histology process. 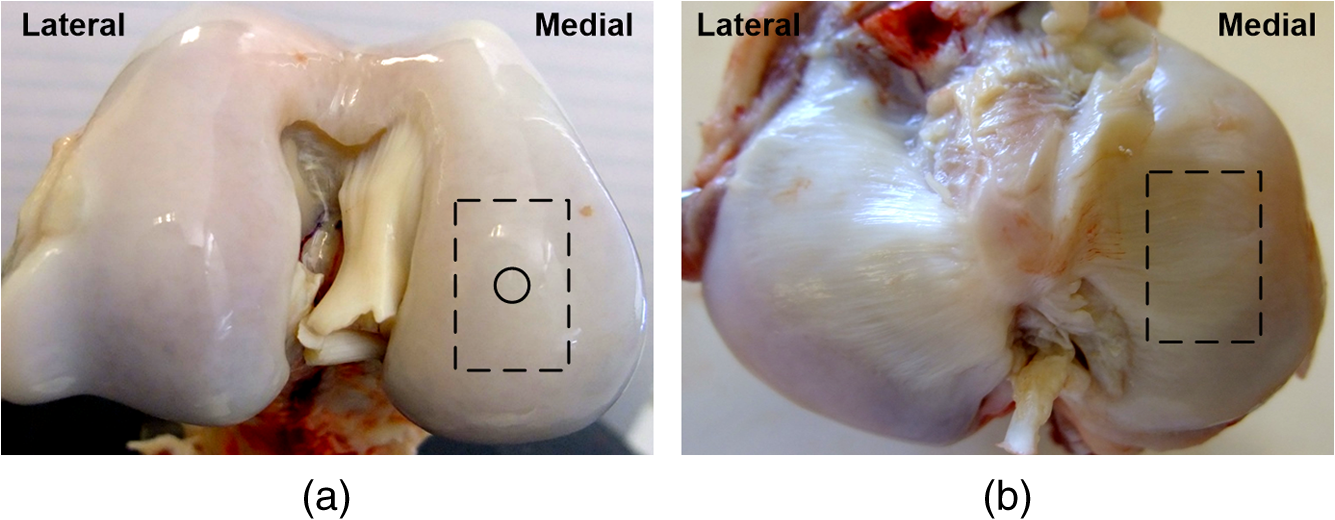 2.4.Refractive Index MeasurementThe semicylindrical AC plugs after tests were frozen with liquid nitrogen immediately to retain original physiological conditions. A frozen section process was then applied to these AC plugs by using a cryomicrotome (Leica cryostat CM3050S, Leica Microsystems, Wetzlar, Germany) maintained at . The AC plugs were transversely sectioned into semicircular disks of thick. Depending on the thickness of the AC plug, a series of AC disks numbering from 6 to 15 could be acquired. The sectioned AC disk was stained in Rhodamine B for 1 min and placed on a slide next to a small drop of immersion oil (Type F, , Leica Microsystems, Wetzlar, Germany), which was also slightly stained with Rhodamine B (Fig. 3, side view). A laser scanning confocal microscope (Leica TCS SP2 AOBS, Leica Microsystems, Wetzlar, Germany) equipped with an oil immersion objective (Plan Apochromate, and ) was utilized to excite the sample at 561 nm and recorded images () through a 550- to 595-nm bandpass filter. For each semicircular AC disk, the scan covered the entire sample depth with a step size of and three adjacent spots were scanned (Fig. 3, top view). The image stacks of the three scanning spots were then further processed and used to calculate the RI of AC based on the technique we proposed previously.20 The average RI acquired from the three scanning spots was used as the RI of a specific depth. Fig. 3Schematic diagram of sample arrangement for confocal scan. (a) A sandwich-like sample setup was adopted to obtain identical physical thickness of the AC disk and stained immersion oil (side view). The semicircle on (b) represents the top view of an AC disk. The three indexed squares in top view are confocal scanning spots (), which have about 1-mm gap between each other. 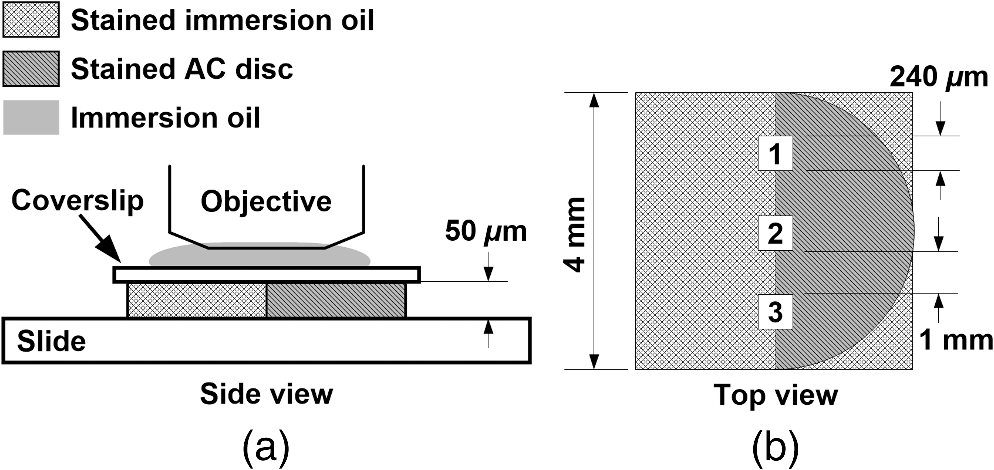 For each semicylindrical AC plug, the RI data acquired from the series of AC disks were approximated (polynomial method) as a smooth RI–depth curve to characterize the RI distributing trend with depth. To correctly describe the RI distributing feature, polynomial equations with lower orders were adopted, provided that sufficient goodness of fit was achieved in the manner of -square and sum of squares due to error. The coefficient of RI fluctuation was then calculated with a method we previously proposed.18 This coefficient quantified both the amplitude and fluctuating frequency of a RI–depth curve. A higher coefficient of RI fluctuation indicated higher amplitude and stronger oscillation of the RI distribution within a certain depth range. RI fluctuations of different testing groups (mechanical wear, enzymic treatment, and control) were statistically compared. The single-factor analysis of variance (ANOVA) (OriginPro 8 SR4, OriginLab, Northampton, Massachusetts) was applied to each semicylindrical AC plug to determine whether significant difference of RI existed in different depths (significant level ). The overall RI measured from the AC samples with different treatments were also assessed with single-factor ANOVA (). 2.5.Histology AssessmentAll semicylindrical AC plugs fixed for histology process were decalcified for 5 h (RDO Rapid Decalcifier, Apex Engineering Products Corporation, Aurora, Illinois) and automatically dehydrated in a Leica tissue processor (Leica ASP 200, Leica Microsystems, Wetzlar, Germany). Thereafter, the dehydrated AC plugs were longitudinally sectioned into slices with a rotary microtome (Leica RM2255, Leica Microsystems, Wetzlar, Germany). Only the AC slices close to the central axis of the AC plug were selected and stained with two different protocols. Safranin O method was commonly used to stain the PG content and recommended as a grading standard for AC study and clinics.7,25 Thus, a staining protocol using Safranin O and Fast Green (SO&FG) was adopted in this study to assess the PG loss of the AC samples.26 After SO&FG stain, the AC slices were automatically imaged by a bright-field digital slide scanner coupled with a dry objective (ScanScope AT, Aperio, Vista, California). The PG loss of the AC slice was quantified with a coefficient defined previously.18 This coefficient calculated the intensity of red color in the SO&FG-stained images, which was reported proportional to the wet weight fraction of PGs determined in a biochemical way.27,28 Ranging between 0 and 1, the higher coefficient of PG loss indicates that less PG contents were retained in cartilage matrix. Since Picrosirius red (PSR) stain can increase the birefringence of the collagen bundles,29 polarized light microscopy plus PSR stain were commonly used to investigate the collagen organization and integrity in various biological tissues.30–35 Based on this technique, both qualitative and quantitative approaches were developed for analyzing the collagen meshwork of AC.36–41 In this study, a PSR protocol34 was adopted to stain the AC slices for monitoring the alteration of collagen orientation. PSR histology images () were captured with a polarized light microscope (Nikon Eclipse LV100POL, Nikon Instruments, Melville, New York) coupled with a universal epi-illuminator (Nikon LV-UEPI, Nikon Instruments, Melville, New York) and a digital camera (Nikon DS-Fi1, Nikon Instruments, Melville, New York), which recorded the birefringence intensity of the AC slices. For consistent comparisons, all PSR-stained AC slices were aligned on the microscope stage to enable the same angle between the slice and the axis of polarization. In this way, the difference of birefringence intensity between AC slices was able to demonstrate the altered orientation of collagen fibrils.32,38 3.Results3.1.Histological AssessmentIn the histology slice with SO&FG stain (Fig. 4), the red color represents the PGs stained by Safranin O while the light blue means no PG contents retained in that area. The AC plugs digested in trypsin showed complete PG depletion [Fig. 4(a)], whereas the trypsin group still partially retained some PGs in deep region [Fig. 4(b)]. The trypsin wavefront digested the PGs through a path from cartilage surface to tidemark. In normal AC, the superficial zone has the lowest proportion of PGs,2,3 which corresponded to a thin layer without Safranin O stain on the AC surface [Fig. 4(e)]. However, this low PG layer was absent in the AC slice with mechanical wear [Figs. 4(c) and 4(d)], which suggested that the corresponding superficial zones were abraded. In addition, the AC surfaces of mechanical wear groups [Figs. 4(c) and 4(d)] were not as smooth as the control sample [Fig. 4(e)]. Except for the superficial zone, both mechanical wear protocols induced no visible difference on PG distribution [Figs. 4(c) and 4(d)]. Fig. 4Example AC slices stained with SO&FG and imaged by bright-field microscopy (longitudinal view). (a) AC sample digested in trypsin-EDTA, (b) AC sample digested in trypsin-EDTA, (c) AC sample after short-term high-speed test, (d) AC sample after long-term low-speed test, and (e) control sample.  Due to the birefringence property of PSR-stained collagen fibrils under polarized light microscopy, the image intensity shown in Fig. 5 actually indirectly indicated the orientation of collagen meshwork.32,41 The birefringence intensities of the AC slices treated with trypsin solutions [Figs. 5(a) and 5(b)] appeared to have no obvious difference from the control sample [Fig. 5(e)]. The short-term high-speed test also induced no visually detectable changes to the birefringence property of collagen fibrils [Fig. 5(c)]. However, the long-term low-speed test slightly decreased the birefringence of the collagen fibrils and, hence, the corresponding PSR slices [Fig. 5(d)] appeared darker than the control sample [Fig. 5(e)] under polarized light microscope, which indicated altered orientation of collagen fibrils comparing with other samples. Furthermore, the long-term low-speed test packed the tangential collagen fibrils of superficial zone into a tighter pattern [Fig. 5(d)]. For all groups, there was a dark belt in the upper-middle zone of the PSR slice demonstrating the isotropic arrangement of collagen meshwork in this region.39 Fig. 5Example AC slices stained with PSR and imaged by polarized light microscopy (longitudinal view). (a) AC sample digested in trypsin-EDTA, (b) AC sample digested in trypsin-EDTA, (c) AC sample after short-term high-speed test, (d) AC sample after long-term low-speed test, and (e) control sample.  3.2.Refractive Index Distribution With DepthTypical examples of the RI distributions with depth acquired from different testing groups were listed in Fig. 6. The solid curve represented the distributing trend of the RI data measured from different depths of the AC sample. To enable easy comparison of the RI fluctuation from different groups, the ordinate extents of all RI–depth curves were limited to 0.16 [1.36 to 1.52 for Figs. 6(a) and 6(b), 1.34 to 1.50 for Figs. 6(c), 1.30 to 1.46 for Figs. 6(d) and 6(e)]. The AC thickness shown in abscissa was based on actual confocal microscopic scan, which did not strictly match to the setting of cryomicrotomy due to instrument accuracy. Fig. 6Typical RI–depth curves representing testing groups of (a) trypsin-EDTA, (b) trypsin-EDTA, (c) short-term high-speed test, (d) long-term low-speed test, and (e) control. The abscissa indicates the depth of RI measurement, whereas the ordinate represents the corresponding average RI. The solid dots represent the RI measured at a specific depth, while the solid curve is a polynomial fit showing the RI distributing trend with depth. High degrees of polynomials (ninth and seventh) were adopted for (a) and (b) to ensure sufficient fitting goodness. For other groups, second or third degrees of polynomial provided enough fit accuracy. The ordinates were limited to the same range to enable easy comparison.  The RI distribution of the AC samples treated with trypsin solution revealed strong but diverse fluctuations [Figs. 6(a) and 6(b)]. The distributing trend was well approximated by the polynomial equation with high degree due to the local oscillations of RI data. The corresponding RI–depth curves indicated that the RI distributed irregularly with depth, which were distinct from the relatively regular RI distributions observed from the short-term high-speed group [Fig. 6(c)] and control samples [Fig. 6(e)]. Although some local fluctuations still appeared in Figs. 6(c) and 6(e), the measured RI data could be well approximated with second- or third-degree polynomials and formed visible overall trends of slow increase with depth. The long-term low-speed test, however, induced slight RI fluctuations [Fig. 6(d)] but still revealed regular distributing features. 3.3.Quantitative ComparisonThe AC samples treated with trypsin solutions (both 5 and ) showed higher average RI than other groups (Table 2). The trypsin group had the highest average RI (), and the average RI of trypsin group was slightly lower (). Mechanical tests induced no distinctive changes to average RI compared with the controls. However, the AC samples from long-term low-speed tests had a slightly lower average RI () than that of short-term high-speed test () and controls (). The ANOVA test indicated that, for any AC plug regardless of its experimental group, the RI data measured in different depths were significantly different (). The overall RI of different experimental groups was significantly different from each other despite the fact that some AC plugs had almost the same average RI (). Table 2Statistical results of all experimental groups.
Note: A higher coefficient of RI fluctuation indicates stronger fluctuation of RI distributing along depth direction. A higher coefficient of PG loss means that a lower proportion of PGs can be stained by Safranin O. The coefficient of RI fluctuation for each testing group was listed in Table 1, representing quantified fluctuating features of RI-Depth curves (Fig. 6). The AC samples digested in trypsin had the highest coefficient of RI fluctuation (1.7936) indicating the strongest RI oscillations with depth. The RI fluctuation of AC samples digested in trypsin (1.3618) was weaker than that of trypsin group but still much stronger than other groups. The long-term low-speed test increased the RI fluctuation of AC to some extent (0.8294) but still maintained relatively regular distributing features comparing with the two trypsin groups (Fig. 6). The coefficients of RI fluctuation quantified in short-term high-speed group (0.0960) and controls (0.1400) were dramatically low, which indicated normal physiological conditions of the AC samples according to our previous study.18 The quantitative estimations of PG loss (Table 2) further demonstrated the PG distribution shown in the histological images (Fig. 4). The AC plugs digested in trypsin contained few PG contents that could be stained by Safranin O. The AC samples of trypsin group also revealed remarkable PG loss, but the PG residual was slightly higher than trypsin group. The average PG loss of control group (0.5711) was a little higher than that of mechanical testing groups (0.5517 and 0.5425). However, considering potential errors that could be induced by the histology preparation and imaging process, it was reasonable to accept proper error tolerance when estimated PG loss. More importantly, since the PG contents in healthy AC tissue varied sample by sample, the slight difference of PG loss between control group and mechanical testing groups was treated as normal sample diversity rather than noticeable alteration of PG contents. 4.Discussion4.1.Correlation Between Proteoglycans and Overall Refractive IndexIn this study, the average RI of control samples (AC from kangaroo knees, ) is close to the overall RI of AC samples () collected from newborn lambs20 but is distinctively lower than that of mature sheep ().18 These RI gaps among different sample resources indicate that the RI of AC is highly diverse depending on specie and tissue maturity. Quantitative calculation in this study showed that the average RI of AC increased with the coefficient of PG loss, which demonstrated the potential correlation between PGs and RI, although the exact interacting mechanism is still unclear. This result is also compatible with the study based on cornea.42 A possible interpretation is that PG loss alters the compositional proportions of extracellular matrix leading to a varied overall optical property. Since PGs occupy the interfibrillar space of extracellular matrix and impede the flow of interstitial fluid within the cartilage tissue,43 once PGs were depleted, the permeability of extracellular matrix would increase remarkably.22,44 Therefore, the trypsin-digested AC samples become softer and easier to be deformed.45 When various external loads were applied to these cartilage samples, the interstitial fluid would flow from the thin and highly permeable AC section. It has been reported that water contents in extracellular matrix of AC had lower RI (close to 1.33), whereas the macromolecules had relatively higher RI (1.43 for collagens and 1.55 for glycosaminoglycan).46,47 Consequently, the average RI of the trypsin-digested AC was increased due to the increased proportion of collagen contents in the extracellular matrix. The correlation between the average RI and the PG loss of AC could potentially suggest an approach to estimate OA progress, because the loss of larger PG aggregates appears to be one of the earliest changes associated with OA and immobilization of the joint.11,48 The assessment of PG loss is a broadly adopted method to grade both the pathological degeneration7,49 and the mechanical wear of AC.50,51 Therefore, a technique sensitive to PG loss should be an effective method for OA assessment. Average RI can reflect the PG changes to some degree, according to the data listed in Table 2, but its sensitivity to low level of PG loss still needs to be further determined. 4.2.Factors Altering Refractive Index FluctuationOur previous study had demonstrated that there was strong correlation between PG loss and depth-dependent RI fluctuation of AC.18 The current study also quantitatively confirmed that the progress of PG loss could increase the coefficient of RI fluctuation (Table 2). It was reported that the morphology and distribution of collagen were primary factors leading to the fluctuated RI with depth because the tissues birefringence was closely related to the diameter, orientation, and packed patterns of collagen fibrils.52 The unique zonal structure of AC determines the depth variable optical properties of collagen fibrils. The loss of PG contents further alters the existing light propagating path in collagen meshwork. In the trypsin-digested AC samples, the interstitial fluid is lost more easily with increased permeability; thus, the propagating light mainly interacts with collagen fibrils. Since the penetration of trypsin in the cartilage matrix is dependent on the initial distribution and concentration of PGs,53 different concentrations of trypsin solutions lead to different levels of PG residues in the AC matrix (Fig. 4). Accordingly, the RI of AC varies with fractions of PGs, collagen fibrils, and water contents in different depths. In comparison with trypsin digestion, mechanical wear imposed fewer impacts to the RI distribution in AC matrix (Table 2). The long-term low-speed tests induced observable RI fluctuations, whereas the short-term high-speed tests had little influence on the depth distribution of RI. Since the PG losses measured from all mechanical testing groups were similar (Table 2), the different levels of RI fluctuation between these two wear protocols should be attributed to some other factors. On the tibial plateau of kangaroos, the special structure of cartilage tissue enables the contact pressure to be maintained in low levels even under harsh external loads.21 It has been demonstrated that short-term high-speed tests have little influence to the organization and function of femoral AC.21 As for the long-term low-speed test, since it lasted up to 6 h, the interstitial fluid of cartilage was gradually squeezed out from the load bearing region of the extracellular matrix despite the fact that merely a low external load was applied. The loss of water contents in the AC matrix leads to the increased coefficient of RI fluctuation. From this point, it seems that the loss of interstitial fluid, either induced by PG loss or long-term loading, is the primary and direct reason leading to stronger RI fluctuation. In addition to this biochemical alteration, the other factor that could contribute to the RI fluctuation was the changed arrangement of the collagen fibrils due to long-term loaded mechanical tests. The PSR histology revealed the decreased birefringence intensities of the AC slices after long-term low-speed tests, which indicated the alteration of the collagen organization [Fig. 5(d)]. Thus, it is reasonable to assume that the altered collagen meshwork also contributes to the enhanced RI fluctuation. It should be noted that some RI data in Fig. 6 do exhibit higher standard deviations (error bar) than other data points. This could be attributed to the inhomogeneous and anisotropic property of AC. To minimize the impact of measuring deviation from individual scanning spots, this study adopted the severity of RI fluctuation rather than the specific shape of RI distribution or the RI value itself to analyze of AC degeneration. This strategy makes the overall degree of RI fluctuation less impacted even though the local distribution of RI may be influenced by some larger measuring deviations. 4.3.Refractive Index Fluctuation and OsteoarthritisIn the initial stage of OA, the collagen contents are mostly constant with only slight alterations in size and arrangement.54 The PGs with fewer constraints from the collagen tensions are able to bind increased amounts of water contents.11 However, as OA progresses, due to the destruction of cartilage surface, PGs gradually diffuse into synovial fluid. The water contents subsequently decrease with the increased permeability of the cartilage matrix due to the persistency of external loads.55–57 Consequently, the early stage of osteoarthritic AC can be biochemically characterized as increased water contents, slightly decreased PGs and reorganized collagens while the biochemical features of advanced OA are the rapidly decreased water and PG contents as well as the destroyed collagen arrangement. In this study, the trypsin treatment mimicked the early OA (Grade 1.0 to 1.5), according to the OARSI cartilage OA histopathology grading system.7 The AC samples digested in trypsin appeared to have similar biochemical features to the advanced OA (Grade 4.0 to 4.5) but had no matrix erosion as in the actual OA samples. The long-term low-speed testing group simulated the altered collagen organization indicating the other important feature of OA. The RI characters from these experiments demonstrate that the progress of OA will lead to increased overall RI of AC and remarkable RI fluctuation with depth. However, as the overall RI varied insensitively to slight PG loss, it may be not a good indicator for early OA comparing to RI fluctuation. Despite an initial study, the present work has demonstrated the potential application of RI distribution to monitor OA progress. However, the RI distribution in this study was investigated with an animal model simulating limited features of OA only. Further study should focus on the RI distribution in the graded osteoarthritic AC samples. In addition, the current RI measuring technique may destroy the internal structure when the AC samples are sectioned. An improved technique utilizing confocal arthroscopy to measure the RI distribution in vivo is more valuable for potential clinical applications. 5.ConclusionsIn summary, we investigated the RI distribution of AC samples with mechanical or biochemical degenerations. The overall RI of AC is observably influenced by PG contents because PGs can maintain the interstitial fluids, which further stabilizes light propagation in cartilage tissue. The depth fluctuation of RI is sensitive to both PG loss and alteration of collagen arrangement. The PG loss intensifies RI fluctuation by enhancing the interaction between light and collagen fibrils. Long-term low-speed mechanical wear can lead to severe RI fluctuation because of the gradual alterations on compositional proportions and fibrillar organization. Short-term high-load mechanical wear has little influence on the RI fluctuation due to the self-recovery mechanism of AC. RI distribution can characterize the physical or chemical alterations of AC matrix, which suggests a potential application to assess AC degeneration, e.g., OA progress. AcknowledgmentsThe authors acknowledge the facilities, scientific, and technical assistance of the Centre for Microscopy, Characterization, and Analysis at the University of Western Australia, a facility funded by the University, State and Commonwealth Governments of Australia. We thank Dr. Paul Ichim from the School of Dentistry and Ms. Mary Lee from CELLCentral, the University of Western Australia, for their technical supports. The authors have no relevant financial interests in the manuscript, no other potential conflicts of interest to disclose, and no financial relationships with any organizations that might have an interest in this work. ReferencesA. J. Sophia Fox, A. Bedi and S. A. Rodeo,
“The basic science of articular cartilage: structure, composition, and function,”
Sports Health Multidiscip. Approach, 1
(6), 461
–468
(2009). http://dx.doi.org/10.1177/1941738109350438 Google Scholar
H. Muir, P. Bullough and A. Maroudas,
“The distribution of collagen in human articular cartilage with some of its physiological implications,”
J. Bone Jt. Surg. Br. Vol., 52-B
(3), 554
–563
(1970). Google Scholar
S. S. Chen et al.,
“Depth-dependent compressive properties of normal aged human femoral head articular cartilage: relationship to fixed charge density,”
Osteoarthritis Cartilage, 9
(6), 561
–569
(2001). http://dx.doi.org/10.1053/joca.2001.0424 OSCAEO 1063-4584 Google Scholar
M. C. John,
“The organization of collagen in cryofractured rabbit articular cartilage: a scanning electron microscopic study,”
J. Orthop. Res., 3
(1), 17
–29
(1985). http://dx.doi.org/10.1002/(ISSN)1554-527X JOREDR 0736-0266 Google Scholar
J. F. Michael and M. B. Bettina,
“Biotribology: friction, wear, and lubrication of natural synovial joints,”
Lubr. Sci., 9
(3), 255
–271
(1997). http://dx.doi.org/10.1002/(ISSN)1557-6833 LUSCEN 0954-0075 Google Scholar
P. Mainil-Varlet et al.,
“Histological assessment of cartilage repair: a report by the histology endpoint committee of the international cartilage repair society (ICRS),”
J. Bone Jt. Surg., 85-A
(Suppl. 2), 45
–57
(2003). Google Scholar
K. P. H. Pritzker et al.,
“Osteoarthritis cartilage histopathology: grading and staging,”
Osteoarthritis Cartilage, 14
(1), 13
–29
(2006). http://dx.doi.org/10.1016/j.joca.2005.07.014 OSCAEO 1063-4584 Google Scholar
J. A. Rand,
“Role of arthroscopy in osteoarthritis of the knee,”
Arthroscopy J. Arthroscopic Relat. Surg., 7
(4), 358
–363
(1991). http://dx.doi.org/10.1016/0749-8063(91)90004-H Google Scholar
A. Årøen et al.,
“Articular cartilage lesions in 993 consecutive knee arthroscopies,”
Am. J. Sports Med., 32
(1), 211
–215
(2004). http://dx.doi.org/10.1177/0363546503259345 AJSMDO Google Scholar
S. Hepple and A. Guha,
“The role of ankle arthroscopy in acute ankle injuries of the athlete,”
Foot Ankle Clin., 18
(2), 185
–194
(2013). http://dx.doi.org/10.1016/j.fcl.2013.02.001 Google Scholar
T. C. B. Pollard, S. E. Gwilym and A. J. Carr,
“The assessment of early osteoarthritis,”
J. Bone Jt. Surg. Br. Vol., 90-B
(4), 411
–421
(2008). http://dx.doi.org/10.1302/0301-620X.90B4.20284 Google Scholar
C. W. Jones et al.,
“Laser scanning confocal arthroscopy of a fresh cadaveric knee joint,”
Osteoarthritis Cartilage, 15
(12), 1388
–1396
(2007). http://dx.doi.org/10.1016/j.joca.2007.05.003 OSCAEO 1063-4584 Google Scholar
A. F. Benjamin et al.,
“Fiber-optic fluorescence imaging,”
Nat. Methods, 2
(12), 941
–950
(2005). http://dx.doi.org/10.1038/nmeth820 1548-7091 Google Scholar
Y. Pan et al.,
“Hand-held arthroscopic optical coherence tomography for in vivo high-resolution imaging of articular cartilage,”
J. Biomed. Opt., 8
(4), 648
–654
(2003). http://dx.doi.org/10.1117/1.1609201 JBOPFO 1083-3668 Google Scholar
P. H. Tran et al.,
“In vivo endoscopic optical coherence tomography by use of a rotational microelectromechanical system probe,”
Opt. Lett., 29
(11), 1236
–1238
(2004). http://dx.doi.org/10.1364/OL.29.001236 OPLEDP 0146-9592 Google Scholar
C. C. B. Wang et al.,
“Optical determination of anisotropic material properties of bovine articular cartilage in compression,”
J. Biomech., 36
(3), 339
–353
(2003). http://dx.doi.org/10.1016/S0021-9290(02)00417-7 JBMCB5 0021-9290 Google Scholar
D. W. Ebert et al.,
“Articular cartilage optical properties in the spectral range 300-850 nm,”
J. Biomed. Opt., 3
(3), 326
–333
(1998). http://dx.doi.org/10.1117/1.429893 JBOPFO 1083-3668 Google Scholar
K. Wang, J. Wu and T. B. Kirk,
“Depth-dependent refractive index of normal and early degenerated articular cartilage,”
J. Biomed. Opt., 18
(10), 105003
(2013). http://dx.doi.org/10.1117/1.JBO.18.10.105003 JBOPFO 1083-3668 Google Scholar
S. Z. Wang et al.,
“Assessment of depth and degeneration dependences of articular cartilage refractive index using optical coherence tomography in vitro,”
Connect. Tissue Res., 51
(1), 36
–47
(2010). http://dx.doi.org/10.3109/03008200902890161 Google Scholar
K. Wang et al.,
“Utilizing confocal microscopy to measure refractive index of articular cartilage,”
J. Microsc., 248
(3), 281
–291
(2012). http://dx.doi.org/10.1111/jmi.2012.248.issue-3 JMICAR 0022-2720 Google Scholar
K. Wang,
“A confocal microscopic technique to determine the refractive index of soft tissues and its application to articular cartilage,”
Perth
(2013). Google Scholar
Q. Wang et al.,
“Altered osmotic swelling behavior of proteoglycan-depleted bovine articular cartilage using high frequency ultrasound,”
Phys. Med. Biol., 53
(10), 2537
–2552
(2008). http://dx.doi.org/10.1088/0031-9155/53/10/006 PHMBA7 0031-9155 Google Scholar
E. D. Harris et al.,
“Effects of proteolytic enzymes on structural and mechanical properties of cartilage,”
Arthritis Rheum., 15
(5), 497
–503
(1972). http://dx.doi.org/10.1002/(ISSN)1529-0131 Google Scholar
L. Qin et al.,
“Ultrasound detection of trypsin-treated articular cartilage: its association with cartilaginous proteoglycans assessed by histological and biochemical methods,”
J. Bone Miner. Metab., 20
(5), 281
–287
(2002). http://dx.doi.org/10.1007/s007740200040 Google Scholar
J. L. Cook et al.,
“The OARSI histopathology initiative– recommendations for histological assessments of osteoarthritis in the dog,”
Osteoarthritis Cartilage, 18
(Suppl. 3), S66
–S79
(2010). http://dx.doi.org/10.1016/j.joca.2010.04.017 OSCAEO 1063-4584 Google Scholar
A. G. Nerlich,
“Histochemical and immunohistochemical staining of cartilage sections,”
Handbook of Histology Methods for Bone and Cartilage, 295
–314 Humana Press, Totowa, New Jersey
(2003). Google Scholar
I. Kiviranta et al.,
“Microspectrophotometric quantitation of glycosaminoglycans in articular cartilage sections stained with Safranin O,”
Histochem. Cell Biol., 82
(3), 249
–255
(1985). http://dx.doi.org/10.1007/BF00501401 Google Scholar
I. Martin et al.,
“Method for quantitative analysis of glycosaminoglycan distribution in cultured natural and engineered cartilage,”
Ann. Biomed. Eng., 27
(5), 656
–662
(1999). http://dx.doi.org/10.1114/1.205 ABMECF 0090-6964 Google Scholar
L. C. U. Junqueira, G. Bignolas and R. R. Brentani,
“Picrosirius staining plus polarization microscopy, a specific method for collagen detection in tissue sections,”
Histochem. J., 11
(4), 447
–455
(1979). http://dx.doi.org/10.1007/BF01002772 HISJAE 0018-2214 Google Scholar
L. C. Junqueira, W. Cossermelli and R. Brentani,
“Differential staining of collagens type I, II and III by sirius red and polarization microscopy,”
Arch. Histol. Jpn., 41
(3), 267
–274
(1978). http://dx.doi.org/10.1679/aohc1950.41.267 AHJPB6 0004-0681 Google Scholar
G. S. Montes and L. C. Junqueira,
“The use of the Picrosirius-polarization method for the study of the biopathology of collagen,”
Mem. Inst. Oswaldo Cruz, 86
(Suppl. 3), 1
–11
(1991). http://dx.doi.org/10.1590/S0074-02761991000700002 MIOCAS 0074-0276 Google Scholar
P. Whittaker et al.,
“Quantitative assessment of myocardial collagen with picrosirius red staining and circularly polarized light,”
Basic Res. Cardiol., 89
(5), 397
–410
(1994). http://dx.doi.org/10.1007/BF00788278 Google Scholar
A. A. Young et al.,
“Extended confocal microscopy of myocardial laminae and collagen network,”
J. Microsc., 192
(2), 139
–150
(1998). http://dx.doi.org/10.1046/j.1365-2818.1998.00414.x JMICAR 0022-2720 Google Scholar
T. A. Miller et al.,
“Hindlimb unloading induces a collagen isoform shift in the soleus muscle of the rat,”
Am. J. Physiol. Regul. Integr. Comp. Physiol., 281
(5), R1710
–R1717
(2001). Google Scholar
W. Drexler et al.,
“Correlation of collagen organization with polarization sensitive imaging of in vitro cartilage: implications for osteoarthritis,”
J. Rheumatol., 28
(6), 1311
–1318
(2001). JRHUA9 0315-162X Google Scholar
A. Changoor et al.,
“A polarized light microscopy method for accurate and reliable grading of collagen organization in cartilage repair,”
Osteoarthritis Cartilage, 19
(1), 126
–135
(2011). http://dx.doi.org/10.1016/j.joca.2010.10.010 OSCAEO 1063-4584 Google Scholar
C. B. Raub et al.,
“Microstructural remodeling of articular cartilage following defect repair by osteochondral autograft transfer,”
Osteoarthritis Cartilage, 21
(6), 860
–868
(2013). http://dx.doi.org/10.1016/j.joca.2013.03.014 OSCAEO 1063-4584 Google Scholar
M. T. Nieminen et al.,
“ relaxation reveals spatial collagen architecture in articular cartilage: a comparative quantitative MRI and polarized light microscopic study,”
Magn. Reson. Med., 46
(3), 487
–493
(2001). http://dx.doi.org/10.1002/mrm.v46:3 MRMEEN 0740-3194 Google Scholar
L. C. Hughes, C. W. Archer and I. Ap Gwynn,
“The ultrastructure of mouse articular cartilage: collagen orientation and implications for tissue functionality. A polarised light and scanning electron microscope study and review,”
Eur. Cells Mater., 9
(Jan–Jun), 68
–84
(2005). Google Scholar
B. He et al.,
“Microstructural analysis of collagen and elastin fibres in the kangaroo articular cartilage reveals a structural divergence depending on its local mechanical environment,”
Osteoarthritis Cartilage, 21
(1), 237
–245
(2013). http://dx.doi.org/10.1016/j.joca.2012.10.008 OSCAEO 1063-4584 Google Scholar
J. P. Arokoski et al.,
“Decreased birefringence of the superficial zone collagen network in the canine knee (stifle) articular cartilage after long distance running training, detected by quantitative polarised light microscopy,”
Ann. Rheum. Dis., 55
(4), 253
–264
(1996). http://dx.doi.org/10.1136/ard.55.4.253 ARDIAO 0003-4967 Google Scholar
L. J. Müller et al.,
“A new three-dimensional model of the organization of proteoglycans and collagen fibrils in the human corneal stroma,”
Exp. Eye Res., 78
(3), 493
–501
(2004). http://dx.doi.org/10.1016/S0014-4835(03)00206-9 EXERA6 0014-4835 Google Scholar
H. Muir,
“Proteoglycans of cartilage,”
J. Clin. Pathol., s3–12
(1), 67
–81
(1978). http://dx.doi.org/10.1136/jcp.s3-12.1.67 JCPAAK 0021-9746 Google Scholar
W. M. Lai, J. S. Hou and V. C. Mow,
“A triphasic theory for the swelling and deformation behaviors of articular cartilage,”
J. Biomech. Eng., 113
(3), 245
–258
(1991). http://dx.doi.org/10.1115/1.2894880 JBENDY 0148-0731 Google Scholar
J. Rieppo et al.,
“Structure-function relationships in enzymatically modified articular cartilage,”
Cells Tissues Organs, 175
(3), 121
–132
(2003). http://dx.doi.org/10.1159/000074628 1422-6405 Google Scholar
G. Kent et al.,
“Changes in crystal size and orientation of acidic glycosaminoglycans at the fracture site in fractured necks of femur,”
J. Bone Jt. Surg. Br. Vol., 65-B
(2), 189
–194
(1983). Google Scholar
X.-J. Wang et al.,
“Group refractive index measurement of dry and hydrated type I collagen films using optical low-coherence reflectometry,”
J. Biomed. Opt., 1
(2), 212
–216
(1996). http://dx.doi.org/10.1117/12.227699 JBOPFO 1083-3668 Google Scholar
J. A. Buckwalter and H. J. Mankin,
“Articular cartilage. 1. Tissue design and chondrocyte-matrix interactions,”
J. Bone Joint Surg. Am. Vol., 79A
(4), 600
–611
(1997). Google Scholar
M. Rutgers et al.,
“Evaluation of histological scoring systems for tissue-engineered, repaired and osteoarthritic cartilage,”
Osteoarthritis Cartilage, 18
(1), 12
–23
(2010). http://dx.doi.org/10.1016/j.joca.2009.08.009 OSCAEO 1063-4584 Google Scholar
G. Verberne et al.,
“Techniques for assessment of wear between human cartilage surfaces,”
Wear, 266
(11–12), 1216
–1223
(2009). http://dx.doi.org/10.1016/j.wear.2009.03.042 WEARCJ 0043-1648 Google Scholar
A. Hayes et al.,
“Wear of articular cartilage: the effect of crystals,”
Proc. Inst. Mech. Eng. Part H: J. Eng. Med., 207
(1), 41
–58
(1993). http://dx.doi.org/10.1243/PIME_PROC_1993_207_267_02 Google Scholar
D. Dayan et al.,
“Are the polarization colors of Picrosirius red-stained collagen determined only by the diameter of the fibers?,”
Histochemistry, 93
(1), 27
–29
(1989). http://dx.doi.org/10.1007/BF00266843 HCMYAL 0301-5564 Google Scholar
H. R. Moody et al.,
“In vitro degradation of articular cartilage: does trypsin treatment produce consistent results?,”
J. Anat., 209
(2), 259
–267
(2006). http://dx.doi.org/10.1111/joa.2006.209.issue-2 JOANAY 0021-8782 Google Scholar
H. Lorenz and W. Richter,
“Osteoarthritis: cellular and molecular changes in degenerating cartilage,”
Prog. Histochem. Cytochem., 40
(3), 135
–163
(2006). http://dx.doi.org/10.1016/j.proghi.2006.02.003 PHCCAS 0079-6336 Google Scholar
L. C. Dijkgraaf et al.,
“The structure, biochemistry, and metabolism of osteoarthritic cartilage: a review of the literature,”
J. Oral Maxillofac. Surg., 53
(10), 1182
–1192
(1995). http://dx.doi.org/10.1016/0278-2391(95)90632-0 JOMSDA 0278-2391 Google Scholar
A. D. Pearle, R. F. Warren and S. A. Rodeo,
“Basic science of articular cartilage and osteoarthritis,”
Clin. Sports Med., 24
(1), 1
–12
(2005). http://dx.doi.org/10.1016/j.csm.2004.08.007 Google Scholar
J. M. Mansour,
“Biomechanics of cartilage,”
Kinesiology: The Mechanics & Pathomechanics of Human Movement, 66
–79 Lippincott Williams and Wilkins, Philadelphia
(2003). Google Scholar
|


