
|
|
1.IntroductionThe imaging performance of an optical microscope is often degraded by sample-induced wavefront aberrations. Adaptive optics (AO) has proven to be an effective strategy to counter such aberrations.1,2 In its most common implementation, called pupil AO, a wavefront correcting device, typically a deformable mirror (DM), is placed in the rear focal plane of the objective lens.3 This implementation works well when the wavefront aberrations are spatially, or shift, invariant, such as in the case of spherical aberrations. However, in many cases the sample-induced aberrations are spatially varying. In these cases, the placement of the DM in the pupil plane can lead to a limitation in the field of view (FOV) of the AO correction. This limitation has been well-known in astronomical imaging, where it has been circumvented with an alternative AO implementation called conjugate AO,4,5 which involves placing the DM in a plane conjugate to a primary sample aberration plane, leading to an increase in the correction FOV. More recently, this same principle of conjugate AO has made its way to the microscopy community. Reports in both simulation6–8 and experiment9–13 have demonstrated the FOV advantage of conjugate AO as well as its feasibility. For example, conjugate AO has been applied in scanning microscopy configurations using both one-9 and two-photon10,11 microscopy. It has also been applied in widefield (i.e., nonscanning) microscopy configurations with transillumination geometries.12,13 The last of these involved the use of an extended-source wavefront sensor where the transillumination itself served to determine the wavefront aberrations, obviating the need for a “guide star” within the sample. While in principle this same wavefront sensor could be applied in a fluorescence microscopy application, making use of the sample fluorescence itself as the illumination source to measure wavefront aberrations, we found this difficult to implement in practice. Our goal in this paper is to report an improved extended-source wavefront sensor strategy that continues to obviate the requirement of a guide star while also being applicable to widefield fluorescence microscopy in thick, scattering samples, such as tissue. 2.Extended Source Wavefront SensingThe crux of our previous transillumination conjugate AO implementation13 was an extended-source wavefront sensor based on the use of a camera and a partitioned detection aperture, called a partitioned-aperture wavefront (PAW) sensor. This was originally developed to perform quantitative phase imaging either in a transmission14 or reflection15 geometry, and shares the same property of a Shack–Hartmann (SH) wavefront sensor that it provides a measure of local flux-density tilts in a light beam that is partially coherent. Some advantages of PAW sensing are that it can tolerate a higher degree of spatial incoherence (or flux-density tilt diversity) than SH sensing and it offers higher spatial resolution. We exploited these advantages, the first in particular, to perform wavefront sensing using partially coherent transillumination through an extended object separated by a distance from a primary aberration plane. In addition, to accommodate possible nonuniformities in the spatial distribution of the object, we complemented PAW-wavefront with a correction algorithm based on the van Cittert–Zernike (VCZ) theorem. While this worked well with extended transillumination, we found it did not work well with extended fluorescence. Several factors contributed to this. First, fluorescence generally provides a weak and inherently noisy signal, undermining SNR. Second, while our VCZ algorithm was effective at compensating for nonuniformities of densely distributed sources, it did not work as well with sparsely distributed sources. Third, and most egregious, while PAW sensing can tolerate a high degree of spatial incoherence, it fails when the incoherence becomes too severe. More precisely, PAW requires the angular diversity of the source illumination to be smaller than the numerical aperture (NA) of the detection optics (ideally it should be half the detection NA). In this case, when the source illumination comes from fluorescent molecules near the detection focal plane, the detection NA becomes so overfilled that the PAW sensor becomes hardly sensitive to flux-density tilts at all. To address the aforementioned three problems, we turn here to an alternative strategy where the illumination source for wavefront sensing comes not from fluorescence, but from light delivered into the sample externally. Bearing in mind that transillumination is difficult, if not impossible, in many imaging applications such as in vivo imaging in thick tissue, we choose an alternative wavefront sensing strategy involving illumination delivered from the same side as the detection optics. Namely, we choose oblique back-illumination microscopy (OBM), which has been demonstrated to provide both phase and amplitude imaging (i.e., wavefront imaging) in arbitrarily thick scattering samples.16–19 In fact, OBM and PAW are conceptually similar, the former being based on oblique illumination and the latter being based on oblique detection. Because the light source is delivered externally in OBM, its power can be adjusted to be arbitrarily high, mitigating the problem of weak signal. Because it undergoes backscattering within the sample, it provides extended-source illumination that is highly homogeneous and dense, mitigating that problem of source nonuniformity or sparsity. Finally, as detailed as follows, OBM is expected to be more tolerant to angular diversity than PAW in cases when the illumination is highly spatially incoherent, making it a better choice than PAW in epi-detection strategies based on multiply scattered back illumination. To roughly compare the performance of PAW and OBM, we adopt here the simple one-dimensional (1-D) model shown in Fig. 1, while noting that an extension to two-dimensional (2-D) is straightforward. In this model, a sample-induced local change in the tilt of the illumination flux density at the microscope front focal plane (object plane) leads to a shift of the illumination intensity distribution at the back focal plane (aperture plane), where is the focal length of the objective and we have adopted a small tilt angle approximation. The half-aperture size is denoted by , and we assume that the angular diversity of the illumination is so broad compared to the aperture size that we need only consider its curvature. That is, we model the illumination intensity incident on the aperture as a parabola, given by where characterizes the illumination width and is introduced to take into account a bias tilt angle. In the case of PAW sensing where the back illumination is delivered on axis, ; in the case of OBM where the back illumination is delivered off axis, . When a sample feature, such as a density variation, causes the illumination tilt angle to change, this leads to a lateral shift of the intensity distribution by a distance , which in turn can be monitored as a change in power transmitted through the aperture. In both cases, we may write In the case of PAW, the aperture is partitioned into two half-apertures (in 1-D), and the total powers and transmitted through these half-apertures are measured simultaneously. In the case of OBM, the powers and transmitted through the full aperture are measured sequentially while changing the sign of (and hence ). A simple calculation obtains To compare the performance of PAW and OBM, we can compare the respective SNRs associated with a measurement of (or, equivalently, ). Assuming the dominant noise sources are shot noise and camera readout noise (characterized by ), we find14 where and are in units of photoelectrons per exposure time (i.e., unitless), and the approximation comes from the assumption that the illumination power is generally ample (i.e., shot-noise-limited). We thus see that SNR contains two contributions, one purely geometric, characterized by , and another depending on detection-associated noise, characterized by .Fig. 1Principles of PAW and OBM wavefront sensing. Solid red lines indicate the cones of illumination arising from back illumination in the absence of aberrations at the focal plane. Shaded red areas indicate the sample-induced tilt of these cones caused by aberrations, and the resultant shift of parabolic beam profile at the back aperture plane by a distance . In PAW, the powers and through half-apertures are measured simultaneously. In OBM, they are measured sequentially through the full aperture (only shown–the measurement of would involve changing the sign of ). 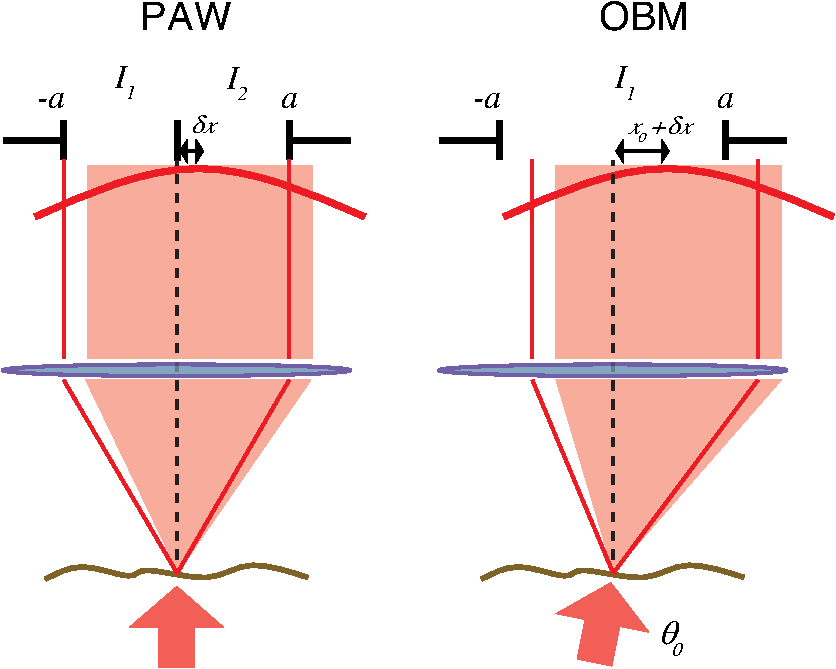 Finally, to first order in and , we arrive at where is the detection numerical aperture of the wavefront sensor.Bearing in mind that is generally twice as large as because it utilizes the full detection aperture, we conclude that OBM outperforms PAW when the ratio is greater than unity. In our case, (see below), meaning that OBM should outperform PAW for larger than . While it is difficult to evaluate in practice, numerical simulations16 suggest that it is somewhere on the order 30 deg, meaning that OBM is likely to be favorable, thus motivating the use of OBM as a wavefront sensor for conjugate AO. We emphasize again that our ultimate goal is to obtain improved fluorescence imaging, even though we are not using the fluorescence itself for wavefront sensing. 3.Method and ResultsOur setup is shown in Fig. 2. Broadly, it consists of two components, one for wavefront sensing (OBM) and the other for fluorescence imaging. The illumination for wavefront sensing is provided by four red LEDs (Thorlabs M625L3 625 nm), coupled into optical fibers (Thorlabs BFL48-1000; 0.48 NA; 1-mm core) symmetrically distributed about the microscope objective (Olympus XLUMPlanFL; ; ; 2-mm working distance; water immersion). The offset separation of the fiber ends from the objective axis is , as ensured by a three-dimensional printed holder. The LEDs are activated sequentially, and the illumination from the fibers undergoes multiple scattering so that a portion is redirected backward into the objective, whereupon it becomes imaged by the OBM wavefront sensor. The optical path includes a unit-magnification relay, a DM (Boston Micromachines Corp. MultiDM; square actuator array) tilted , followed by another unit magnification relay to the OBM camera (PhotonFocus MV1-D2080-160-CL). A 10-mm aperture is inserted in this last relay, which defines the overall numerical aperture of the OBM wavefront sensor (). A bandpass filter () ensures that only the red LED light is incident on this camera. Fig. 2Illustration of our conjugate AO setup. Red shaded areas indicate the imaging path for OBM wavefront sensing, while green shaded areas indicate the fluorescence imaging path. Dashed lines represent conjugate planes associated with fluorescence imaging. BS = dichromatic beamsplitters. TL = tunable lens. The total microscope magnification is .  The fluorescence excitation source is a blue LED (Thorlabs M490L3 490 nm). The excitation light is directed by a long pass dichromatic mirror (BS1, Semrock 495 nm) into the sample via the microscope objective. The resultant fluorescence signal is epi-collected and reflected by the DM, whereupon another long pass dichromatic mirror (BS2, Semrock 562 nm) directs the fluorescence to the science camera (PCO Edge 4.2 LT) via a magnification relay and emission filter (). An electrically tunable liquid lens (TL, Opotune EL-10-30-Ci) placed in the Fourier plane of the last relay enables the imaging depth to be conveniently and independently adjusted, while maintaining conjugation of the OBM camera with the aberration plane. Prior to the operation of conjugate AO, a calibration step was required to determine the reconstruction matrix linking local flux-density tilts and to voltages applied to the DM actuators. This involved activating the actuators sequentially and measuring the resultant tilts and due to the displacement of each actuator, thus obtaining the reconstruction matrix from Once calibration was completed, the AO could be engaged. This was performed in a closed-loop feedback implementation similar to the one described in Ref. 13 where the control voltages applied to the DM at each feedback iteration are given by where is the pseudo-inverse of and is an adjustable feedback gain factor of order one. The feedback drives toward zero, corresponding to a flat wavefront (i.e., to a cancellation of the sample aberrations by the DM).To test the performance of our OBM-based conjugate AO setup, we imaged a mouse kidney section stained with Alexa Fluor 488 (FluoCell Prepared Slide #3), placed on top of a thick scattering medium made of diameter polystyrene beads embedded in 2% (w/v) agarose.16 This scattering medium was designed to roughly mimic tissue, and is required to obtain back illumination from multiple scattering. To mimic spatially varying aberrations at the sample surface, a phase screen was placed on top of the fluorescent slide, consisting of a layer of photoresist coated onto a thick cover glass, featuring a 2-D sinusoidal pattern of peak-to-valley height and period , printed by a mask writer (Heidelberg DWL66).11 A wavefront measurement obtained by OBM is shown in Fig. 3(b). This can be directly compared with a measurement obtained by a commercial white-light interferometer (Zygo NT6000), as shown in Fig. 3(a). Manifestly, the two measurements are similar despite the fact that the OBM measurement was obtained using multiply scattered illumination that traversed a nonuniform sample. It should be noted that, while it is important that OBM reveals the correct aberration features, it is not as important that it reveals the correct aberration amplitudes. In particular, a simple scaling error in OBM becomes readily corrected by our closed-loop feedback implementation (hence the benefit of feedback). Fig. 3Phase-screen aberrations measured by (a) Zygo and (b) OBM. (c) DM shape measured by OBM, confirming that it is complementary to the shape of the phase screen aberrations. Scale bar .  Figure 4 shows images of the mouse kidney section before and after conjugate AO correction. As can be seen, the initial fluorescence image is severely blurred. After using conjugate AO, the image quality is greatly improved (albeit not perfectly–see Sec. 4 as follows). To verify that AO led to a final DM pattern that was indeed complementary to the aberration pattern, we used OBM to measure the DM pattern alone, as shown in Fig. 3. Unlike pupil AO, which typically provides only a limited correction FOV in the presence of spatially varying aberrations,12 conjugate AO is able to correct over almost the entire image FOV (here ), limited only by the size of the DM itself. Moreover, our OBM sensor is able to measure wavefronts at almost half video rate (requiring four frames, each at 40 Hz rate), enabling the conjugate AO to be performed in real time. Figure 5 shows a demonstration of dynamic AO correction when the sample was sporadically translated by hand. Feedback convergence took only a fraction of a second. Fig. 4Fluorescence images of an aberrated fluorescently-labeled mouse kidney section (a) without and (b) with conjugate AO correction. Scale bar .  Fig. 5Video demonstrating dynamic conjugate AO correction as the sample is sporadically translated by hand. Note, the video playback rate is intentionally reduced here to better illustrate AO feedback convergence. Scale bar . (Video 1, mp4, 16 MB [URL: http://dx.doi.org/10.1117/1.JBO.21.12.121504.1]). 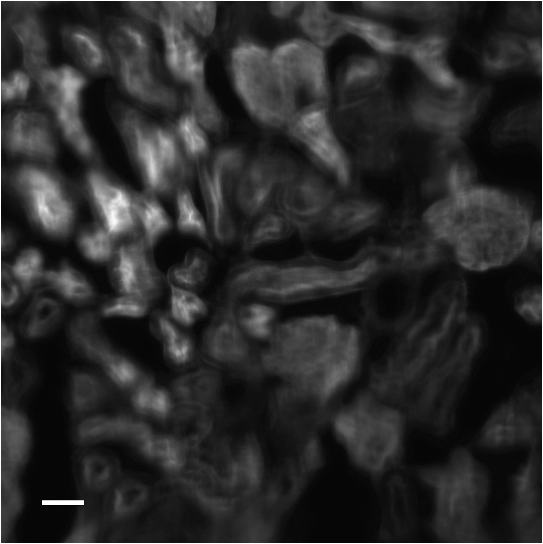 4.DiscussionWe have shown that OBM can effectively enable wavefront sensing for widefield fluorescence microscopy applications in thick samples using an epi-illumination geometry and without the use of guide stars. When sample-induced aberrations are primarily confined to a single plane, such wavefront sensing can be used to perform closed-loop conjugate AO, enabling the possibility of fast AO corrections over a large FOV. A few issues remain to be addressed. First, as in our previous demonstration of conjugate AO based on transillumination, the aberrations we corrected were somewhat artificial. Namely, they were known aberrations of well characterized structure, separated from the fluorescent object by a gap. While such a geometry involving a single, well-defined aberration layer can often be found in practice (e.g., retinal imaging or imaging dominated by interface aberrations), more general geometries involving volumetric distributions of aberrations would doubtless be more difficult to compensate with simple conjugate AO, and may require a generalization to multiconjugate AO. Nevertheless, it should be pointed out that even a single DM can provide conjugate AO correction over a relatively long axial range,10,11 meaning that a single DM is likely to be effective at providing an “average” volumetric aberration correction, even if the aberrations are widely distributed in the axial direction. Moreover, our setup was not ideal. For example, our DM was somewhat tilted relative to the focal plane and to both camera planes. Better geometries properly compensating for this tilt might improve the accuracy of our AO correction. The use of a DM with a greater number of actuators might also improve accuracy. Finally, we performed wavefront sensing using red light while intending to correct the imaging performance for green light (fluorescence). Our assumption here was that these colors are close enough that chromatic dispersion plays little role. In the event that this assumption might not hold, we could always perform wavefront sensing using green light, that is, the same color light as fluorescence, however, this would preclude the possibility of performing wavefront sensing and fluorescence imaging simultaneously. This would somewhat reduce the speed of our AO correction, which has already been slowed by the requirement of four OBM camera exposures rather than just one. As it stands, our system is somewhat hybrid in that it is a closed loop for the externally supplied illumination light, while it remains an open loop for the fluorescence light, which ultimately is the signal of interest. For example, it may be beneficial to supplement our sensor-based AO with an additional image-based AO algorithm to better refine the fluorescence image correction (e.g., using the sensor-based solution as an initial guess to an image-based solution). Our goal here is more proof-of-principle in nature. Specifically, we demonstrate that OBM can indeed provide a viable wavefront sensing strategy for potential fluorescence imaging applications in thick, scattering media tissue using conjugate AO. AcknowledgmentsThis work was partially supported by the National Science Foundation Industry/University Cooperative Research Center for Biophotonic Sensors and Systems and the National Institutes of Health. T. Bifano acknowledges a financial interest in Boston Micromachines Corporation. ReferencesJ. A. Kubby, Adaptive Optics for Biological Imaging, CRC Press, Boca Raton, Florida
(2013). Google Scholar
M. J. Booth,
“Adaptive optical microscopy: the ongoing quest for a perfect image,”
Light Sci. Appl., 3
(4), e165
(2014). http://dx.doi.org/10.1038/lsa.2014.46 Google Scholar
R. K. Tyson, Principles of Adaptive Optics, CRC Press, Boca Raton, Florida
(2015). Google Scholar
J. M. Beckers,
“Increasing the size of the isoplanatic patch with multiconjugate adaptive optics,”
in European Southern Observatory Conf. and Workshop Proc.,
693
(1988). Google Scholar
D. C. Johnston and B. M. Welsh,
“Analysis of multiconjugate adaptive optics,”
J. Opt. Soc. Am. A, 11
(1), 394
–408
(1994). http://dx.doi.org/10.1364/JOSAA.11.000394 Google Scholar
Z. Kam et al.,
“Modelling the application of adaptive optics to wide-field microscope live imaging,”
J. Microsc., 226
(1), 33
–42
(2007). http://dx.doi.org/10.1111/jmi.2007.226.issue-1 JMICAR 0022-2720 Google Scholar
R. D. Simmonds and M. J. Booth,
“Modelling of multi-conjugate adaptive optics for spatially variant aberrations in microscopy,”
J. Opt., 15
(9), 094010
(2013). http://dx.doi.org/10.1088/2040-8978/15/9/094010 JOOPDB 0150-536X Google Scholar
T. W. Wu and M. Cui,
“Numerical study of multi-conjugate large area wavefront correction for deep tissue microscopy,”
Opt. Express, 23
(6), 7463
–7470
(2015). http://dx.doi.org/10.1364/OE.23.007463 OPEXFF 1094-4087 Google Scholar
J. Thaung et al.,
“Dual-conjugate adaptive optics for wide-field high-resolution retinal imaging,”
Opt. Express, 17
(6), 4454
–4467
(2009). http://dx.doi.org/10.1364/OE.17.004454 OPEXFF 1094-4087 Google Scholar
J. H. Park, W. Sun and M. Cui,
“High-resolution in vivo imaging of mouse brain through the intact skull,”
Proc. Natl. Acad. Sci. U. S. A., 112
(30), 9236
–9241
(2015). http://dx.doi.org/10.1073/pnas.1505939112 Google Scholar
H. P. Paudel et al.,
“Axial range of conjugate adaptive optics in two-photon microscopy,”
Opt. Express, 23
(16), 20849
–20857
(2015). http://dx.doi.org/10.1364/OE.23.020849 OPEXFF 1094-4087 Google Scholar
J. Mertz, H. Paudel and T. G. Bifano,
“Field of view advantage of conjugate adaptive optics in microscopy applications,”
Appl. Opt., 54
(11), 3498
–3506
(2015). http://dx.doi.org/10.1364/AO.54.003498 APOPAI 0003-6935 Google Scholar
J. Li et al.,
“Conjugate adaptive optics in widefield microscopy with an extended-source wavefront sensor,”
Optica, 2
(8), 682
–688
(2015). http://dx.doi.org/10.1364/OPTICA.2.000682 Google Scholar
A. B. Parthasarathy et al.,
“Quantitative phase imaging using a partitioned detection aperture,”
Opt. Lett., 37 4062
–4064
(2012). http://dx.doi.org/10.1364/OL.37.004062 OPLEDP 0146-9592 Google Scholar
R. Barankov and J. Mertz,
“Single-exposure surface profilometry using partitioned aperture wavefront imaging,”
Opt. Lett., 38 3961
–3964
(2013). http://dx.doi.org/10.1364/OL.38.003961 OPLEDP 0146-9592 Google Scholar
T. N. Ford, K. K. Chu and J. Mertz,
“Phase-gradient microscopy in thick tissue with oblique back-illumination,”
Nat. Methods, 9
(12), 1195
–1197
(2012). http://dx.doi.org/10.1038/nmeth.2219 1548-7091 Google Scholar
T. N. Ford and J. Mertz,
“Video-rate imaging of microcirculation with single-exposure oblique back-illumination microscopy,”
J. Biomed. Opt., 18
(6), 066007
(2013). http://dx.doi.org/10.1117/1.JBO.18.6.066007 JBOPFO 1083-3668 Google Scholar
J. Mertz et al.,
“Phase-gradient contrast in thick tissue with a scanning microscope,”
Biomed. Opt. Express, 5
(2), 407
–416
(2014). http://dx.doi.org/10.1364/BOE.5.000407 BOEICL 2156-7085 Google Scholar
J. D. Giese, T. N. Ford and J. Mertz,
“Fast volumetric phase-gradient imaging in thick samples,”
Opt. Express, 22
(1), 1152
–1162
(2014). http://dx.doi.org/10.1364/OE.22.001152 OPEXFF 1094-4087 Google Scholar
|


