
|
|
|
Near-infrared spectral tomography (NIRST) has demonstrated its potential for breast lesion characterization and treatment monitoring.1,2 However, most studies indicate that NIRST alone may not be capable of providing the quantitative accuracy required for clinical applications because of spatial resolution limitations.3 High-spatial resolution guidance from structural images, such as x-ray or MRI, has improved the quantitative accuracy of NIRST.1,2,4,5 MRI-guided NIRST is especially suitable for breast cancer imaging because the approach leverages the high sensitivity of MRI, but improves specificity through recovery of NIRST parameters.2 To incorporate prior information from MRI into NIRST, previous approaches have segmented the MRI images into tumor and nontumor regions, each of which is assumed to be optically homogeneous. This “hard-prior” strategy reduces the size of the inversion problem by lumping regions together into a few super pixels or zones.4,5 An alternative, so called “soft-priors,” approach incorporates Laplacian- or Helmholtz-type structures into the regularization to encode spatial information that retains the inversion parameters at each pixel over the entire domain.6 Both techniques require manual segmentation to identify regions within the MRI image volume. This segmentation step adds further complexity to the processing and reduces objectivity when combining the image information. Additionally, segmentation can be time-consuming and requires sufficient experience to avoid introducing bias or error. To overcome the need for segmentation, a direct regularization method of encoding spatial priors has been developed.7 To date, spatial information incorporated into the NIRST image reconstruction has been from a single MRI sequence. However, T1-weighted (T1W), T2-weighted (T2W), T1-weighted dynamic contrast enhanced (DCE), and diffusion weighted (DW) images are often acquired in standard clinical breast MRI. Predominantly, only DCE images have been used to improve the accuracy of NIRST; however, the type of MRI sequences and the way in which it is used influences the resulting values. DCE-guided NIRST image reconstruction is based on vascular-delivered contrast, but few studies have correlated DCE images with molecular biomarkers from NIRST.2,8 Among the NIRST absorber concentrations, total hemoglobin (HbT) and water have shown the greatest potential to distinguish malignant from benign breast abnormalities.9 Yet, from a biophysical standpoint, water values are not expected to be highly related to DCE contrast, but rather DW contrast, since the latter corresponds to the free diffusion of water as measured by MRI. In this letter, a reconstruction algorithm is presented to directly encode the spatial information derived from DCE and DW MRI into multiple regularization matrices for recovering NIRST HbT and water contents. The motivation for pursuing this algorithm is to improve the accuracy of estimating HbT and water simultaneously. Simulation studies were used to test the approach, and the first image reconstructions from an patient case are presented. Light propagation in breast tissue was modeled by a diffusion equation solved by the finite element method (FEM) using the NIRFAST software package.10 Spectral constraints were directly imposed in the reconstruction.10 The image reconstruction is posed as a least squares optimization problem, defined as where is the data fidelity term, is the regularizer, and is the concentrations of oxyhemoglobin (HbO), deoxyhemoglobin (Hb), water, lipids, scatter amplitude (SA), and scatter power (SP). The conventional regularizer, , used in NIRST is , where is an identity matrix or a matrix derived from high-resolution imaging such as MRI, and is the regularization parameter. Generally, a single image volume is utilized to define and all optical parameters are regularized with the same spatial behavior.7,8 However, in practice, vascular and water perfusions in tissue are independent.Considering that DCE and HbT are associated with tissue vasculature and DW images should be correlated with the distribution of NIRST water content, DCE images were used to construct the regularization matrix () to constrain total hemoglobin (), whereas DW images were used to construct to constrain water. Thus, the regularizer was formulated as where and are regularization parameters, is the regularization matrices derived from DCE () and DW () MRI images, and have the form7 where is the grayscale value mapped to node on the FEM mesh, is the position of node on the FEM mesh, is the characteristic grayscale difference for regularization, and is a normalization factor chosen for each row so that , where is the number of finite element nodes. The function is the Heaviside step function, which determines the local weight assigned to the ’th node of the finite element mesh.11 is a factor corresponding to the distance of influence of the regularization effect. Generally, the empirical value of is 0.4. The operator encodes uniformity by penalizing similarly gray locations in the finite element nodes to have significantly similar optical concentration update values at each iteration.For choice of regularization parameters and , they are usually obtained from , where is the initial regularization parameter, is the Jacobin matrix of unknown optical concentrations, and is the transpose. To minimize the above optimization problem with respect to unknown optical properties, derivatives of Eq. (1) are set to zero. The reconstruction is stopped when the change between successive iterations is less than 2% or the maximum iteration number is reached. The algorithm scheme is shown in Fig. 1. Fig. 1NIRST image reconstruction scheme when guided by incorporating DCE and DW MRI information into the regularization matrices, and , which form a multiobjective function that influences the updates for HbT and water.  To validate the performance of the proposed algorithm, an absolute bias error in the tumor was defined7 where and represent the true and reconstructed images, respectively, and is the number of finite element nodes in the tumor.Numerical simulations were used to test the performance of the proposed algorithm. A three-dimensional (3-D) breast simulation was created from MRI slices of an actual patient with a tumor size of . The corresponding DCE (b) and DW (c) images used to construct the and matrices are shown in Fig. 2. The MRI slices were manually segmented into tumor, adipose, and fibroglandular regions based on the preconstrast T1 and DCE images. After segmentation, typical HbT, water, SA, and SP values for tumor (, 70.5%, 1.23, and 0.26), adipose (, 47%, 1.17, and 0.2), and fibrogandular (, 60%, 1.2, and 0.23) tissues from Ref. 12 were assigned to each region, as shown in Fig. 2(d). For simulation, 16 colocated source-detector positions were placed around the breast. For each source illumination, data were collected at 15 detector locations. Thus, the total number of measurements was 2160 () involving nine wavelengths (from 661 to 948 nm). Amplitude-dependent Gaussian noise with a variance of 1% was added to the simulated measurements. To obtain the initial estimates of the optical properties, the simulated data set was calibrated with a known homogeneous circular phantom. Images were reconstructed using a pixel basis of . The same and of 0.01 and 0.4 were used to construct and , respectively. The initial parameters used in different methods were same, and their value was 100. Fig. 2Simulation breast study. (a) MRI T1 image, (b) DCE image, and (c) DW image in the plane from a patient MRI exam. (d) Simulated true HbT (top) and water (bottom) images, (e–h) reconstructed HbT () and water (%) images guided by no-prior information (e), DCE prior (f), DW prior (g), and both DCE and DW (DCE-DW) priors (h). Reconstructed images are overlaid on the MRI T1 images. Red arrows in (b) and (c) indicate the tumor. White lines in (d) denote cross sections, through the center of the tumor used to display optical properties in Fig. 3.  The no-prior images [Fig. 2(e)] yielded very limited tumor contrast relative to the surrounding normal tissue (contrast values of HbT and water: 1.17 and 1.07), whereas the reconstructed images of HbT () and water content (%) using the prior information from DCE or/and DW images [Figs. 2(f)–2(h)] produced much better tumor contrast (contrast values of HbT and water: 1.58 and 1.12, 1.44 and 1.11, 1.34 and 1.14). Cross-section profiles of HbT and water through the slice [along white lines in Fig. 2(d)] are presented in Fig. 3. As shown in Fig. 3(a), the reconstructed HbT concentrations overestimated the true HbT in the tumor, especially in the DCE case, while the values from the DCE-DW guided reconstruction are closer to the true results. The cross-sectional results [Fig. 3(b)] also show that the recovered water content by combining DCE and DW images is more accurate than the results only guided by DCE or DW images. Table 1 summarizes the bias errors in HbT and water images in the tumor reconstructed by no-prior, DCE, DW, and DCE-DW image guided methods. The bias errors of HbT and water in the DCE-DW guided image reconstruction were reduced 22% and 18%, 21% and 6%, and 10% and 11%, compared to that in the no-prior, DCE- or DW-guided reconstructed images, respectively. This is aligned with a recent report on systematic validation of prior-guided diffuse optical tomography reconstructions.13 Fig. 3Cross-section profiles of (a) HbT and (b) water along the vertical line shown in Fig. 2(d). True and reconstructed profiles using no, DCE, DW, and combined DCE-DW priors are shown in different colors. 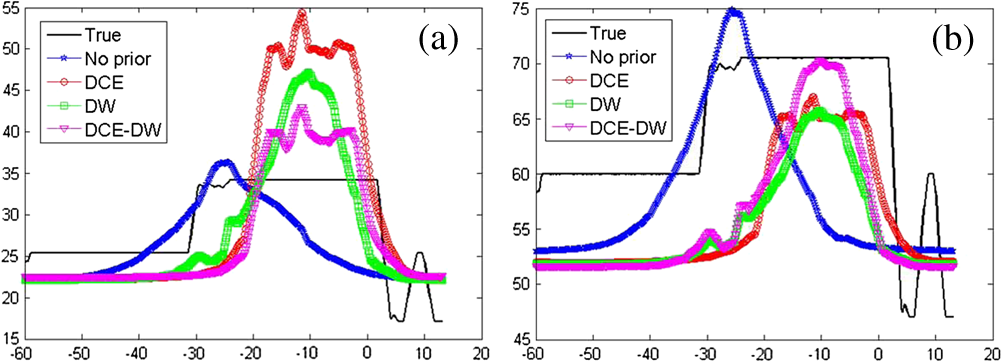 Table 1Absolute bias errors in recovered HbT and water in the tumor.
Finally, a patient image volume with actual optical measurements was reconstructed to test the proposed algorithm with in vivo data. The patient had a pathologically confirmed invasive ductal carcinoma (IDC) in her right breast. However, her BIRADS score diagnosed by two experienced radiologists (J. Xu, 15 years and K. Wang, 6 years) according to MRI images was 2, which was false-negative. Six wavelengths of frequency domain data and three wavelengths of continuous-wavelength data were collected with an MRI-guided NIRST system.1,10 Optical data and MR images (T1, T2W, DW, and DCE) were acquired simultaneously. A uniform finite element mesh was created from the precontrast T1 images without segmentation. Initial estimates of optical property values were obtained by direct calibration method. Images were reconstructed based on a pixel basis of . The same and of 0.02 and 0.4 were used to construct and , respectively; the initial regularization parameters used in all methods were the same, and the value was 10. Figure 4 shows the MR-T1, MR-DCE, MR-DW, and optical images overlaid on T1 images in the plane . The optical images reconstructed by the no-prior approach (d), guided by DCE (e), DW (f), combined DCE-DW (g) are also presented. In the no-prior images shown in Fig. 4(d), the tumor is hard to distinguish from the normal surrounding tissue in either the HbT or water images while it can be recognized in the HbT and water images in Figs. 4(e)–4(g). The tumor volume and location were defined by a radiologist based on the DCE MRI scan. The contrast values of HbT and water reconstructed by DCE and DW guided image reconstruction are 1.4 and 1.4, and 1.8 and 1.4, respectively. Comparing to the above contrast values, a better contrast in HbT and water are recovered at 4.6 and 1.6 when using DCE-DW guided image reconstruction. These higher values are more in line with what would be expected biologically, and match the higher contrasts seen in the MRI scans. It is not known exactly what the true contrast is, because of this being a clinical exam, but the benchmarks of expected biological contrast and obsered MRI contrast can be taken as a guide. Optical data correctly identified the lesion as malignant. The contrasts of HbT and water were highest in the DCE-DW case. The improvement in both parameters together is consistent with observations from the simulation studies. Fig. 4Patient images from a 36-year-old woman with a biopsy-confirmed IDC in her right breast. (a) T1 image, (b) DCE image, (c) DW image, and reconstructed HbT () and water (%) images guided by (d) no-priors, (e) DCE, (f) DW, and (g) DCE-DW priors, respectively. The reconstructed images are overlaid on the T1 images. The red arrows in (b) and (c) show the tumor.  The goal of this work has been to develop a reconstruction algorithm that directly encodes spatial information derived from both DCE and DW MRI images into separate regularization matrices to improve the accuracy of NIRST HbT and water content. The simulated and patient image reconstruction results suggest that the combined approach of DCE-DW priors enhances tumor contrast in both HbT and water images, relative to using only DCE or DW data as priors. In addition, the structural information from DCE and DW MRI is directly encoded without the need for segmentation prior to reconstruction. The manual selection of regions-of-interest is always needed since the DCE and DW MRI are very complicate (especially the low resolution of MR-DW images), and it is very difficult to adapt a computer-operable definition for the segmentation. In contrast, our direct regularization is a method that automatically combines the structure information from DCE and DW to the optical reconstruction. By this method, the subjective bias and error due to the operator’s training and experience during the segmentation process can be eliminated.5 Comparing to the algorithm reported in Ref. 14, which focused on using different regularization coefficients for unknowns from different spatial domains, it is different from our algorithm. Our multiobjective function is similar to that used in Ref. 15. However, the novelty of the proposed algorithm focused on independently regularizing (i) the vascular property values () by the DCE MRI images and (ii) the water values by DW MRI images, in order to recover NIRST HbT and water contents without a user-defined segmentation process. Moreover, the weighting factor used in Ref. 15, which controls the contribution of each individual regularization matrix to the global regularization matrix, was excluded from our algorithm. As shown in Fig. 4, the false-negative diagnosis by MRI (DCE + DW) has been corrected by NIRST imaging outcome. The malignance has been confirmed by the surgical pathologic results. In addition, as we reported in our previous paper, the sensitivity and specificity of using MRI (combining T2W, DCE, and DW) to differentiate malignant breast tumor to benign are 95% and 67%, respectively.2 We expect the specificity can be improved significantly by adding NIRST outcome, especially, the NIRST outcomes estimated from the images reconstructed by this new approach. In our experience, plays an important role in determining the image quality. Smaller may overestimate the peak value, and a larger may over-smooth. After numerous tests, we found that usually varied between the interval of [0.001, 0.1], and the default value is 0.01. According to the physiologic normal range of HbT, we also introduced an automatic selection algorithm. If HbT peak value under certain is larger than , will be increased by 0.01; if the peak value of HbT is smaller than , the will be decreased to 0.001. Additionally, if the breast density is extremely dense, is better to construct based on MR-DW images. AcknowledgmentsThis work was funded by NIH grants (R01 CA069544 and R01CA176086); STPBMEC (km201410005003), NSFC (81370038), BNP (Z141101001814107), BNSF (7142012), PSFC (2014M560032 and 2015T80030), and BJUT (002000514312015 and 2013-RXL04). ReferencesS. Jiang et al.,
“Predicting breast tumor response to neoadjuvant chemotherapy with diffuse optical spectroscopic tomography prior to treatment,”
Clin. Cancer Res., 20
(23), 6006
–6015
(2014). http://dx.doi.org/10.1158/1078-0432.CCR-14-1415 Google Scholar
M. Mastanduno et al.,
“MR-guided near-infrared spectral tomography increases diagnostic performance of breast MRI,”
Clin. Cancer Res., 21
(17), 3906
–3912
(2015). http://dx.doi.org/10.1158/1078-0432.CCR-14-2546 Google Scholar
S. R. Arridge,
“Optical tomography in medical imaging,”
Inverse Prob., 15
(2), R41
–R93
(1999). http://dx.doi.org/10.1088/0266-5611/15/2/022 INPEEY 0266-5611 Google Scholar
V. Ntziachristos et al.,
“MRI-guided diffuse optical spectroscopy of malignant and benign breast lesions,”
Neoplasia, 4 347
–354
(2002). http://dx.doi.org/10.1038/sj.neo.7900244 Google Scholar
Q. Fang et al.,
“Compositional-prior-guided image reconstruction algorithm for multi-modality imaging,”
Biomed. Opt. Express, 1
(1), 223
–235
(2010). http://dx.doi.org/10.1364/BOE.1.000223 BOEICL 2156-7085 Google Scholar
P. K. Yalavarthy et al.,
“Structural information within regularization matrices improves near infrared diffuse optical tomography,”
Opt. Express, 15 8043
–8058
(2007). http://dx.doi.org/10.1364/OE.15.008043 OPEXFF 1094-4087 Google Scholar
L. Zhang et al.,
“Direct regularization from co-registered anatomical images for MRI-guided near-infrared spectral tomographic image reconstruction,”
Biomed. Opt. Express, 6
(9), 3618
–3630
(2015). http://dx.doi.org/10.1364/BOE.6.003618 BOEICL 2156-7085 Google Scholar
Y. Zhao et al.,
“Optimization of image reconstruction for magnetic resonance imaging-guided near-infrared diffuse optical spectroscopy in breast,”
J. Biomed. Opt., 20
(5), 056009
(2015). http://dx.doi.org/10.1117/1.JBO.20.5.056009 JBOPFO 1083-3668 Google Scholar
H. Soliman et al.,
“Functional imaging using diffuse optical spectroscopy of neoadjuvant chemotherapy response in women with locally advanced breast cancer,”
Clin. Cancer Res., 16 2605
–2614
(2010). http://dx.doi.org/10.1158/1078-0432.CCR-09-1510 Google Scholar
H. Dehghani et al.,
“Near infrared optical tomography using NIRFAST: algorithm for numerical model and image reconstruction,”
Commun. Numer. Methods Eng., 25
(6), 711
–732
(2008). http://dx.doi.org/10.1002/cnm.v25:6 Google Scholar
C. G. Atkeson et al.,
“Locally weighted learning,”
Artif. Intell. Rev, 11 11
–73
(1997). http://dx.doi.org/10.1023/A:1006559212014 AIREV6 Google Scholar
S. Srinivasan et al.,
“Interpreting hemoglobin and water concentration, oxygen saturation, and scattering measured in vivo by near-infrared breast tomography,”
Proc. Natl. Acad. Sci. U. S. A., 100
(21), 12349
–12354
(2003). http://dx.doi.org/10.1073/pnas.2032822100 Google Scholar
B. Deng et al.,
“Characterization of structural-prior guided optical tomography using realistic breast models derived from dual-energy x-ray mammography,”
Biomed. Opt. Express, 6
(7), 2366
–2379
(2015). http://dx.doi.org/10.1364/BOE.6.002366 BOEICL 2156-7085 Google Scholar
A. Li et al.,
“Tomographic optical breast imaging guided by three-dimensional mammography,”
Appl. Opt., 42
(25), 5181
–5190
(2003). http://dx.doi.org/10.1364/AO.42.005181 APOPAI 0003-6935 Google Scholar
A. Doicu, Numerical Regularization for Atmospheric Inverse Problems, 93 Springer, Berlin Google Scholar
|


