|
|
1.IntroductionRefractive index (RI) fluctuations in biological tissue have been shown to exhibit statistical self-similarity.1 The signature of self-similarity is characteristically encoded in the scattering spectra recorded from biological tissues.1–4 We have recently shown that RI fluctuations in the connective tissue shows multifractality.4–6 Multifractals are a special class of multiscale self-similarity wherein multiple scaling exponents (generalized Hurst exponents) are required to characterize and explain the scaling behavior of a complex system.7–12 Born approximation-based light scattering inverse analysis method was previously explored to extract ultrastructural multifractality in index fluctuations of connective tissue slices.4 Our initial results also showed that these multifractal properties of connective tissue bear useful morphological information, which can be used for precancer detection.4–6 Note that our previous studies were done exclusively on thin connective tissue sections.4–6 However, in real situations, the intact tissues have a superficial epithelium layer and the connective tissue is beneath this epithelium layer. In conventional light scattering measurement, the superficial isotropic epithelium layer contributes significantly to the scattered signal for probing underlying index morphology in intact tissue. Therefore, conventional light scattering measurement to extract multifractality would have to pose with this problem of extracting information from the underlying connective tissue layer. Here, we present a spectral Mueller matrix (MM)-based approach in combination with multifractal detrended fluctuation analysis (MFDFA) to exclusively pick out the signature of multifractality of underlying connective tissue despite the presence of the superficial epithelium layer. Our proposed method exploits the anisotropy (linear birefringence) property of connective tissue (stroma) to selectively pick-up its multifractal signature from relevant scattering MM element (which characteristically encodes the birefringence information).13,14 It may be pertinent to note, in this regard, that recent studies have also demonstrated that changes in tissue birefringence property (quantified from MM) are related to morphological changes in cervical precancers.15,16 In our approach, we have therefore employed Born approximation-based Fourier domain preprocessing4 on wavelength variation of the selected MM elements (those encode the linear birefringence information). Such preprocessing captures information on the statistically equivalent spatial RI fluctuations of the anisotropic layer.4 The extracted index fluctuations were subsequently analyzed via MFDFA, to quantify the multifractal parameters of the underlying ultrastructural anisotropic index fluctuations. The approach was initially tested and validated in a simple tissue model comprising isotropic scatterers as superficial layer and rat tail collagen as an underlying anisotropic layer. Following successful validation, the method has been applied on intact tissues. Extracted multifractal parameters appeared to be sensitive for detection of precancer-related subtle changes in the underlying connective tissue. The potential of the multifractality of connective tissue as a label-free biomarker for precancer detection is thus suggested. The details of our experimental system, validation studies, and the results of multifractal analysis on spectral scattering MM elements from intact tissues of the human cervix are presented. 2.Method and MaterialsIn experimental and analysis strategy, we have employed Born approximation-based Fourier domain inverse analysis on wavelength variation of a selected scattering MM element for obtaining underlying connective tissue RI fluctuations.4,13,14 Essentially, in this method, backscattering spectral domain MM is recorded from a layered tissue model by using a broadband light as the excitation source.13,14 We have performed detailed validation studies on a layered tissue model, wherein was used to model the superficial isotropic layer and rat tail collagen was used to mimic the underlying anisotropic tissue layer. The schematic of our experimental setup is shown in Fig. 1. Details of elastic scattering MM measurement have been reported earlier.14 The incident broadband source (E7536, Hamamatsu Photonics, Japan) with a wavelength range from 450 to 750 nm and a spot size was used in this experiment. Polarization state generator (PSG) unit compromises of a polarizer (LPVIS100, Thorlabs, Newton, New Jersey) followed by a rotatable (PRM1/MZ8, Thorlabs, Newton, New Jersey) quarter wave plate (WPQ10M-633, Thorlabs, Newton, New Jersey) to generate four optimized elliptical polarized states. Similarly, the polarization state analyzer (PSA) unit compromises of a rotatable quarter wave plate followed by a polarizer (analyzer) to analyze four optimized elliptical polarized states. The backscattered elastic scattering signal (from the sample) was passed through the PSA unit, and then relayed to the spectrograph (Shamrock, SR- 303i-A) and CCD detector (ANDOR technology, UK) using a lens . The backscattering spectral (450 to 750 nm, spectral resolution of ) Mueller matrices were constructed from 16 polarization resolved measurements, following the approach described in our previous papers.13,14 The layered tissue model comprises of a thin (optimized to have moderate depolarization) (718467, Aldrich) and a thin collagen layer (rat tail collagen, C7661, Sigma) underneath the superficial layer. In preparation of the isotropic layer, the layer thickness was optimized to ensure that sufficient polarization preserving light reached the underlying collagen layer. The MM measurements from the rat tail collagen samples were performed before and after treating the collagen with 5% () acetic acid. The collagen samples were not removed from the sample chamber during acetic acid treatment, to ensure that MM measurements are performed from the same site before and after acetic acid treatment. Fig. 1Schematic of the experimental system for backscattering spectroscopic MM measurement. Xe-lamp broad band source, excitation source (450 to 750 nm); and , collimating lenses; PSG, polarization state generator (polarizer, quarter wave plate); layer, tissue model; BS, beam splitter; MO, microscopic objective (); PSA, polarization state analyzer [quarter wave plate, polarizer (analyzer)]; , collecting lens to CCD spectrometer. 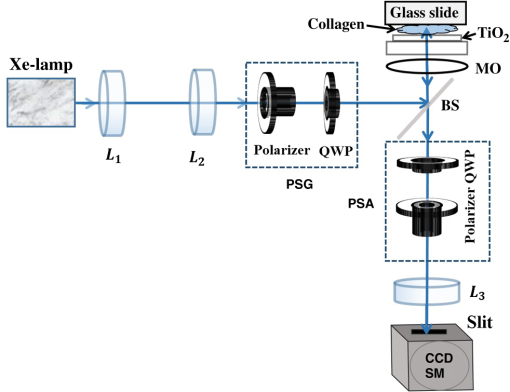 MM encodes two basic anisotropy properties, namely, the retardance (birefringence) and the diattenuation (dichroism).15,16 The former represents phase anisotropy (differential phase between orthogonal polarization), anisotropy in real part of the RI, and the latter represent amplitude anisotropy (differential attenuation via scattering and/or absorption between orthogonal polarization).13,14 In this study, backscattering spectral Mueller matrices were recorded and subsequently decomposed to extract the linear retardance parameter.13–18 The linear retardance carrying MM elements () was subjected to the Born approximation-based Fourier domain preprocessing to yield the statistically equivalent spatial RI fluctuations of the underlying anisotropic connective tissue. The extracted RI fluctuations were subjected to MFDFA to yield the multifractal parameters. Initially, this strategy was tested and validated in a simple tissue model. Finally, validated strategy was applied on histopathologically characterized [cervical intraepithelial neoplasia (CIN) or dysplasia and healthy] intact tissue samples of human cervix. The tissue samples were obtained from G. S. V. M. Medical College and Hospital, Kanpur, India (Patient age 35 to 60 years; , with , ). Standard histological preparation of the excised tissues involving fixation, dehydration, imbedding in wax, sectioning under a rotary microtome (lateral dimension , thickness ), and subsequent dewaxing was employed. Measurements were also performed on histopathologically characterized intact tissue samples (lateral dimension , thickness ). Consent for the use of all the intact tissue samples of the human cervix with normal counterparts in our study was obtained from the Ethical Committee, G. S. V. M. Medical College and Hospital, Kanpur, India, and the methods were carried out in accordance with the approved guidelines. 3.Theory3.1.Mueller Matrix Analysis for the Determination of the Polarization ParametersMM measurement gives a complete fingerprint of polarization properties of any sample/medium.13–18 MM carries information about depolarization index, diattenuation, and retardance.13–18 Once recorded, the experimental MM can be decomposed into three basis matrices of a depolarizer (), a diattenuator (), and a retarder ().18 These decomposed matrices can further be used to extract polarization properties of the medium. The magnitude of linear retardance is quantified using decomposed retarder matrix () elements as13–18 For a general retarder having both linear and circular retardance effects, the above elements are influenced both by linear and circular retardance. Equation (1) decouples the circular retardance effect and accurately determine the linear retardance . In principle, the and elements can also be used to determine , as these elements are related to magnitude of linear retardance and its orientation angle. Note that, linear retardance, expected to be negligible for isotropic medium. In contrast, is expected to have a nonzero value for anisotropic medium. The depolarization index is quantified from the elements of the depolarization matrix as13–14,18 3.2.Inverse Light Scattering Analysis in Born Approximation on Spectral Mueller Matrix ElementsWe have shown previously that the spectral variation of the scattered intensity can be used to extract information about the spatial fluctuations of the RI using the Born approximation.4 This follows from the fact that in a weakly fluctuating scattering medium such as tissue in the Born approximation, the wavelength (or angular) variation of the scattered intensity is related to the spatial variation of RI (or dielectric permitivity) by a Fourier transformation. Thus, the information on multifractality (or self-similarity) in the spatial variation of RI can also be extracted from the wavelength variation of the scattered intensity (scattering spectra). This would necessitate Fourier domain preprocessing of the scattering spectra in the Born approximation.4 Following our previous treatment, we therefore analyzed the retardance carrying scattering MM element,4,14 using the Born approximation to extract information about the spatial RI fluctuations of the anisotropic system. The rationale for the choice of the element for this inverse analysis is worth a brief mention. Note that the and elements of an MM are directly related to the magnitude of linear retardance and its orientation angle. The intensity of these elements identically vanishes if there is no linear retardance effect in the medium. Thus, any information on the multifractal nature of spatial variation of RI in an anisotropic (exhibiting linear birefringence effect) can be captured and quantified through the Born approximation-based inverse analysis performed on the wavelength variation of intensity of these elements (we have chosen element for the inverse analysis). The equivalent spatial fluctuations of RI can be extracted from the corresponding wavelength-dependent scattering MM element as4,14 where , is the scattering vector with modulus , is the scattering angle, and is the wavelength ( is related to the spatial frequency , ). This extracted index fluctuation represents equivalent spatial index fluctuations of the anisotropic scattering medium in a statistical sense. This was therefore subsequently analyzed via MFDFA to characterize and quantify the essential multifractal features hidden in an underlying anisotropic tissue ultrastructure.3.3.Multifractal Detrended Fluctuation AnalysisMFDFA is a generalized approach to characterize complex self-affine processes and system.7 The mathematical details of MFDFA can be found elsewhere.4–7 Briefly, the profile of the fluctuations series is first determined as The resulting profile is divided into nonoverlapping segments of equal length . The local trend of the series [] is then calculated by least-square polynomial fitting of the series and the resulting variance is determined The moment ()-dependent fluctuations function is then extracted by repeating the calculations and averaging over all the segments as The scaling behavior is subsequently determined by analyzing the variations of versus for each value of . For this purpose, the general scaling function can be approximated as where the generalized Hurst exponent and the classical multifractal scaling exponent are related as Note that for a stationary, mono fractal series, is identical to the Hurst exponent . Here, values of Hurst exponent 0.5, , and correspond to uncorrelated random (Brownian) fluctuations, long-range correlations or persistent behavior, and short-range correlations or antipersistent behavior, respectively.7 While the two sets of the multifractal scaling exponents and completely characterize any nonstationary fluctuations series, multifractality can be quantified using the singularity spectrum , which is related to via Legendre transformation where is the singularity strength or Holder exponent and the width of , (defined by difference between maximum and minimum values of ) represents as strength of multifractality.10,114.Results and Discussion4.1.Spectral Mueller Matrix Measurement From Layered Scattering SystemsThe results of the validation experiment on thin layer comprising of isotropic scatterers are presented in Fig. 2. Here, the spectral backscattering Mueller matrices were recorded separately from a thin layer of scatterers. As previously discussed, the thickness of this layer was optimized to ensure moderate value of the depolarization index to allow sufficient polarization preserving light to reach the underlying collagen layer. The measured scattering MM was decomposed to extract linear retardance and depolarization index. In Fig. 2(a), we have shown MM recorded from layer. For the layer, the extracted depolarization index is [Fig. 2(b)] and linear retardance [Fig. 2(c)] at 600-nm wavelength. Low value of implies isotropic nature of the layer. Moreover, there is sufficient polarization preserving fraction of light transmitting through the scattering layer. The remaining polarized preserved light after passing thorough superficial layer is sufficient enough to reach and scatter back from the underlying collagen layer. Fig. 2Manifestation of the isotropic nature of the scattering layer in the MM elements: (a) wavelength variation ( to 750 nm) of the scattering MM elements, (b) extracted wavelength variation ( to 750 nm) of depolarization index (), and (c) extracted wavelength variation ( to 750 nm) of linear retardance () of scatterers layer. The low value of the linear retardance () underscores the isotropic nature of the scatterers. 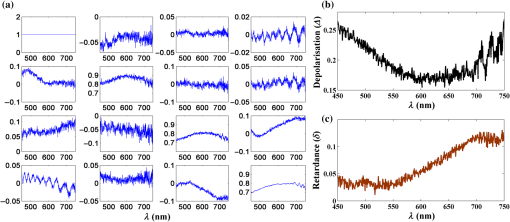 In the next step, measurements were carried out on the layered system, having both the superficial isotropic layer and underlying anisotropic rat tail collagen layer. Figure 3 shows linear retardance values extracted separately from the anisotropic collagen layer (red color plot) and from the collagen layer through the isotropic superficial layer (black color plot). The MM measurements and decomposition provide comparable linear retardance: and 0.27 rad at from the collagen layer and from the collagen layer through the superficial isotropic layer, respectively. These results demonstrate the capability of the MM measurement and analysis strategy to probe underlying anisotropic information through the superficial isotropic scattering layer. Earlier studies interpreted that the alteration in tissue multifractality may originate from the cancer-induced modification in the underlying connective tissue fibrous network and/or fiber disconnection/disorganization.19–23 To mimic alterations in connective tissue morphology, we have treated the collagen with 5% () acetic acid. This is known to degrade organized collagen fibrous structures by breaking cross-links.23–25 Mueller matrices were then measured separately from treated collagen and from treated collagen through the superficial isotropic scatterers. Figure 3 shows extracted linear retardance values for both cases: separately from acetic acid-treated collagen layer (green color plot) and acetic acid-treated collagen layer through the layer (blue color plot). The linear retardance values are observed to decrease after acetic acid treatment (e.g., at after acetic acid treatment as compared to before treatment). These results provide evidence that alterations in the underlying anisotropic layer (in the presence of a superficial isotropic scattering layer) can be probed using MM measurements. Fig. 3The MM-derived wavelength variation ( to 750 nm) of linear retardance () from the collagen layer (red square), sample having superficial scatterers and underlying collagen layer (black star), acetic acid-treated collagen layer (green circle), and sample having acetic acid-treated underlying collagen layer with the superficial scatterers (blue cross). The MM able to extract the changes of the linear retardance (anisotropy) of the underlying collagen layer as a result of acetic acid treatment. 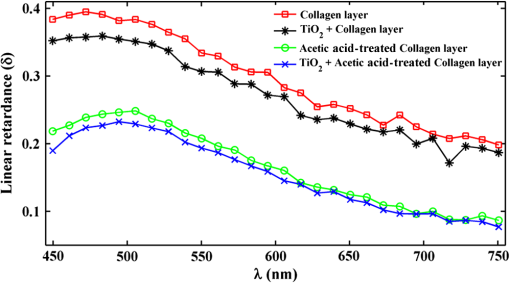 4.2.Extraction and Quantification of Multifractality in RI Fluctuations of an Anisotropic Medium from Spectral Scattering Mueller MatrixFollowing successful extraction/probing in the changes in bulk tissue anisotropy (linear retardance) from the underlying collagen layer through superficial scatterers, the proposed Born approximation-based inverse analysis method was applied to retardance carrying spectral MM element . Such inverse analysis extracts the ultrastructural RI fluctuations (which are otherwise hidden in macroscopic linear retardance values) of the underlying anisotropic collagen layer. Extracted RI fluctuations were subsequently analyzed via the MFDFA to extract multifractal parameters. Figure 4 presents results on probing multifractality in the RI fluctuations of the underlying anisotropic collagen layer through the isotropic superficial scatterers. Figure 4(a) shows selected spectral MM element , which carries information on the linear retardance (anisotropy) from rat tail collagen. Figure 4(b) shows the extracted equivalent spatial RI fluctuations of anisotropic collagen layers via Fourier domain inverse analysis. The extracted RI fluctuations from anisotropic collagen layer are subsequently subjected to MFDFA. The MFDFA-derived (following Sec. 3.3) fluctuations function, , over length scale shows different slope for different order of moment [data shown for untreated rat tail collagen in Fig. 4(c)], providing evidence of multifractality. Note that the range of length scales over which the MFDFA were carried out was chosen to be to (physical length scale calculated considering average RI of the collagen )19,26 [see abscissa of Fig. 4(c)]. These length scales were chosen based on the Fourier power spectrum, which exhibited power law scaling over these length scales (data not shown). Note that the derived fluctuation function and the resulting parameters capture information on submicron length scale RI fluctuations [determined by the length scales used to determine the variances using Eq. (5)]. The derived multifractality thus represents ultrastructural information on the anisotropic collagen layer, which is otherwise hidden in the conventional MM elements or in the bulk polarization parameters. Figure 4(d) shows the order of the moment, versus generalized Hurst exponent, , plot for the rat tail collagen sample (red line and symbol), rat tail collagen through superficial scatterers (black line and symbol), acetic acid-treated rat tail collagen (green line and symbol), and acetic acid-treated rat tail collagen through the superficial layer (blue line and symbol), respectively. Once again, multifractality is evident from considerable variation of generalized Hurst exponent, , with order of moment [Fig. 4(d)]. Moreover, change in multifractality as a result of acetic acid treatment is also apparent. Figure 4(e) shows the singularity spectrum, , plot corresponding to Fig. 4(d). Once again the results are displayed from rat tail collagen (red line and symbol), rat tail collagen through superficial scatterers (black line and symbol), acetic acid-treated rat tail collagen (green line and symbol), and acetic acid-treated rat tail collagen through the superficial scattering layer (blue line and symbol). The width of the singularity spectrum, , is a quantitative measure of the multifractality in tissue RI fluctuations. The observed reduction in the generalized Hurst exponent due to acetic acid treatment [ from 0.80 to 0.69] is indicative of the reduction in the spatial correlation of RI fluctuations of anisotropic collagen layer [Fig. 4(d)]. Similarly, acetic acid-induced modification in width of the singularity spectrum ( from 1.10 to 1.73) indicates an increase of the multifractality in RI fluctuations of collagen [Fig. 4(e)]. Increased heterogeneity (roughness) and randomness in RI fluctuations (with acetic acid treatment of collagen) are possibly responsible for the increase in multifractal strength. Importantly, all these trends in alteration in the multifractal parameters are prominetly reflected in the measurement through the superficial scattering layer as: reduces from 0.78 to 0.67 [Fig. 4(d)] and increases from 1.15 to 1.78 [Fig. 4(e)], with acetic acid treatment. The results presented above demonstrate the overall ability for detection and quantification of the multifractal parameters in the index fluctuations from underlying anisotropic collagen layer in the presence of the superficial isotropic scatterers. Following successful validation, the proposed strategy was applied to pathologically characterize intact tissue (thickness ) of a human cervix. The backscattering spectral MM measurements were performed from intact tissues containing superficial epithelium layer and underlying connective tissue layer. The measurements were performed on six nonoverlapping spots from five healthy and five precancer tissues. Subsequent inverse analysis was carried out on selected spectral MM element to extract equivalent RI fluctuations of the underlying anisotropic stromal layer. Figure 5(a) shows the moment () dependence of the generalized Hurst exponent, , from healthy (black circle) and precancerous (red square) intact tissues. Figure 5(b) shows the corresponding singularity spectrum, , for healthy (black circle) and precancerous (red square) tissues. In agreement with previous measurements on thin connective tissue sections, for the intact tissues, precancerous alterations are associated with a reduction of the generalized Hurst exponent [ to from healthy to precancerous tissue] accompanied with an increase of the strength of multifractality ( to from healthy to precancerous tissues). Note that the above trends were observed for all the tissue samples investigated. Accordingly, the multifractal parameters shown in Fig. 5, are the mean values and the corresponding standard deviations are also displayed [percentage standard deviation in to 2.4% to 1% to 5% and in : 1% to 4.47% to 1.31% to 29.5%). The results presented above indicate that the changes in the multifractal parameters (in the precancerous tissues) are primarily related to the changes in the connective tissue ultrastructure. These also demonstrate that the method can capture and quantify the multifractality of index fluctuations in the underlying anisotropic connective tissue layer through the superficial epithelial layer. The extracted multifractal parameters from underlying connective tissue may therefore serve as potential biomarker for precancer detection. Fig. 4Demonstration of the proposed method for probing multifractality in the underlying collagen layer through the isotropic superficial layer. (a) The spectral variation of the element, which carries information of the linear retardance (anisotropy) of the medium. The -axis is represented here as spatial frequency . (b) The extracted equivalent spatial index fluctuations of the anisotropic collagen layer. (c) The log–log (natural logarithm) plot of the moment ( to )-dependent fluctuations function versus length scale (using Eq. 7) (for the underlying rat tail collagen sample). (d) and (e) display the order of the moment, versus generalized Hurst exponent, plot and singularity strength, versus singularity spectrum, plot extracted from rat tail collagen (red square), rat tail collagen through (black star), acetic acid-treated collagen (green circle) and acid-treated collagen through layer (blue cross), respectively. Hurst exponent and multifractality represented by the width of the singularity spectrum () noted in figures. 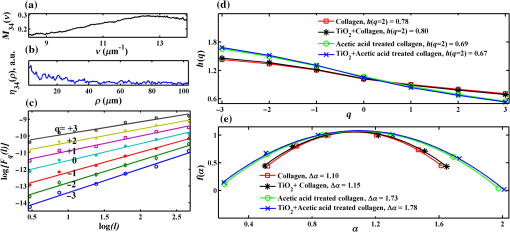 Fig. 5MFDFA-derived generalized Hurst exponent, , and singularity spectrum, , from intact tissue. (a) The moment () dependence of the MFDFA-derived generalized Hurst exponent in healthy (black circle) and precancerous (red square) intact tissue from Human cervix. (b) The corresponding singularity spectra for the healthy (black circle) and precancerous (red square) intact tissue from Human cervix. The values for and the width of the singularity spectra () are noted. 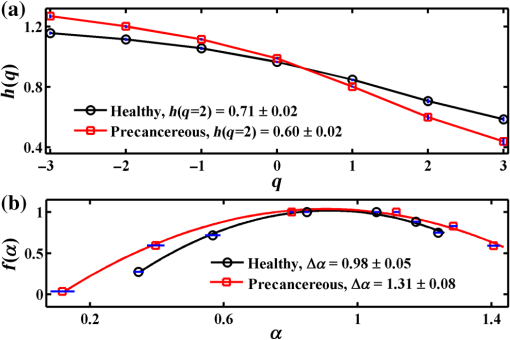 5.ConclusionIn conclusion, we have demonstrated a spectral MM-based approach in combination with MFDFA to exclusively pick out the signature of the underlying connective tissue multifractality through the superficial epithelium layer. The method is based on inverse analysis on selected spectral scattering MM elements, encoding the birefringence information on the anisotropic connective tissue. The approach was validated by quantifying alterations of multifractality in the underlying anisotropic layer through the superficial isotropic layer of a model system. In these control experiments, the method could successfully probe the changes in the multifractal parameters of the underlying anisotropic collagen layer (through superficial isotropic layer of scatterers) induced by acetic acid treatment. Following successful testing, it was employed on pathologically characterized intact tissues from human cervix. Extraction and quantification of the precancer-related subtle changes in the multifractality and correlations of spatial RI fluctuations of underlying anisotropic connective tissue network in the presence of the superficial epithelium layer was enabled by this method. These findings are particularly promising in the context of potential in vivo applications of tissue multifractality for cancer/precancer detection. We are currently expanding our investigations toward this direction. AcknowledgmentsWe would like to acknowledge Board of Research in Nuclear Sciences (BRNS)—Department of Atomic Energy (DAE), IISER Kolkata and Council of Scientific and Industrial Research (CSIR), Government of India for funding and facilities. ReferencesM. Hunter et al.,
“Tissue self-affinity and polarized light scattering in the born approximation: a new model for precancer detection,”
Phys. Rev. Lett., 97 138102
(2006). http://dx.doi.org/10.1103/PhysRevLett.97.138102 PRLTAOPRLTAO 0031-90070031-9007 Google Scholar
M. Born and E. Wolf, Principles of Optics, Cambridge University Press, Cambridge, England
(1999). Google Scholar
L. Cherkezyan et al.,
“Interferometric spectroscopy of scattered light can quantify the statistics of sub diffractional refractive-index fluctuations,”
Phys. Rev. Lett., 111 033903
(2013). http://dx.doi.org/10.1103/PhysRevLett.111.033903 PRLTAO 0031-9007 Google Scholar
N. Das et al.,
“Tissue multifractality and born approximation in analysis of light scattering: a novel approach for precancers detection,”
Sci. Rep., 4 6129
(2014). http://dx.doi.org/10.1038/srep06129 SRCEC3 2045-2322 Google Scholar
N. Das et al.,
“Probing multifractality in tissue refractive index: prospects for precancer detection,”
Opt. Lett., 38
(2), 211
–213
(2013). http://dx.doi.org/10.1364/OL.38.000211 OPLEDP 0146-9592 Google Scholar
N. Das et al.,
“Fractal anisotropy in tissue refractive index fluctuations: potential role in precancer detection,”
Proc. SPIE, 9129 91290V
(2014). http://dx.doi.org/10.1117/12.2051964 PSISDG 0277-786X Google Scholar
J. W. Kantelhardt et al.,
“Multifractal detrended fluctuation analysis of non-stationary time series,”
Physica A, 316 87
–114
(2002). http://dx.doi.org/10.1016/S0378-4371(02)01383-3 Google Scholar
H. G. E. Hentschel and I. Procaccia,
“The infinite number of generalized dimension of fractals and strange attractors,”
Physica D, 8 435
–444
(1983). http://dx.doi.org/10.1016/0167-2789(83)90235-X Google Scholar
H. E. Stanley and P. Meakin,
“Multifractal phenomenon in physics and chemistry,”
Nature, 335 405
–409
(1988). http://dx.doi.org/10.1038/335405a0 Google Scholar
P. C. Ivanov et al.,
“Multifractality in human heartbeat dynamics,”
Nature, 399 461
–465
(1999). http://dx.doi.org/10.1038/20924 Google Scholar
L. A. N. Amaral et al.,
“Behavioral-independent features of complex heartbeat dynamics,”
Phys. Rev. Lett., 86 6026
–6029
(2001). http://dx.doi.org/10.1103/PhysRevLett.86.6026 PRLTAO 0031-9007 Google Scholar
S. Lovejoy, D. Schertzer and J. D. Stanway,
“Direct evidence of multifractal atmospheric cascades from planetary scales down to 1 km,”
Phys. Rev. Lett., 86 5200
–5203
(2001). http://dx.doi.org/10.1103/PhysRevLett.86.5200 Google Scholar
N. Ghosh and I. A. Vitkin,
“Tissue polarimetry: concepts, challenges, applications, and outlook,”
J. Biomed. Opt., 16
(11), 110801
(2011). http://dx.doi.org/10.1117/1.3652896 JBOPFO 1083-3668 Google Scholar
J. Soni et al.,
“Quantitative fluorescence and elastic scattering tissue polarimetry using a eigen value calibrated spectroscopic Mueller matrix system,”
Opt. Express, 21
(13), 15475
(2013). http://dx.doi.org/10.1364/OE.21.015475 OPEXFF 1094-4087 Google Scholar
C. He et al.,
“Characterizing microstructures of cancerous tissues using multispectral transformed Mueller matrix polarization parameters,”
Biomed. Opt. Express, 6
(8), 2934
–2945
(2015). http://dx.doi.org/10.1364/BOE.6.002934 NRCAC4BOEICL 1474-175X2156-7085 Google Scholar
J. Rehbinder et al.,
“Ex vivo Mueller polarimetric imaging of the uterine cervix: a first statistical evaluation,”
J. Biomed. Opt., 21
(7), 071113
(2016). http://dx.doi.org/10.1117/1.JBO.21.7.071113 JBOPFO 1083-3668 Google Scholar
R. A. Chipman,
“Polarimetry,”
Handbook of Optics, 22 2nd ed.McGraw-Hill, New York
(1994). Google Scholar
S. Y. Lu and R. A. Chipman,
“Interpretation of Mueller matrices based on polar decomposition,”
J. Opt. Soc. Am. A, 13 1106
–1113
(1996). http://dx.doi.org/10.1364/JOSAA.13.001106 JOAOD6 0740-3232 Google Scholar
D. Arifler et al.,
“Light scattering from collagen fiber networks: micro-optical properties of normal and neoplastic stroma,”
Biophys. J., 92 3260
–3274
(2007). http://dx.doi.org/10.1529/biophysj.106.089839 BIOJAU 0006-3495 Google Scholar
T. Bogenrieder and M. Herlyn,
“Axis of evil: molecular mechanisms of cancer metastasis,”
Oncogene, 22 6524
–6536
(2003). http://dx.doi.org/10.1038/sj.onc.1206757 ONCNES 0950-9232 Google Scholar
A. J. Trimboli et al.,
“Pten in stromal fibroblasts suppresses mammary epithelial tumours,”
Nature, 461 1084
–1091
(2009). http://dx.doi.org/10.1038/nature08486 Google Scholar
J. Jagtap et al.,
“Quantitative Mueller matrix fluorescence spectroscopy for precancer detection,”
Opt. Lett., 39
(2), 243
–246
(2014). http://dx.doi.org/10.1364/OL.39.000243 OPLEDP 0146-9592 Google Scholar
N. Thekkek and R. R. Kortum,
“Optical imaging of cervical cancer detection: solution of a continuing global problem,”
Nat. Rev. Cancer, 8 725
–731
(2008). http://dx.doi.org/10.1038/nrc2462 Google Scholar
P. F. Davison, D. J. Cannon and L. P. Andersson,
“The effect of acetic acid on collagen cross-link,”
Connect. Tissue Res., 1
(3), 205
–216
(1972). http://dx.doi.org/10.3109/03008207209152076 Google Scholar
J. B. Lian et al.,
“The effects of acetic acid and pepsin on the cross linkages and ultrastructure of corneal collagen,”
Biochim. Biophys. Acta, 328 193
–204
(1973). http://dx.doi.org/10.1016/0005-2795(73)90345-0 BBACAQ 0006-3002 Google Scholar
A. N. Bashkatov et al.,
“Estimation of wavelength dependence of refractive index of collagen fibers of scleral tissue,”
Proc. SPIE, 4162 265
–268
(2000). http://dx.doi.org/10.1117/12.405952 PSISDG 0277-786X Google Scholar
BiographyNandan Kumar Das received his master of science (MSc) in physics from Vidyasagar University, West Bengal, India. Currently, he is a final year graduate student at the Indian Institute of Science Education and Research (IISER), Kolkata. He is the author and coauthor of five papers in peer-reviewed international journals in the area of optics and photonics. His research interests include fractal analysis, light–matter interactions, and biophotonics in general. Rajib Dey received his master of science (MSc) in physics from Bilaspur University, Chhattisgarh, India. Currently, he is a JRF project (sponsored by BRNS) student at the Indian Institute of Science Education and Research, Kolkata. He is the author and coauthor of two papers in peer-reviewed international journals in the area of optics and photonics. His research interests include biophotonics, fractal analysis, and light–matter interactions in general. Nirmalya Ghosh received his PhD from Raja Ramanna Center for Advanced Technology (RRCAT), India. Subsequently, he conducted his postdoctoral research at the University of Toronto, Canada. He had held the position of scientist at RRCAT and is currently an associate professor at the Department of Physical Sciences, IISER, Kolkata. He is the author and coauthor of more than 55 papers in peer-reviewed international journals, several invited reviews, and book chapters in the area of optics and photonics. |


