
|
|
1.IntroductionRetinal photocoagulation is a successful treatment for diabetic retinopathy1 and other retinal diseases. About 50% of the laser light in the visible spectrum is absorbed in the strongly pigmented retinal pigment epithelium (RPE), which is located behind the neural retina and the photoreceptors, and transformed into heat. The remaining light is absorbed in the melanin and hemoglobin of the choriocapillaris and choroid (CH). Subsequently, the RPE, CH, and the retina get thermally denaturated. However, there is heterogeneity of pigmentation between individuals by a factor of 2 in RPE2 and a factor of 3 in the CH,3 as well as age-related decrease of lens transmittance4 leads to unpredictable light transmittance and absorption at the RPE melanin, the main chromophore at the fundus. Thus, when using the same irradiation parameters for coagulation, the temperature increase is also unpredictable. Overly high temperatures in the retina can cause pain, overtreatment, and rupture of the Bruch’s membrane, which can lead to bleeding. Typically, the laser parameters are manually adjusted after evaluation of the previously applied lesions. In order to overcome those drawbacks, there are some notable new clinical trends introduced for retinal therapies that come with advantages but also increase the challenges of retinal laser therapy. For macular treatment, intravitreal anti-VEGF (vascular endothelial growth factor) therapy is replacing laser photocoagulation as the gold standard. Studies show a general superiority of anti-VEGF monotherapy or a combination of anti-VEGF with laser treatment over laser-monotherapy in diabetic macular edema, leading to a significantly better visual acuity.5 Laser therapy is of lower cost, does not carry the risk of endophthalmitis, and usually has a long-term effect while anti-VEGF therapy requires frequent, numerous, repeat injections over many years. For the treatment of diabetic macular edema, combination therapy of intravitreal anti-VEGF and guided laser coagulation reduces the required number of injections.6 The biggest disadvantage of the classical laser therapy is the lack of an objective, standardised dosimetry; so, the risk of overtreatments and subsequent scarring, micro-scotoma, and decreased vision is high. From a scientific point of view, the broad range of treatment protocols makes the comparison of studies difficult. Several new approaches to laser therapy suggest that the classic treatment protocol might aim toward lesions that are extended unnecessarily far into the inner retinal layers and generally too strong. There are new laser systems that allow the application of a whole pattern of lesions instead of single lesions.7 The lesions must be applied in a short time, since eye movements increase the risk of lesion displacement. Thus, the lesions are applied with a decreased irradiation time of usually 20 ms.7 This reduces the overall treatment time significantly. Furthermore, pain is reduced for the patients while the therapeutic effect is similar to the classic treatment.8,9 However, according to Arrhenius theory, shorter irradiation times require higher temperatures to onset denaturation.10 The crucial temperature is unknown due to the individual pigmentation. For short irradiation times, the laser power ratio between retinal disruption and a just barely visible lesion decreases, which increases the risk of overtreatment even more.11,12 Another modality is the treatment with subvisible endpoints. One laser system with integrated “endpoint management” automatically adjusts treatment time and laser power to a subvisible endpoint, which is calculated based on the Arrhenius damage integral.13 Here, the threshold for a visible lesion is titrated, and the energy is decreased to a chosen percentage of this threshold. However, this procedure strongly depends on the location of titration. Decreasing the pulse duration from the millisecond regime to the microsecond pulse duration regime results in lesions that are more selective to the RPE and spare the neurosensory retina.14 Thus, some lasers apply a train of typically pulses instead of a single millisecond pulse. Furthermore, the laser power is also reduced to an endpoint below the titrated visibility threshold. These so-called micropulsing laser systems with visible and near-infrared radiation were used in studies on patients.15 The clinical outcome in selected macular diseases is comparable to the effects of classic photocoagulation while reducing the risk of overtreatments.13,15 However, the aforementioned methods lack a spot-individual feedback, which can be crucial due to the pigmentation variation. Also, there is no unified treatment protocol, which makes comparing these studies difficult, especially since there are many different laser systems and treatment end points. Without reliable experimental temperature data, the theoretical models for temperature development and thermal damage at the retina cannot be verified. Usually, the commonly used Arrhenius integral describes the onset of a denaturation as a function of temperature and time. The peak temperature at the center of the irradiated area is used as a measure to predict the probability for an ophthalmoscopically visible denaturation.10 A new study suggests that the classic Arrhenius damage model is not suitable to describe and predict thermal retinal damage. On a culture consisting of RPE cells with added artificial pigmentation, the laser-induced temperature was measured by an infrared camera. It was found that the Arrhenius model does not accurately describe the laser-induced cell death. Instead, the temperature at the boundary of cell death seems to be a good measure and was found to be stable for different irradiation times as .16 However, the infrared camera used in this study does not allow the temperature monitoring on whole eyes, and cell death in the RPE cannot be evaluated directly in living eyes. Thus, the applicability of these postulated dynamics and threshold needs to be verified in whole living eyes. A noninvasive method to measure temperatures in light-absorbing tissues is optoacoustics.17 It was first described for selective retina therapy18 and later adapted for transpupillary thermotherapy.19 Recently, temperature data could be acquired during retinal photocoagulation on patients.20 In previous publications, we demonstrated that the real time detection of the temperature course could be used to automatically stop the treatment laser when a desired coagulation strength is reached, in order to achieve lesions of uniform size and minimize the risk of overtreatment.21 In this work, the reproducibility of the lesion sizes generated by five different laser switch-off threshold temperatures is examined. The goal was to test the irradiation time control method’s suitability for a therapeutical range from subvisible irradiations up to strong lesions that are in clinical use to date. 2.Methods2.1.Temperature DeterminationThe temperature rise of an absorber during heating can be measured by analyzing pressure waves that were generated by short probe laser pulses.22 The pressure waves’ amplitude is connected to the absorber’s temperature by the temperature dependence of the material specific Grüneisen parameter.22 It consists of the speed of sound , the heat capacity , and the thermal expansion coefficient , which is dependent on the density .22 According to Ref. 16, the optoacoustically determined temperature of a uniformly heated absorber can be expressed as where is the amplitude of the pressure wave and is the absorbed energy of the probe laser pulse. is a constant taking into account individual influences such as the sound transmittance and dampening due to impedance differences, sound interferences, and transducer characteristics. The parameters and are tissue specific and need to be determined experimentally. For fundus tissue, they were determined by simultaneous measurement of the tissue temperature and ultrasound amplitudes with thermocouples and optoacoustics, respectively, while the tissue was heated slowly and homogeneously by infrared irradiation.20 The following values were obtained on porcine eyes in vitro: is determined for each individual spot by applying probe laser pulses before the heating starts, thus the measured pressure amplitudes are calibrated to body temperature . Thus, Eq. (2) can then be solved with with known . Consequently, all parameters are known for each individual retinal site. When heating starts, the further development of can be determined with the increasing pressure according to Eq. (2). The errors of and in Eq. (2) do not reflect the actual uncertainty of the temperature calculation. They are parabolic fit parameters, which are far outside of the temperature interval of interest. So, if is varied within its measured standard deviation from to , or is increased above 100°C, the temperature variation for a typical optoacoustic pressure increase of 20% results in an error of .During retinal photocoagulation, the temperature distribution is not homogeneous in space and time due to spatially inhomogeneous light absorption in the tissue and thermal diffusion. This is also the case for the probe laser, which is applied to the same spot as the treatment laser and similarly absorbed in the RPE and CH. Thus reflects a so-called “mean weighted volume temperature” . A correction function can be applied to convert the optoacoustically measured temperature into , which occurs in the center of the irradiated area at the RPE’s anterior surface.20 If the spatial and temporal temperature distribution is calculated by the heat diffusion model according to Ref. 10, a conversion function between the peak temperature at the center of the spot () and the surface level of the RPE () and the mean weighted volume temperature can be derived. This is described in detail in Ref. 19. depends on the spot size, the heating time, but not on the overall absorption as long as the ratio between the RPE’s and choroid’s absorption is constant.20 The conversion function that is used in this work for the rabbit fundus model, a top-hat beam and a spot diameter of can be approximated by an exponential decay fit in dependence of the irradiation time : with , , , , and . This fit function was already used in a former publication.21 In this work, is defined as the highest temperature, which is achieved at the end of the irradiation time . For the determination of the end temperature , the heat diffusion equation for a rabbit fundus and a spot size of was solved for the spatial location of the peak temperature . Temperatures scale linearly with the laser power as long as the other laser parameters remain unchanged. Thus, the temperature curves differ only by a proportionality factor . The theoretical temperature curve was used as a fit function,2.2.Thermal Tissue DenaturationThe Arrhenius integral is widely used to describe the onset of tissue denaturation in dependence of the temperature and heating time.10 The damage integral is defined as follows: where is a damage index (dimensionless), is a frequency factor (), is a activation energy (), is a temperature (K), is a heating time (s), and is a universal gas constant ().The parameters and are tissue dependent and reflect the activation energy and denaturation rate, respectively. The definition of certain tissue damage by a value is arbitrary and strongly depends on the observation method. Usually, the ED50 value (50% probability to achieve a visible lesion) in white light fundus observation is used for . 2.3.Automatic Irradiation Time ControlFigure 1 shows the setup for optoacoustic temperature measurement during photocoagulation. Fig. 1Experimental setup for retinal photocoagulation, optoacoustic temperature measurement, and automatic irradiation time control. 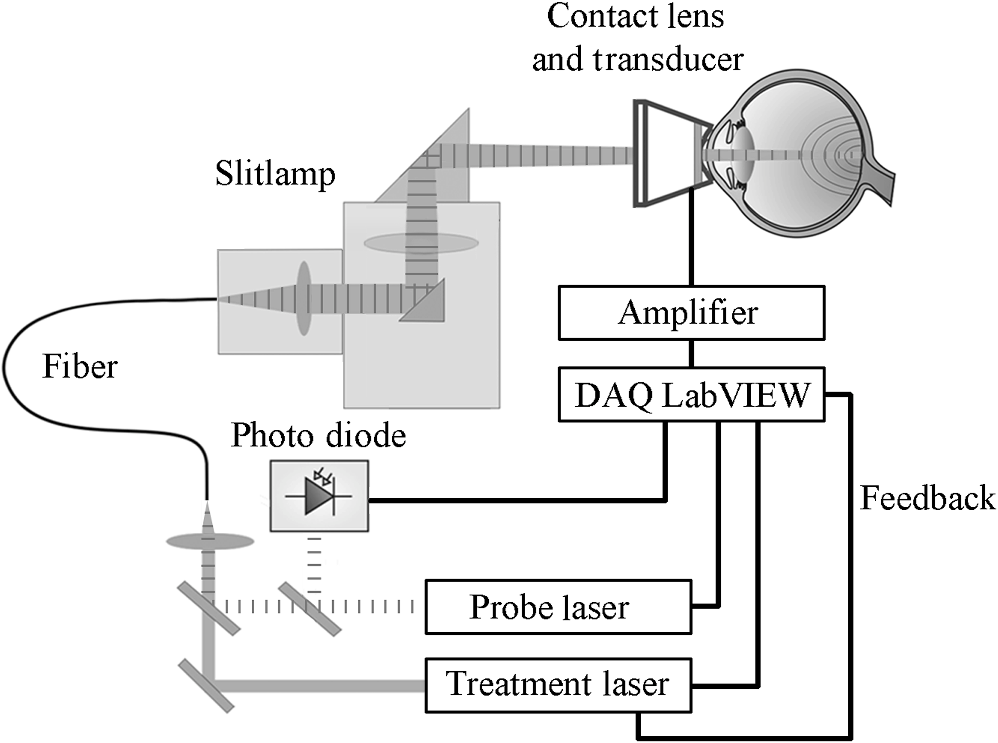 The optoacoustic pressure waves are generated by the pulses of a frequency-doubled Q-switched Nd:YLF laser (523 nm, 75 ns, 1 kHz, QC-523-1000, Crystalaser Inc.). A medical photocoagulator (frequency-doubled continuous wave Nd:YAG, 532 nm, VISULAS® 532s, Carl Zeiss Meditec AG) was used for photocoagulation. The beams of both laser systems were superimposed by a 50:50 beam splitter and coupled into the same fiber ( and ). A small amount of the probe laser pulse energy was reflected onto a photo diode (FND 100, EG&G photon devices) as a measurement trigger. The fiber was connected to the laser slit lamp (LSL 532s, Carl Zeiss Meditec AG). The optoacoustic pressure transients were detected by an annular piezoceramic ultrasonic transducer (PZT, Medical Laser Center Lübeck, Germany), which was embedded into a laser contact lens (Mainster Focal Grid, Oculus Instruments). The optoacoustic signals were amplified (Panametrics 5663 Preamp, 54 dB) and sent to a computer oscilloscope card (CompuScope 8347, Gage Applied Technologies). The data processing into temperatures and automatic shut-off of the treatment laser were performed by a self-programmed LabVIEW routine. If the shut-off criterion was exceeded, the treatment laser was switched off in a time interval shorter than 1 ms. The spot diameter was adjusted on the slit lamp as . However, the real spot size on the retina was calculated to , taking into account the geometry of the rabbit eye, which demagnifies the laser beam.23 2.4.Automatic Irradiation Time ControlAccording to the Arrhenius theory, a certain denaturation can be produced by different combinations of temperature and time.10 Our approach towards automated photocoagulation is to stop the treatment time automatically after the optoacoustically measured denaturation temperature is reached. This principle is shown in Fig. 2. Fig. 2The principle of automatic irradiation time control. The red and green lines are characteristic functions for a desired lesion strength. I, calibration phase; II, start of the heating phase; III, automatic treatment stop for mild lesion; IV, automatic treatment stop for strong lesion. 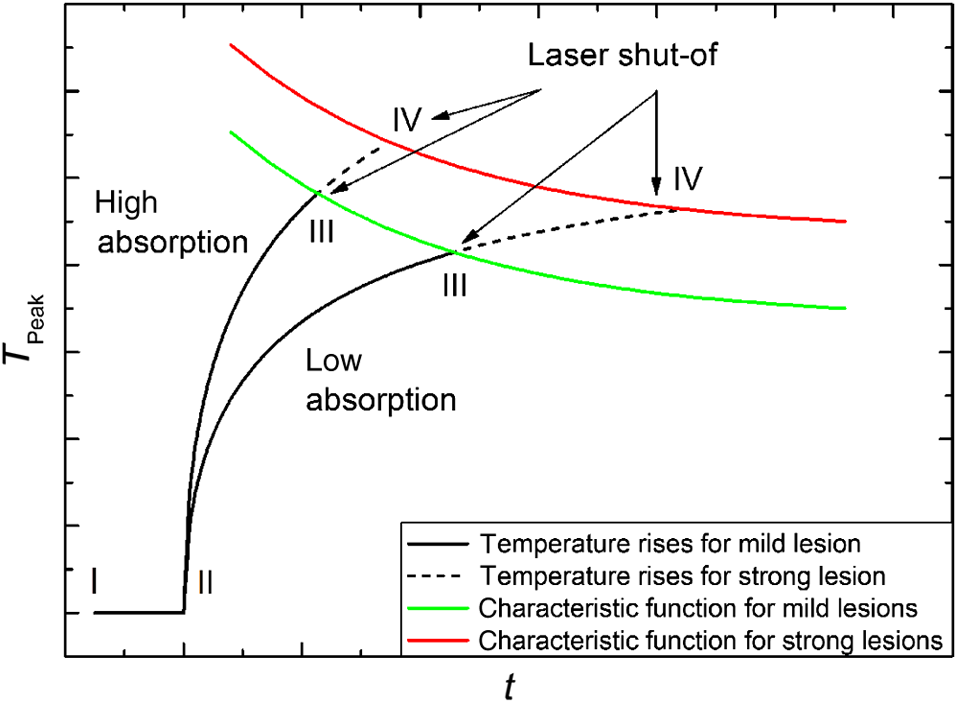 A LabVIEW routine detects the start of the treatment when the physician presses the foot switch of the laser (I in Fig. 2). Then, 20 probe laser pulses with a repetition rate of 1 kHz are applied for the normalization of the measurement to determine the proportionality factor in Eq. (2). After this procedure, the treatment laser is started (II). The temperature is now determined in real-time according to Eqs. (2) and (7). Once the temperature has reached the defined characteristic curve for a mild lesion, the treatment laser is stopped immediately (III). If stronger lesions are desired, the treatment is stopped at a later time point (IV). In a previous work, the ED50 threshold for funduscopically visible lesions 1 h after irradiation was found by probit analysis, and the Arrhenius parameters were found as and .21 Using this ED50 visibility threshold as characteristic function for automatic irradiation time control (as shown in Fig. 2) unexpectedly led to inhomogeneous lesion sizes. Thus, the ED50 threshold was used as a basis for empirical adjustment of the threshold until homogeneous lesion sizes were produced. We found that the optoacoustic mean pressure amplitude is a simple switch-off criteria for producing homogeneous lesions. For this, the mean value of all pressure amplitudes up to this point was calculated with every new data point. where is a optoacoustic normalized pressure amplitude at the time t and is a number of data points at the time t.At every time point , the mean pressure is unequivocally a measure for the peak temperature since both are time-dependent values that can be calculated from through Eqs. (2), (5), (6) , and Eq. (9) . Thus, is suitable to detect temperature-dependent thresholds. However, can be evaluated with fewer steps than the peak temperature by Eq. (9), while the measured temperature needs to be calculated from Eq. (2) and must be converted into the peak temperature by Eq. (5). Furthermore, the values of that lead to uniform lesion sizes were found to be independent of the irradiation time. Thus, there is no need for time-consuming fitting of the optoacoustic data during the irradiation. By continuously calculating the mean value, the pressure curve undergoes a low pass, suppressing the high frequency noise due to electromagnetic disturbances (see Fig. 5). Thus, fluctuations in single data points do not necessarily lead to an immediate switch-off. The longer the irradiation time, the less likely there is a disturbance of the switch-off algorithm by noise. A constant mean pressure value is a rather abstract concept, thus we calculated the time-dependent peak temperatures for the constant values at the different damage thresholds. These “characteristic functions” can be described by the following biexponential fit equation: with and .The values at the different damage thresholds and the subsequent characteristic temperature functions can be seen in Table 1. Table 1Optoacoustic mean pressure values ϕ(t) and subsequent parameters of the characteristic temperature fit functions for homogeneous lesions of different strength.
The characteristic functions plus the previously determined ED50 threshold for ophthalmic visibility can be seen in Fig. 3. Fig. 3Characteristic temperature functions for the automatic irradiation time control. Lesions strengths vary from almost never funduscopically visible A to strong white coagulation E. The dashed line is the previously found ED50 threshold, which was used for determination of the Arrhenius parameters. 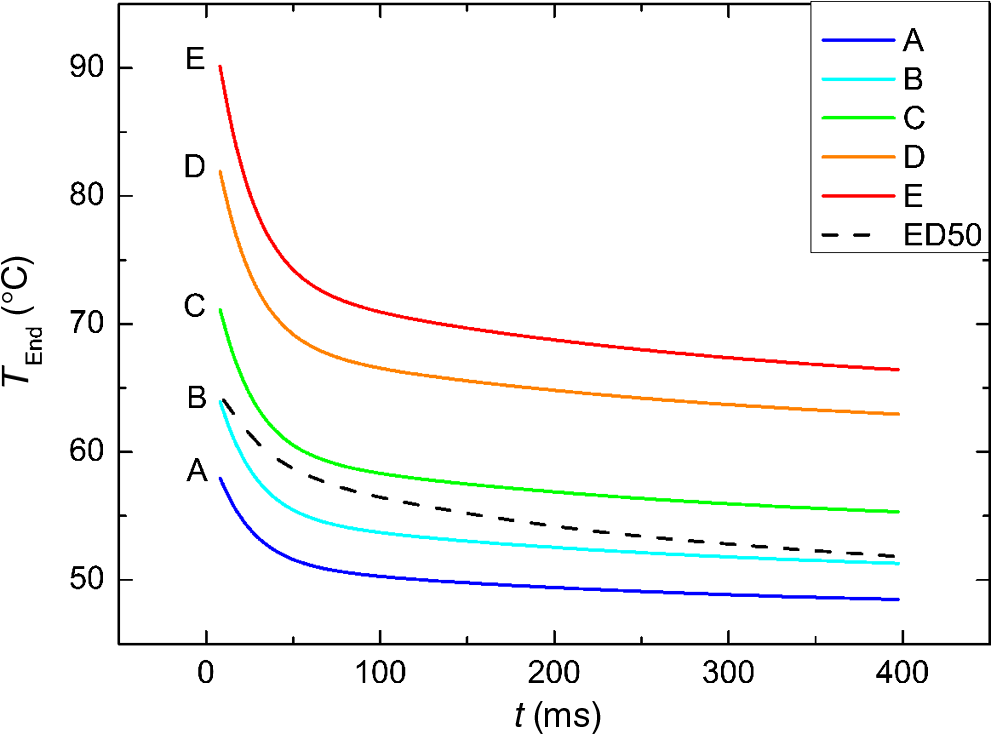 These characteristic functions are similar to an Arrhenius integral, but they have a steeper flank for shorter irradiation times. Lesions with were already experimentally tested on rabbits in vivo.21 Histological evaluation of the lesions produced by this automatic irradiation time control showed that the ganglion layer could be spared, while classic photocoagulation with a constant irradiation time of 200 ms often lead to denaturation of the inner retinal layer.24 An example is shown in Fig. 4. Fig. 4Histologies from two retinal photocoagulations in a rabbit in vivo 1 h after application. Magnification 200, laser spot diameter . Choroid CH, retinal pigment epithelium RPE, photoreceptor segments PS, outer nuclear layer ONL, inner nuclear layer INL, inner plexiform layer IPL, ganglion cell and nerve fiber layer GL. Left side: Classic photocoagulation with a constant irradiation time. , , . Right side: Automatically controlled irradiation. , , , . It can be seen that the damage is more localized and is less pronounced the right side.  and were defined for treatments below and close to the previously determined visibility threshold.20 is the previously published threshold that leads to soft visible denaturations. It gets further investigated in this study. was defined above the visibility threshold, since the lesion appearances of and were found to be soft and grayish. Stronger lesions with prominent whitening are used in clinical routine to date. Young healthy rabbits’ eyes are more homogeneously pigmented than the usual patient eyes. To simulate the variance of optical parameters in clinical use, the treatment laser power was varied over a wide range (20 to 300 mW) during automatic irradiation time control. For comparison, standard photocoagulations with a fixed treatment time of 200 ms and varied treatment laser power were applied, too. 2.5.Lesion Size DeterminationThe overall experimental treatment time was about 1 to 2 h. Then, the fundus area was photographed 1 h after the end of the last treatment by a fundus camera (VISUCAM®, Carl Zeiss Meditec AG). Three independent observers evaluated the lesion size by manually outlining the coagulated area in the digital photograph by an image editing software. Since the observers were present during the experiments, but the lesions were evaluated without having the spread sheet of the individual lesion parameters at hand. The diameters of these marked areas were measured in the software ImageJ. The scaling factor between pixels and the retina was calibrated by marker lesions with a defined center-to-center distance and was found to be about per pixel. Five eyes of three rabbits were examined by OCT 2 h after treatment. The results are published in Ref. 25. 2.6.Experiments on Rabbits In VivoThe experiments on 10 eyes of seven rabbits (Chinchilla Bastard) in vivo were carried out according to the German law for protection of animals, approved by the Ministry of Agriculture, the Environment and Rural Areas of Schleswig-Holstein, Kiel, Germany. The rabbits were anesthetized before the measurement using ketamine 10% 0.5 to and xylazine 2% 0.2 to applied intramuscularly. They were fixed in a special holding device and positioned in front of the slit lamp. Phenylephrine 5% eye drops were used to dilate the pupils and oxybuprocaine 0.4% eye drops for local anesthesia of the cornea. The modified contact lens was fixed onto the rabbit’s cornea using a special holder. Hypromellose 2% gel was used as a contact agent for optical and acoustical adaption of contact lens and cornea. The body temperature was measured rectally by a thermocouple. After the experiments, the animals were examined by a veterinarian and given to private holders. 3.Results3.1.Temperatures at the Lesion ThresholdsOptoacoustically determined peak temperature curves during laser heating are shown in Fig. 5. Fig. 5Optoacoustically measured temperatures and their corresponding fits that reflect the theoretical temperature rise according to thermal diffusion during laser heating of the retina. The end temperatures occur at the end of the irradiation and were determined as explained in Sec. 2.1.  The temperatures during laser treatment were calculated from the optoacoustic pressure amplitudes according to Eq. (2) for every irradiation. The maximum temperature was calculated according to Eqs. (5) and (6). The experimental data were fitted with the theoretical temperature curve , using the proportionality factor as in Eq. (7) as the free fit parameter. It includes the influences of ocular transmission, fundus pigmentation, and laser power. The temperature at the end of the heating process was taken from the end point of the fit curves. The characteristic functions, as shown before in Fig. 2, and the endpoints of the temperature curves during the automatic irradiation time control can be seen in Fig. 6. Fig. 6Temperatures during automatic irradiation time control. The lines are the characteristic functions A, B, C, D, E as shown in Fig. 3.  Each point represents an individual heating curve. Since constant values and not the actual temperature data were used for the automatic laser control, the temperature data end points scatters around the characteristic functions, but usually in a frame of about . 3.2.Automatic Controlled Lesion SizesLesions that were produced using the automatic switch-off algorithm for mild lesions are shown in Fig. 7. Fig. 7Fundus photograph of a typical treatment array on a rabbit in vivo. The laser power was constant in every row. 200 mark the treatments with a constant irradiation time of 200 ms, lesions in a column below A, B, C, D, and E are produced with automatic irradiation time control criteria . Observation time point was 1 h after treatment. With the treatment taking about 1 h, the resulting observation point differs from one or to two for the lesions (modified from Koinzer et al., LSM 2013, courtesy of Wiley).  In Fig. 7, it can be seen that with constant irradiation time the lesion diameter grows with higher laser power. However, with irradiation time control, the lesion diameters stay limited for automatically controlled lesions, despite the laser power variation and individually pigmented sites of the fundus. The irradiation times were automatically controlled by the switch-off algorithm between 3 and 400 ms. The detailed evaluation of the resulting lesion diameters, according to the method described in Sec. 2.5, can be seen in Fig. 8. Fig. 8Lesion diameters resulting from using different values of the mean optoacoustic pressure to automatically control the irradiation time (a, b, c, d, e). The laser power was varied from (a, b) 20 to 48 mW, (c, d) 20 to 240 mW, and (e) 30 to 100 mW. The lesion diameters resulting from a constant irradiation time of 200 ms can be seen in (f). If no funduscopically visible damage was achieved, the lesion size is shown as 0. Since several irradiations were applied with the same laser power, several data points for invisible lesions overlap.  The power range for and was limited to maximally 50 mW, since higher powers would have shortened the treatment time toward only a few milliseconds, which so far could not be handled by the automatic switch-off algorithm [Figs. 8(a) and 8(b)]. There were no coagulations applied with a constant irradiation time for higher laser powers than 100 mW while using [Fig. 8(e)]. This was decided due to the risk of retinal disruption and bleeding. In comparison, the lesions with automatic treatment control are more stable in diameter and smaller or of the same size as those without automatic control. Lesions with and have a tendency of slightly bigger diameters with increasing laser power [Figs. 8(c) and 8(d)]. creates a considerable increase in lesion diameter for laser powers of about 100 mW [Fig. 8(e)]. Without the automatic treatment control, the lesion size increases linearly with the laser power [Fig. 8(f)]. Many irradiations with and did not lead to a visible lesion. Thus, the reliability of the lesion diameter evaluation is limited for those types. The relative occurrence of visible and invisible treatments is shown in Fig. 9. In Fig. 10, the mean lesion diameter of all irradiations is shown. The different characteristic functions lead to different lesion diameters as expected, but lesions appear not significantly bigger than lesions in funduscopic evaluation. However, OCT evaluation showed that leads to a stronger damage.25 Fig. 10Box whisker plot of the visible lesions’ diameters for the five different switch-off criteria. The squares mark the mean value, the crosses the 1% and 99% boundaries, and the lines the maximum and minimum values. The funduscopically visible lesions were excluded from the mean lesion size evaluation. 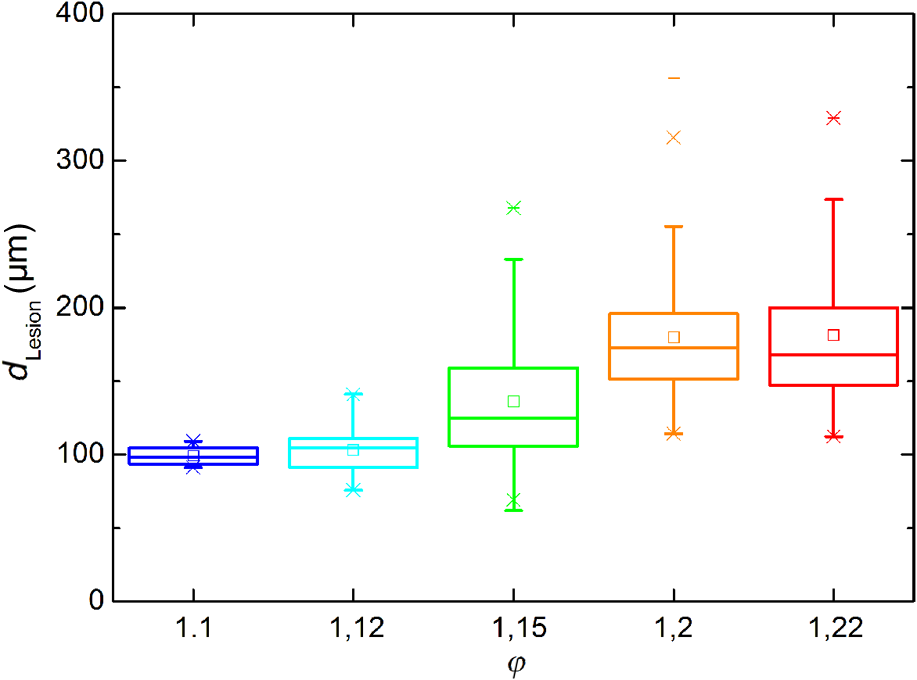 4.DiscussionIt was shown previously that optoacoustics enables noninvasive temperature measurements during retinal photocoagulation and can be performed without compromising the clinical treatment.20 Furthermore, it was shown that the temperature measurement is suitable for an automatic irradiation control by using the measured temperature-dependent optoacoustic pressure amplitudes for a feedback algorithm that shuts off the treatment laser automatically after the desired lesion strength is achieved.21,24,25 The aim of this work was the further development and investigation of the automatic irradiation time control during photocoagulation toward different degrees of coagulation. Figure 8 shows that for and the lesions are ophthalmoscopically visible on less than 30% of the irradiations. Thus, the evaluation of the lesion diameters for and is statistically uncertain. A lack of funduscopically visible damage does not indicate the complete absence of damage. It has been known for a long time that damage to the retina can be found in histologies when only 30% of the laser power for a barely visible lesion is applied ( spot diameter, , 26). Nevertheless, it is principally possible to achieve defined temperatures by using and as an automatic treatment control (see Fig. 6). Although these lesions were mostly funduscopically invisible, damage could be seen by the OCT evaluation in the outer retinal layers.25 This result demonstrates the possibility of temperature/time guided irradiation control for clinically increasingly important subvisible thermal treatments as published.13,15 Studies on rabbits and patients showed that OCT lesion classes are suitable as endpoint criteria during photocoagulation. Although the evaluation of the OCT images is also not perfectly objective, the OCT lesion classes are more defined than funduscopically visible whitening. The classes can also be used to improve the characteristic damage threshold algorithms and enable subvisible thermal laser treatment of the retina with a temperature based and, thus, objectively defined dosage.27,28 Clinical studies are necessary in order to determine if this kind of damage is sufficient for a therapeutic effect. Lesions with and have the tendency of becoming bigger with higher laser powers [see Figs. 8(c) and 8(d)]. This is an aberration from the goal to achieve lesions of uniform size. Since it is a systematic increase, it can be compensated by an empirical adaptation of the switch-off criteria. According to the lesion diameter evaluation, produces similar lesions as [see Figs. 8(e) and 8(d)], but they often get too big. If a strong coagulation occurs at the beginning of the irradiation, it leads to increased scattering in the retina.29 The tissue parameters and in Eq. (2) change during a strong coagulation. Thus, the pressure transients do not reliably reflect the retinal temperature any longer. The software routine as it has so far been implemented waits for the value to reach the threshold while the actual pressure values do not increase as expected. Thus, the resulting lesion gets too strong. Since requires a high temperature, it is highly likely that scattering disturbs the reliability of the optoacoustic data and, thus, the switch-off algorithm. In summary, lesions produced by seem to have the best reproducibility in diameter and become visible in most cases. Overall, the automatically controlled lesions are more uniform in size and appearance than those applied with a constant irradiation time. However, the standard errors of the lesion sizes are quite big for both standard and automatic irradiation. We expected that the diameters of the automatic controlled lesions would generally be more uniform. The difference to the standard treatment is limited by the overall inaccuracy and subjectivity of the lesion size evaluation on fundus photographs. The biological response of the tissues varies even under the same irradiation parameters. Another reason for irregular lesion sizes is the 1 to 2 h posttreatment observation criterion. It is known that the visible lesion diameter increases over the first hours after treatment owing to edema at the lesion borders. As this growing edematous ring around the lesion does not consist of denaturated tissue, it of course cannot be controlled by laser power or irradiation time control. Taking the visible diameter evaluation as a measure of the coagulation is very limited explaining the high standard errors. In order to evaluate the expansion of indeed coagulated tissue in more detail, we used a mathematical model10 to calculate temperatures and irradiation times that produce denaturated areas of different diameters. The Arrhenius integral Eq. (8) with the Arrhenius parameters from our previous work21 ( and ) was solved for specific temperature/time courses as solutions of the heat diffusion equation, using a top hat irradiation diameter of . We systematically increased the absorbed laser power until the corresponding temperature/time courses results in , for three different radii of interest. The results are exemplary shown in Fig. 11. Fig. 11Theoretical peak temperatures that lead to denaturated zones of 66, 100, and in diameter. For all of them an irradiation spot diameter of was assumed. was defined as the coagulated area. 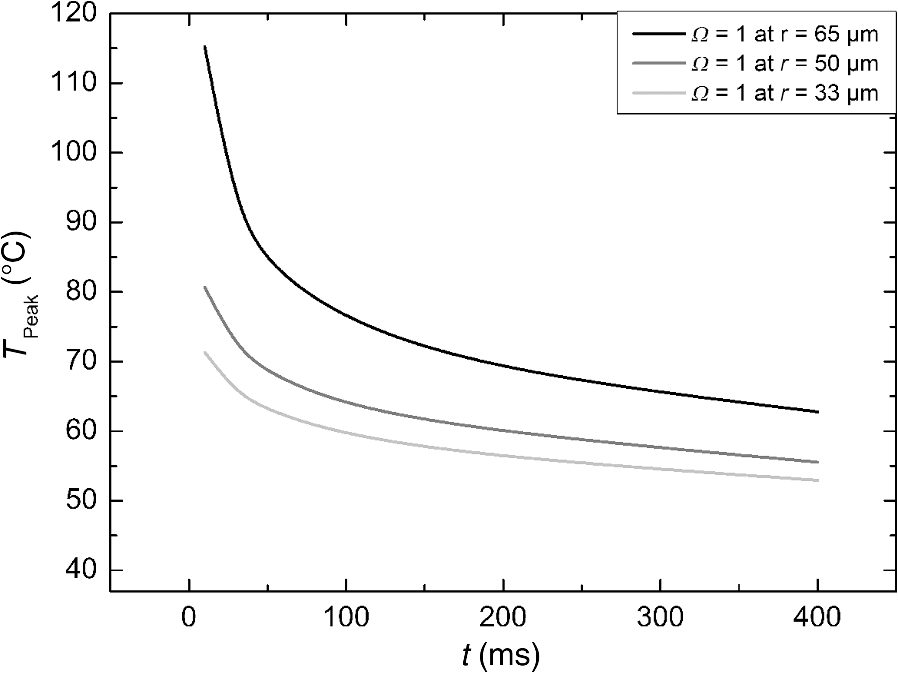 Our simulations show that it is theoretically impossible to achieve denaturated zones larger than the irradiation spot diameter in this example of with irradiation times shorter than 20 ms since the boiling temperature is exceeded with high risk chorioretinal rupture. However, in our experiments, we produced lesions two to three times the laser spot diameter with temperatures lower than 80°C. This is a strong hint that the visible whitening of the retina is mainly owed to edema and other secondary effects such as retinal detachment, and not just to denaturation. For example, OCT evaluation of the lesions produced by and also showed a detachment of the retina in the treated area.26 Using OCT lesion classifier as treatment endpoints in the future can help improve the damage evaluation and subsequently the criteria for automatic irradiation control.27,28 Our threshold temperatures are significantly lower than previously published thresholds10 but comparable with the more recent findings by Denton et al.16 The group also found a deviation from the classic damage integral dynamics. However, the study was performed on cultivated RPE cells, and instead of visual whole retinal lesion observation, the RPE cell death was used as a measure for damage. Compensation for absorption variations by automatically adjusting the irradiation time can lead to strong variations in the irradiation time since the influence of the temperature is higher than the irradiation time. This is a critical disadvantage in the clinical application for the time control. Irradiation times below a few milliseconds would increase the risk of overtreatment due to inaccurate temperature determination. With a repetition rate of 1 kHz, the temperature data would consist of only few data points in these cases. Increasing the repetition rate of the probe laser in order to generate more data points is limited since it would lead to overlays of the acoustic transients. An irradiation longer than 200 ms increases the risk of movement artifacts and is against the current trend to shorten the irradiation time. In order to avoid these strong fluctuations of the automatically controlled irradiation time, we developed an algorithm that monitors the irradiation times. If they are below 5 ms or higher than 50 ms at one spot, the treatment laser power is automatically adjusted for the next spot so that the predicted irradiation time for the next spot likely stays within the defined window. Although the pigmentation in eyes can vary from a factor 2 to 3, our first experimental results suggest that the local variation of pigmentation over small areas is small enough to keep the variation of the irradiation time within this window. However, more experiments are necessary to prove this concept. There is a recent trend toward shorting the overall treatment time by irradiating a whole pattern of lesions instead of single lesions.7 However, it comes without a temperature-based dosimetry at the cost of more nonuniform lesions with an increased risk of over treatment. The therapeutic window, defined as the ratio of laser powers that lead to a visible lesion and to a rupture, decreases for shorter irradiation times.12 Another possible implementation of temperature guided photocoagulation is an automatic laser power control based on real-time temperature adjustment with a preset fixed irradiation time of 20 ms or shorter without increasing the risk of overtreatments.30 A benefit here is the improved reproducibility of lesion’s local extension. The heated area and, thus, the volume affected by denaturation extend with longer irradiation times due to thermal diffusion.8 Shorter irradiation times help to limit the therapeutic effect to the RPE and photoreceptors while sparing the inner retina.7 Investigations toward automatic laser power control have been started. 5.ConclusionA feedback system based on optoacoustic temperature evaluation was adapted to a retinal photocoagulation system. Based on real-time measurement and evaluation of the temperature data, the treatment laser emission is stopped automatically after a desired damage is reached. Different reproducible lesion strengths from threshold to mild were achieved, which are more uniform than with conventional techniques using the same laser power and irradiation time. The diameter was limited, although the treatment laser power was varied over a wide range. It was shown in rabbits in vivo that different lesion types and subvisible lesions with a defined temperature dosage can be produced by different feedback control curves. Clinical studies implementing this concept are next steps to validate this technique. AcknowledgmentsThis work was supported by the German Ministry of Education and Research BMBF, Grant No. 01EZ0732. References
“Early photocoagulation for diabetic retinopathy,”
Ophthalmology, 98
(5 Suppl.), 766
–785
(1991). http://dx.doi.org/10.1016/s0161-6420(13)38011-7 OPANEW 0743-751X Google Scholar
S. Schmidt and R. Peisch,
“Melanin concentration in normal human retinal pigment epithelium. Regional variation and age-related reduction,”
Invest. Ophthalmol. Visual Sci., 277 1063
–1067
(1986). IOVSDA 0146-0404 Google Scholar
W. J. Geeraets et al.,
“The relative absorption of thermal energy in retina and choroid,”
Invest. Ophthalmol. Visual Sci., 1
(3), 340
–347
(1962). IOVSDA 0146-0404 Google Scholar
E. A. Boettner and J. R. Wolter,
“Transmission of the ocular media,”
Invest. Ophthalmol. Vis. Sci., 1
(6), 776
–783
(1962). IOVSDA 0146-0404 Google Scholar
P. Mitchell et al.,
“The RESTORE study: ranibizumab monotherapy or combined with laser versus laser monotherapy for diabetic macular edema,”
Ophthalmology, 118
(4), 615
–625
(2011). http://dx.doi.org/10.1016/j.ophtha.2011.01.031 12ZYASOPANEW 0950-222X0743-751X Google Scholar
G. Barteselli et al.,
“12-month results of the standardized combination therapy for diabetic macular oedema: intravitreal bevacizumab and navigated retinal photocoagulation,”
Br. J. Ophthalmol., 98 1036
–1041
(2014). http://dx.doi.org/10.1136/bjophthalmol-2013-304488 BJOPAL 0007-1161 Google Scholar
M. S. Blumenkranz et al.,
“Semiautomated patterned scanning laser for retinal photocoagulation,”
Retina, 26
(3), 370
–376
(2006). http://dx.doi.org/10.1097/00006982-200603000-00024 RETIDX 0275-004X Google Scholar
M. A. Mainster,
“Decreasing retinal photocoagulation damage: principles and techniques,”
Semin. Ophthalmol., 14
(4), 200
–209
(1999). http://dx.doi.org/10.3109/08820539909069538 SEOPE7 Google Scholar
S. Al-Hussainy, P. M. Dodson and J. M. Gibson,
“Pain response and follow-up of patients undergoing panretinal laser photocoagulation with reduced exposure times,”
Eye, 22 96
–99
(2008). http://dx.doi.org/10.1038/sj.eye.6703026 Google Scholar
R. Birngruber, F. Hillenkamp and V. P. Gabel,
“Theoretical investigations of laser thermal retinal injury,”
Health Phys., 48
(6), 781
–796
(1985). http://dx.doi.org/10.1097/00004032-198506000-00006 JAPIAUHLTPAO 0021-89790017-9078 Google Scholar
A. Obana,
“The therapeutic range of chorioretinal photocoagulation with diode and argon lasers: an experimental comparison,”
Lasers Light Ophthalmol., 43
(4), 147
–156
(1992). Google Scholar
C. Sramek et al.,
“Dynamics of retinal photocoagulation and rupture,”
J. Biomed. Opt., 14 034007
(2009). http://dx.doi.org/10.1117/1.3130282 JBOPFO 1083-3668 Google Scholar
D. Lavinsky et al.,
“Subvisible retinal laser therapy—titration algorithm and tissue response,”
Retina, 34 87
–97
(2014). http://dx.doi.org/10.1097/IAE.0b013e3182993edc RETIDX 0275-004X Google Scholar
J. Roider et al.,
“Microphotocoagulation—selective effects of repetitive short laser pulses,”
Proc. Natl. Acad. Sci. U. S. A., 90
(18), 8643
–8647
(1993). http://dx.doi.org/10.1073/pnas.90.18.8643 Google Scholar
V. Chong et al.,
“Evolving retinal laser phototherapy: less damage is better,”
Tissue-sparing Micropulse Diode Laser Photocoagulation in Practice, Supplement to Retina Today, 3
–16 ,
(2011). Google Scholar
M. L. Denton et al.,
“Spatially correlated microthermography maps threshold temperature in laser-induced damage,”
J. Biomed. Opt., 16
(3), 036003
(2011). http://dx.doi.org/10.1117/1.3548881 JBOPFO 1083-3668 Google Scholar
I. V. Larina, K. Larin and R. O. Esenaliev,
“Real-time optoacoustic monitoring of temperature in tissues,”
J. Phys. D, 38 2633
–2639
(2005). http://dx.doi.org/10.1088/0022-3727/38/15/015 JPAPBE 0022-3727 Google Scholar
G. Schüle et al.,
“Noninvasive optoacoustic temperature determination at the fundus of the eye during laser irradiation,”
J. Biomed. Opt., 9
(1), 173
–179
(2004). http://dx.doi.org/10.1117/1.1627338 JBOPFO 1083-3668 Google Scholar
J. Kandulla et al.,
“Noninvasive optoacoustic online retinal temperature determination during continuous-wave laser irradiation,”
J. Biomed. Opt., 11 041111
(2006). http://dx.doi.org/10.1117/1.2236301 JBOPFO 1083-3668 Google Scholar
R. Brinkmann et al.,
“Real-time temperature determination during photocoagulation on patients,”
J. Biomed. Opt., 17
(6), 061219
(2012). http://dx.doi.org/10.1117/1.JBO.17.6.061219 JBOPFO 1083-3668 Google Scholar
K. Schlott et al.,
“Automatic temperature controlled retinal photocoagulation,”
J. Biomed. Opt., 17
(6), 061223
(2012). http://dx.doi.org/10.1117/1.JBO.17.6.061223 JBOPFO 1083-3668 Google Scholar
M. W. Sigrist,
“Laser generation of acoustic waves in liquid and gases,”
J. Appl. Phys., 60 R83
–121
(1986). http://dx.doi.org/10.1063/1.337089 Google Scholar
R. Birngruber et al.,
“Minimal spot size on the retina formed by the optical system of the eye,”
Int. Ophthalmol., 1
(3), 175
–178
(1979). http://dx.doi.org/10.1007/BF00137496 Google Scholar
S. Koinzer et al.,
“Temperature controlled retinal photocoagulation—a step toward automated laser treatment,”
Invest. Ophthalmol. Vis. Sci., 11 8588
(2012). http://dx.doi.org/10.1167/iovs.11-8588 IOVSDA 0146-0404 Google Scholar
S. Koinzer et al.,
“Temperature-controlled retinal photocoagulation reliably generates uniform subvisible, mild, or moderate lesions,”
Transl. Vis. Sci. Technol., 4
(5), 9
(2015). http://dx.doi.org/10.1167/tvst.4.5.9 Google Scholar
R. Birngruber, V. P. Gabel and F. Hillenkamp,
“Experimental studies of laser thermal retinal injury,”
Health Phys., 44
(5), 469
–552
(1993). http://dx.doi.org/10.1097/00004032-198305000-00006 HLTPAO 0017-9078 Google Scholar
S. Koinzer et al.,
“Photocoagulation in rabbits: optical coherence tomographic lesion classification, wound healing reaction and retinal temperatures,”
Lasers Surg. Med., 45 427
–436
(2013). http://dx.doi.org/10.1002/lsm.v45.7 LSMEDI 0196-8092 Google Scholar
S. Koinzer et al.,
“Comprehensive detection, grading and growth behaviour evaluation of subthreshold and low intensity photocoagulation lesions by optical coherence tomographic and infrared image analysis,”
Biomed. Res. Intl., 492679 10
(2014). http://dx.doi.org/10.1155/2014/492679 Google Scholar
J. H. Inderfurth et al.,
“Dynamic reflectometer for control of laser photocoagulation on the retina,”
Lasers Surg. Med., 15 54
–61
(1994). http://dx.doi.org/10.1002/(ISSN)1096-9101 LSMEDI 0196-8092 Google Scholar
A. Baade et al.,
“Power-controlled temperature guided retinal photocoagulation,”
Proc. SPIE, 9307 93070B
(2015). http://dx.doi.org/10.1117/12.2083042 PSISDG 0277-786X Google Scholar
BiographyKerstin Schlott studied experimental physics at the University of Hamburg, Germany, and graduated in 2007. Since then she has been working on optoacoustic temperature measurement and automatically controlled retinal laser coagulation at the Institute of Biomedical Optics in Lübeck. Since 2014 she has been researching optoacoustic detection of laser-induced microbubbles in the pigment epithelium at the Medical Laser Center Lübeck. Stefan Koinzer graduated with an MD degree from the University of Kiel, Germany, in 2004. He did his internship in Offenburg and Kiel and completed his specialty training in ophthalmology in 2009. Since then he has been working as a research fellow for the Department of Ophthalmology at the University of Kiel in cooperation with the Medical Laser Center Lübeck. In addition to retinal laser photocoagulation, his research focuses on ocular histopathology. Alexander Baade studied physics at the Johannes Gutenberg University in Mainz, Germany, with an emphasis on quantum optics and computer physics. He graduated in 2009 and since has been working at the Medical Laser Center Lübeck. The focus of his research is optoacoustic temperature measurements during opthalmologic procedures. Reginald Birngruber studied electrical engineering and physics and graduated in physics (PhD) and in medical biophysics (MD habilis) in Germany. After his retirement from CEO and CRO of the Medical Laser Center Lübeck and the chair of the Institute of Biomedical Optics at the University Lübeck, Germany, he now makes his expertise and contacts available to colleagues in Lübeck and Boston. Current activities include mechanisms of laser tissue effects, optical tissue diagnostics, and therapy control. Johann Roider, MD, is a professor of ophthalmology. He studied mathematics, physics, and medicine at Munich universities, Germany. He did a research fellowship at the Wellman Laboratories of Photomedicine, Boston. His clinical training was obtained at the universities of Lübeck and Regensburg. Since 2002 he has been the chairman of the Department of Ophthalmology at the University of Kiel. His research focuses are laser–tissue interactions and vitreo-retinal disorders. Ralf Brinkmann studied physics at the University of Hannover, Germany, with a focus on quantum optics and lasers. After a 5-year industrial interim period, he joined the Medical Laser Center in Lübeck, Germany, in 1993, and received his PhD from the University of Lübeck. Since 2005 he has been holding a permanent position as faculty member at the University Institute of Biomedical Optics, and is also leading the Medical Laser Center as CEO. |


