

|
|
1.IntroductionFrontiers in biophotonics could be opened by adopting biological matter as an optical element.1–3 Recently, it has been discovered that a red blood cell (RBC) behaves as a tunable optofluidic biophotonic lens.1 Healthy erythrocytes have typically flexible biconcave disk-like shapes with homogeneous distribution of the refractive index. Pathological conditions affecting erythrocytes can significantly modify their natural discocyte shape, thus full morphologic characterization of RBCs is relevant for diagnostics. In fact, blood disorders are typically reflected in specific findings from erythrocytes analysis and their morphometric signature can furnish a complete diagnosis as demonstrated by challenging recent results.4–6 Several studies focus the attention on the imaging technique used to recover the morphology of RBCs for diagnostic purposes.7–9 In this sense, digital holography (DH) in microscopy10–13 has proved to be a very powerful label-free, noninvasive technique for quantitative phase imaging (QPI) of erythrocytes.14–28 In particular, in Ref. 15, the three-dimensional (3-D) morphometric analysis of flowing and not-adherent RBCs was carried out by using a shape from a silhouette algorithm.29 In this case, a simple holographic approach, in combination with holographic optical tweezers, has been demonstrated for accurate calculation of RBCs biovolume, displaying their 3-D shapes, and classifying them in terms of morphology. QPI by DH has been also applied by Moon et al.16 for automated tracking of temporal displacements of RBCs and analysis of 3-D morphology of RBCs stored in different periods.18 Moreover, blood disease identification through QPI methods have been explored for 3-D morphometry of erythrocytes measuring volumes, refractive indices, and morphological parameters.1,8 However, all the aforementioned methods require quite complex image processing for morphology retrieval in three-dimensional and 3-D and, most important, the diagnosis is subjective, as it depends on the physician’s personal evaluation of QPI images. Recently, it has been demonstrated that erythrocytes can be seen as an optofluidic biolenses1 by demonstrating their focus tunability, imaging capability, and allowing the investigation of their 3-D morphology through wavefront analysis by using Zernike polynomials. Consequently, a healthy RBC can be modeled as a biolens having two main aberrations, i.e., focus shift and third-order spherical aberration, respectively. Furthermore, due to its typical central convex shape, an erythrocyte provides two focal planes, identified by a real and a virtual focal loci. Any deviations from the biconcave disk-like shape produce a change in such foci. In fact, in analogy to adaptive optics testing, blood diagnosis has been demonstrated by screening abnormal cells through wavefront analysis applied to RBCs ensemble as a biolens array. However, it is well known that membranes of living RBCs fluctuate continuously. Consequently, it is important to study if, and how much, the mentioned fluctuations affect the foci positions in order to understand if a diagnostic based on focal spot analysis is impaired by such dynamic behavior. It is important to note that temporal fluctuations of the focal points loci have not been investigated yet, despite many studies in literature on membrane fluctuations. In fact, investigations about blood membranes fluctuation phenomenon are widely reported,24,30–34 where the strong correlation between membrane dynamics and the characterization of blood-related diseases is demonstrated.24 Since erythrocytes membrane fluctuations also affect the calculation of the RBC biolens aberrations, the position of the focus planes along the optical axis changes. Here, we report comprehensive measurement of focal spots stability of an RBCs ensemble in different experimental conditions. This study is preliminary but it opens a way for the detection of blood diseases through focal spots analysis. Specifically, we implement a 3-D tracking algorithm35,36 to locate, along the optical axis, both real and virtual foci fluctuation over time. We tested two samples with different osmolarity conditions, i.e., isotonic solution, where healthy RBCs have the classical discocyte shape, and the hypotonic solution, where erythrocytes present spherical-like shapes, respectively. In addition, we reveal that (i) focus loci stability in 3-D is influenced by the intensities of temporal fluctuations in the RBC’s thickness map, thus, a low fluctuation of the RBC membrane corresponds to a relative small variation of the position of its foci along the optical axis and vice versa and (ii) the positions of focal spots along the optical axis are synchronized, with an average movements’ correlation greater than 0.5 in both experiments. 2.Materials and Methods2.1.Experimental Setup and Samples PreparationThe experiments are realized with heparinized blood drawn within the hour before use. Blood is withdrawn into a hematocrit tube and centrifuged at room temperature, for 15 min at 2500 revolutions per minute, in order to obtain separated component parts as plasma, buffy coat, and RBCs at the bottom of the centrifuge tube. We consider two different osmolarities of the medium, i.e., that is isotonic with the membrane of RBCs where healthy erythrocytes appear as classical biconcave disk-like shapes, and a hypotonic solution at , where RBCs assume a spherical-like shape. The two samples are imaged by using a classical DH in microscopy setup, as sketched in Fig. 1(a). The laser light source is coupled into an optical fiber, which splits the laser light into an object beam (OB) and reference beam. The OB impinges on the sample (S) and passes through a microscope object before both beams are recombined using a beam splitter and are collected by the CCD camera at 10 frames per seconds. Specifically, we recorded two holographic time sequences (5 min each one, about 500 frame acquired) of the RBCs ensemble for both discocytes and spherical-like erythrocytes, with the aim to inspect their self-motility. Figures 1(b) and 1(c) show the first QPI reconstructions of time sequences of both samples. Notice that the RBCs ensemble is placed on the bottom surface of the chamber and no transversal migration occurs, a part of the Brownian motion (with null average value) around their centers of mass. 2.2.Red Blood Cells Wavefront Analysis: Focal Spots Detection and TrackingTo investigate the focal spots’ stability of erythrocytes ensemble in time, we implemented the following steps:
An example of focal spots detection and tracking processes is reported in Fig. 2. Specifically, Figs. 2(a) and 2(d) show extracted erythrocytes, obtained after step (i) by applying the anisotropic diffusion filtering, in the case of isotonic [Fig. 2(a)] and hypotonic [Fig. 2(d)] solutions. The intensity distribution maps along [Figs. 2(b) and 2(e)] and [Figs. 2(c) and 2(f)] planes highlight the detection and 3-D tracking of virtual and real foci of the single erythrocyte, labeled by white dashed line. Notice that only a real focal spot is retrieved for the spherical-like erythrocyte, while both real and virtual foci are detected for the dyscocyte.1 In Figs. 2(b) and 2(c), the virtual focus is due to the convex central portion of the RBC, while the positive focal spot is produced by the toroidal external shape. Instead, Figs. 2(e) and 2(f) refer to a spherical-like erythrocyte thus only a positive focal spot is present. Fig. 2Segmented QPI reconstructions, obtained after the anisotropic diffusion filtering, for (a) discocytes and (d) spherical-like erythrocytes. In (b and c) and (e and f) intensity distribution maps of a single RBC, labeled through white dashed line, are reported and processes of detection and tracking of the 3-D positions of foci are highlighted by indicating the positions of foci along the optical axis. 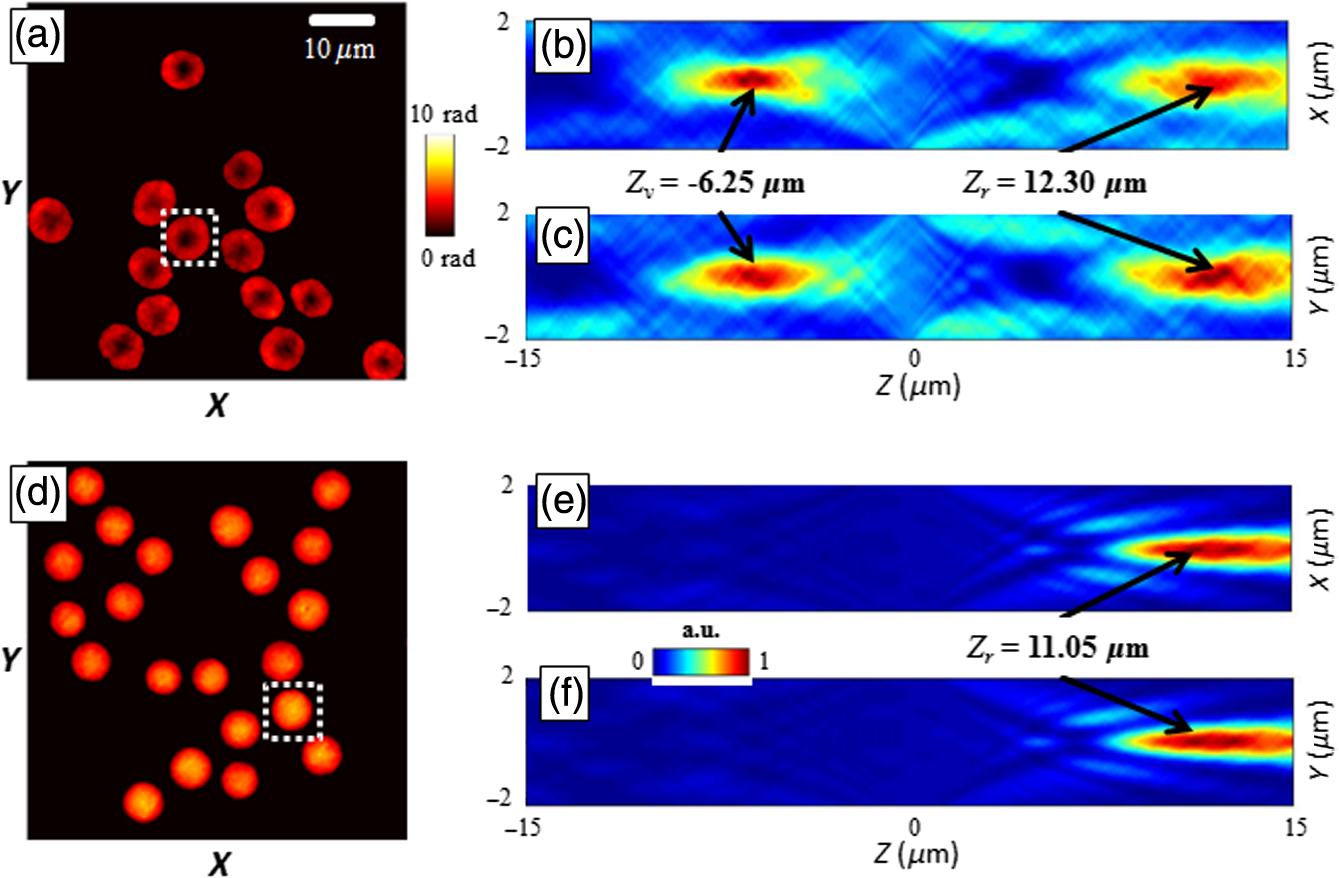 3.Results and DiscussionThe focal spots stability is investigated by applying the tracking process to focal loci of each RBC of a single QPI reconstruction observed over 5 min. Figures 3(a)–3(e) and Videos 1 and 2 show the results of focal loci tracking for time-lapse sequences of discocytes and spherical-like erythrocytes, respectively. In particular, in Fig. 3(a) (last frame of Video 1), we report the 3-D tracking of both real and virtual foci for discocytes ensemble, while only the real focal plane tracking of the spherical-like erythrocytes ensemble is show in Fig. 3(d) (last frame of Video 2). Positions of focal planes along the optical axis are influenced by the intrinsic fluctuation in RBC thickness maps. In fact, any morphological variation of the whole curvature of the erythrocyte shape alters the wavefront transmitted by RBC thus dynamically varying focal spots position along the optical axis. To prove such a relationship, we calculated the thickness maps for both QPI reconstruction sequences assuming a homogeneous refractive index for the RBCs.24,25 In this case, the physical thickness map can be derived from the QPI image by dividing it by a constant value , where with and , and is the laser wavelength. We report an example of two thickness maps in Figs. 3(b) and 3(e), from which we calculate the root-mean-square (RMS) membrane fluctuation map of RBCs24 for discocytes [Fig. 3(c)] and spherical-like erythrocytes [Fig. 3(f)], respectively. Finally, in Fig. 4, we report the time evolution of focal spots [Fig. 4(a)] and the corresponding probability density distributions [Fig. 4(b)], for a single discocyte and a single spherical-like erythrocytes, in the first 10 s of the experiment. By comparing only the real focal spot trends in time, we reveal that the spherical-like erythrocyte presents a greater focal spot variation than the discocyte, as confirmed by calculating the corresponding standard deviations [see Fig. 4(b)]. Fig. 3Results of foci tracking for time-lapse sequences of (a–c) discocytes and (d–f) spherical-like erythrocytes. (a and d) report the calculated foci positions, while (b and e) and (c and f) are the thickness maps and the RMS membrane fluctuation maps, respectively. (Video 1, MOV, 769 KB [URL: http://dx.doi.org/10.1117/1.JBO.21.12.121509.1], and Video 2, MOV, 883 KB) [URL: http://dx.doi.org/10.1117/1.JBO.21.12.121509.2], show the temporal tracking of foci and the corresponding thickness map fluctuations, for (a and b) discocytes and (d and e) spherical-like erythrocytes, respectively. 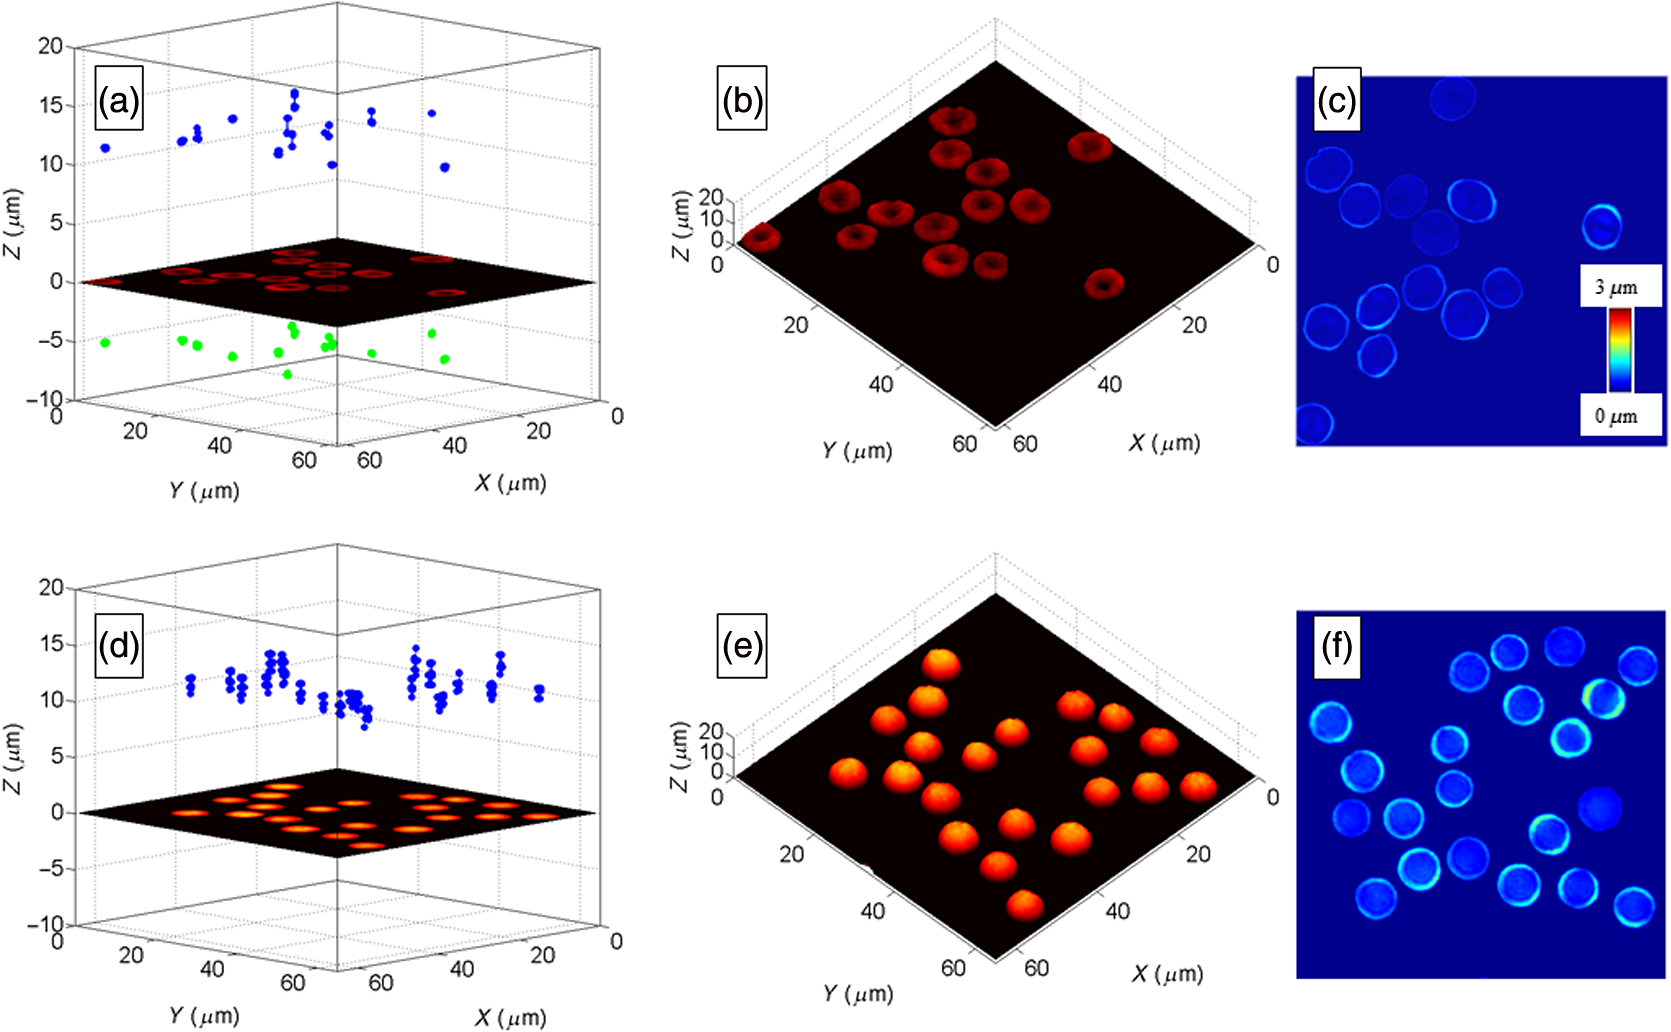 Fig. 4(a) Time evolution of focal spot position for a single discocyte and a single spherical-like erythrocyte and (b) probability density functions calculated from data in (a).  Instead, similar average values , compared to those reported in Ref. 1, are retrieved. On the other hand, observing Figs. 3(c) and 3(f), we reveal that spherical-like erythrocytes suffer from greater membrane fluctuations than discocytes, thus a correlation of these two phenomena is evident. We believe that this aspect can be attributed to (i) the intrinsic shape of spherical RBC that has less contact surface with the substrate and (ii) the hypotonic condition, where the lower osmotic pressure causes greater fluctuation sensitivity. Nevertheless, we quantitatively evaluate the relation between focal spots variation and membrane fluctuation. Let and be the vectors of optical axis positions in time of real and virtual focal spots of the ’th RBCs in the QPI reconstruction, where is the null-vector for each spherical-like erythrocyte. For each RBCs, we calculate the standard deviations of both and , then we averaged them in order to retrieve the overall focal spots variation of the RBCs’ ensemble. In Table 1, we report the calculated values, where the average operator is indicated as . By calculating the average membrane fluctuation for all RBCs as the spatial average value of the RMSs map in Figs. 3(c) and 3(f), we reveal that spherical-like erythrocytes present a two times greater average fluctuation than that of discocytes, (see first row of Table 1), in perfect agreement with the overall focal spots variation. Table 1Average values of the focal lengths standard deviations, mean values of the RBC membrane fluctuations (RMS), and CCs among different focal lengths position variations, for all the RBCs in isotonic solution (i.e., discocytes) and in hypotonic solution (i.e., spherical-like erythrocytes). For discocytes, we have both positive and negative focal lengths, while for spherical-like erythrocytes we only have the positive one.
We also discover that a sort of synchronization occurs among the foci movements. In order to quantify this, we calculate the correlation coefficient (CC) between focal spots vectors for each pair () of RBCs imaged in the segmented QPI reconstruction, with and , where is the total number of RBCs, then evaluate the corresponding average values. In Table 1, the mean value of such coefficients for both discocytes (positive and negative focus, respectively) and spherical-like erythrocytes are reported. These results confirm the correlation in the overall synchronized movements of the focus loci. This evidence in foci synchronization is an important basis for future investigation in exploiting RBC collective behavior as diagnostic paradigm. 4.ConclusionsWe report an investigation on RBCs as biophotonic lenses with the aim of characterizing their dynamic behavior. In particular, we have focused the attention on the time-stability of the focal spots of an array produced by the focusing property of RBCs. This is relevant from one side to understand how the living RBCs vary their optical specification for future exploiting as imaging biological optical elements. On the other side, the full characterization of the wavefront properties can be useful for practical purposes in medical diagnostics. In fact, the dynamic stability of foci observed as a result of the present study, allows us to claim that the change in focus for both discocytes and spherical-like erythrocytes is quite small thus avoiding any ambiguity for discriminating different types of RBCs. Therefore, the localization and tracking of their focal spots can be of fundamental importance for the analysis of the healthiness of an RBC through wavefront aberration investigation. In particular, we have studied two different kinds of RBC biolenses, a divergent one (i.e., healthy discocyte) and a convergent one (a spherical-like erythrocytes, i.e., a discocyte in a hypotonic solution). By analyzing an ensemble of each of them, we have studied the membranes’ fluctuations and the change in their focal spots positions in time. We quantified these changes through the calculation of different parameters such as the standard deviations of the focal lengths, the spatial average value of RMS map, and the CCs between two RBCs in the ensemble. Moreover, we discovered that the positions of focal spots along the optical axis are in some way synchronized, with an average movement correlation greater than 0.5 in both cases. We hypothesize that a sort of collective movement is present when the RBCs in the ensemble are close to each other at certain characteristic distances and such collective movement influence both membrane fluctuation and foci stability. This last intriguing point needs more in depth investigation for full understanding of how this can occur. ReferencesL. Miccio et al.,
“Red blood cell as an adaptive optofluidic microlens,”
Nat. Commun., 6 6502
(2015). http://dx.doi.org/10.1038/ncomms7502 NCAOBW 2041-1723 Google Scholar
V. Bianco et al.,
“Self-propelling bacteria mimic coherent light decorrelation,”
Opt. Express, 23 9388
–9396
(2015). http://dx.doi.org/10.1364/OE.23.009388 OPEXFF 1094-4087 Google Scholar
X. Fan and S. H. Yun,
“The potential of optofluidic biolasers,”
Nat. Methods, 11 141
–147
(2014). http://dx.doi.org/10.1038/nmeth.2805 1548-7091 Google Scholar
J. Ford,
“Red blood cell morphology,”
Int. J. Lab. Hematol., 35 351
–357
(2013). http://dx.doi.org/10.1111/ijlh.12082 Google Scholar
S. H. Cho et al.,
“Review article: recent advancements in optofluidic flow cytometer,”
Biomicrofluidics, 4
(4), 043001
(2010). http://dx.doi.org/10.1063/1.3511706 1932-1058 Google Scholar
S. Arpali et al.,
“High-throughput screening of large volumes of whole blood using structured illumination and fluorescent on-chip imaging,”
Lab Chip, 12 4968
–4971
(2012). http://dx.doi.org/10.1039/c2lc40894e LCAHAM 1473-0197 Google Scholar
H. V. Pham et al.,
“Real time blood testing using quantitative phase imaging,”
PLoS One, 8 e556761
(2013). http://dx.doi.org/10.1371/journal.pone.0055676 POLNCL 1932-6203 Google Scholar
P. M. S. Roma et al.,
“Total three-dimensional imaging of phase objects using defocusing microscopy: application to red blood cells,”
Appl. Phys. Lett., 104 251107
(2014). http://dx.doi.org/10.1063/1.4884420 APPLAB 0003-6951 Google Scholar
S. Cho et al.,
“Optical imaging techniques for the study of malaria,”
Trends Biotechnol., 30
(2), 71
–79
(2012). http://dx.doi.org/10.1016/j.tibtech.2011.08.004 TRBIDM 0167-7799 Google Scholar
M. K. Kim,
“Principles and techniques of digital holographic microscopy,”
SPIE Rev., 1 018005
(2010). http://dx.doi.org/10.1117/6.0000006 Google Scholar
W. Osten et al.,
“Recent advances in digital holography [Invited],”
Appl. Opt., 53 G44
–G63
(2014). http://dx.doi.org/10.1364/AO.53.000G44 APOPAI 0003-6935 Google Scholar
P. Memmolo et al.,
“Breakthroughs in photonics 2013: holographic imaging,”
IEEE Photonics J., 6
(2), 701106
(2014). http://dx.doi.org/10.1109/JPHOT.2014.2311448 Google Scholar
M. Schürmann et al.,
“Refractive index measurements of single, spherical cells using digital holographic microscopy,”
Methods Cell Biol., 125 143
–159
(2015). http://dx.doi.org/10.1016/bs.mcb.2014.10.016 MCBLAG 0091-679X Google Scholar
F. Merola et al.,
“Diagnostic tools for lab-on-chip applications based on coherent imaging microscopy,”
Proc. IEEE, 103
(2), 192
–204
(2015). http://dx.doi.org/10.1109/JPROC.2014.2375374 IEEPAD 0018-9219 Google Scholar
P. Memmolo et al.,
“3D morphometry of red blood cells by digital holography,”
Cytom. A, 85A 1030
–1036
(2014). http://dx.doi.org/10.1002/cyto.a.22570 Google Scholar
I. Moon, F. Yi and B. Rappaz,
“Automated tracking of temporal displacements of a red blood cell obtained by time-lapse digital holographic microscopy,”
Appl. Opt., 55 A86
–A94
(2016). http://dx.doi.org/10.1364/AO.55.000A86 APOPAI 0003-6935 Google Scholar
F. Yi et al.,
“Automated segmentation of multiple red blood cells with digital holographic microscopy,”
J. Biomed. Opt., 18
(2), 026006
(2013). http://dx.doi.org/10.1117/1.JBO.18.2.026006 JBOPFO 1083-3668 Google Scholar
I. Moon et al.,
“Automated quantitative analysis of 3D morphology and mean corpuscular hemoglobin in human red blood cells stored in different periods,”
Opt. Express, 21 30947
–30957
(2013). http://dx.doi.org/10.1364/OE.21.030947 OPEXFF 1094-4087 Google Scholar
K. Jaferzadeh and I. Moon,
“Quantitative investigation of red blood cell three-dimensional geometric and chemical changes in the storage lesion using digital holographic microscopy,”
J. Biomed. Opt., 20
(11), 111218
(2015). http://dx.doi.org/10.1117/1.JBO.20.11.111218 JBOPFO 1083-3668 Google Scholar
V. Bianco et al.,
“Imaging adherent cell in microfluidic channel hidden by flowing RBCs as occluding objects by holographic method,”
Lab Chip, 14 2499
–2504
(2014). http://dx.doi.org/10.1039/c4lc00290c LCAHAM 1473-0197 Google Scholar
D. Dannhauser et al.,
“Optical signature of erythrocytes by light scattering in microfluidic flows,”
Lab Chip, 15 3278
–3285
(2015). http://dx.doi.org/10.1039/C5LC00525F LCAHAM 1473-0197 Google Scholar
K. R. Lee and Y. K. Park,
“Quantitative phase imaging unit,”
Opt. Lett., 39 3630
–3633
(2014). http://dx.doi.org/10.1364/OL.39.003630 OPLEDP 0146-9592 Google Scholar
N. T. Shaked,
“Quantitative phase microscopy of biological samples using a portable interferometer,”
Opt. Lett., 37 2016
–2018
(2012). http://dx.doi.org/10.1364/OL.37.002016 OPLEDP 0146-9592 Google Scholar
P. Girshovitz and N. T. Shaked,
“Fast phase processing in off-axis holography using multiplexing with complex encoding and live-cell fluctuation map calculation in real-time,”
Opt. Express, 23 8773
–8787
(2015). http://dx.doi.org/10.1364/OE.23.008773 OPEXFF 1094-4087 Google Scholar
P. Marquet, C. Depeursinge and P. J. Magistretti,
“Review of quantitative phase-digital holographic microscopy: promising novel imaging technique to resolve neuronal network activity and identify cellular biomarkers of psychiatric disorders,”
Neurophotonics, 1
(2), 020901
(2014). http://dx.doi.org/10.1117/1.NPh.1.2.020901 Google Scholar
K. E. Bates and H. Lu,
“Optics-Integrated Microfluidic Platforms for Biomolecular Analyses,”
Biophys. J., 110 1684
–1697
(2016). http://dx.doi.org/10.1016/j.bpj.2016.03.018 BIOJAU 0006-3495 Google Scholar
L. Xue et al.,
“Single-shot slightly-off-axis interferometry based Hilbert phase microscopy of red blood cells,”
Biomed. Opt. Express, 2 987
–995
(2011). http://dx.doi.org/10.1364/BOE.2.000987 BOEICL 2156-7085 Google Scholar
S. Wang et al.,
“Phase measurements of erythrocytes affected by metal ions with quantitative interferometric microscopy,”
Opt. Eng., 54 124105
(2015). http://dx.doi.org/10.1117/1.OE.54.12.124105 Google Scholar
F. Merola et al.,
“Digital holography as a method for 3D imaging and estimating biovolume of motile cells,”
Lab Chip, 13 4512
–4516
(2013). http://dx.doi.org/10.1039/c3lc50515d LCAHAM 1473-0197 Google Scholar
T. Kim et al.,
“White-light diffraction tomography of unlabelled live cells,”
Nat. Photonics, 8 256
–263
(2014). http://dx.doi.org/10.1038/nphoton.2013.350 NPAHBY 1749-4885 Google Scholar
G. Popescu et al.,
“Imaging red blood cell dynamics by quantitative phase microscopy,”
Blood Cells Mol. Dis., 41
(1), 10
–16
(2008). http://dx.doi.org/10.1016/j.bcmd.2008.01.010 Google Scholar
Y. K. Park et al.,
“Refractive index maps and membrane dynamics of human red blood cells parasitized by Plasmodium falciparum,”
Proc. Natl. Acad. Sci. U. S. A., 105
(37), 13730
–13735
(2008). http://dx.doi.org/10.1073/pnas.0806100105 Google Scholar
J. Guck et al.,
“Optical deformability as an inherent cell marker for testing malignant transformation and metastatic competence,”
Biophys. J., 88 3689
–3698
(2005). http://dx.doi.org/10.1529/biophysj.104.045476 BIOJAU 0006-3495 Google Scholar
D. Holmes et al.,
“Separation of blood cells with differing deformability using deterministic lateral displacement,”
Interface Focus, 4 20140011
(2014). http://dx.doi.org/10.1098/rsfs.2014.0011 Google Scholar
P. Memmolo et al.,
“Recent advances in holographic 3D particle tracking,”
Adv. Opt. Photonics, 7 713
–755
(2015). http://dx.doi.org/10.1364/AOP.7.000713 AOPAC7 1943-8206 Google Scholar
P. Langehanenberg et al.,
“Automated three-dimensional tracking of living cells by digital holographic microscopy,”
J. Biomed. Opt., 14
(1), 014018
(2009). http://dx.doi.org/10.1117/1.3080133 JBOPFO 1083-3668 Google Scholar
P. Memmolo et al.,
“Identification of bovine sperm head for morphometry analysis in quantitative phase-contrast holographic microscopy,”
Opt. Express, 19
(23), 23215
–23226
(2011). http://dx.doi.org/10.1364/OE.19.023215 OPEXFF 1094-4087 Google Scholar
P. Memmolo et al.,
“Refocusing criterion via sparsity measurements in digital holography,”
Opt. Lett., 39 4719
–4722
(2014). http://dx.doi.org/10.1364/OL.39.004719 OPLEDP 0146-9592 Google Scholar
P. Memmolo et al.,
“Automatic focusing in digital holography and its application to stretched holograms,”
Opt. Lett., 36 1945
–1947
(2011). http://dx.doi.org/10.1364/OL.36.001945 OPLEDP 0146-9592 Google Scholar
BiographyPasquale Memmolo received his PhD in electronic and telecommunication engineering at the University of Napoli “Federico II” in 2012. Currently, he is a research scientist at National Council of Research–Istituto di Scienze Applicate e Sistemi Intelligenti “E.Caianiello” (CNR-ISASI), Pozzuoli, Italy. He has published over 100 scientific contributions among reviewed journal publications, proceedings, and conference papers. His current scientific interests are digital holography, digital image processing, computer vision, 3-D tracking, microscopy, microfluidics, and optofluidics. Francesco Merola received his MS degree in physics cum laude from the “Federico II” University of Napoli, Italy, in 2006 and his PhD in fundamental and applied physics at the same university in 2009. In 2007, he joined the CNR-ISASI, Napoli, where he is a researcher. He has published more than 70 papers and proceedings on international journals. His research interests include optical tweezers, digital holographic microscopy, and biomicrofluidics. Lisa Miccio received her PhD from the University of Florence for the investigation on ferroelectric crystals to realize integrated optical microdevices in 2010. Currently, she is a researcher at the Italian CNR. Her scientific interests are in optics and photonics, in the field of coherent-light imaging, and integration of label-free methods in microfluidic lab-chip devices for biophotonics application. She is the author of 50 original articles, 5 book chapters, and about 40 oral presentations at international conferences. Martina Mugnano is a graduate in biotechnologies for health with a thesis on 3-D skin model production in vitro and completed the second cycle degree in medical biotechnology. Currently, she is completing her PhD at the University of Naples “Federico II,” studying manipulation of cells through light interaction and smart material, under the supervision of Dr. Pietro Ferraro. She is a coauthor of about 10 scientific publications in international journals and conference proceedings. Pietro Ferraro is currently the director at CNR-ISASI, Pozzuoli, Italy. He has published 12 book chapters, and more than 250 papers in peer-review journals. He edited two books with Springer. He holds 14 patents. Among his current scientific interests are holography, interferometry, microscopy, fabrication of nanostructures, ferroelectric crystals, optical fiber sensors, fiber Bragg gratings, nanomicrofluidics, optofluidics. He is a fellow of SPIE and OSA. |


