
|
|
1.IntroductionFluorescent proteins (FPs)-based Förster resonance energy transfer (FRET) microscopy has become an important tool for the analysis of protein–protein interactions within living cells in real time.1–6 FRET quantification, measurement of absolute FRET efficiency () and acceptor-to-donor concentration ratio (), allows quantitative analysis of the degree of molecular interaction and is necessary for the scientific communication of FRET index obtained by different research groups.7,8 Fluorescence lifetime imaging microscopy (FLIM), acceptor photobleaching (PbFRET), and acceptor-sensitized emission (SE-FRET) methods are commonly used for FRET quantification.6,7,9–13 With improvements in spectral imaging, spectral unmixing has been widely used to quantitatively resolve and , named as the spFRET method, in living cells.6,9,14,15 The axiom of spFRET is that the net fluorescence spectrum of an FRET sample is linear superposition of the spectra of each fluorophore contained in the FRET sample.16,17 Generally, the spFRET method uses uncorrected spectral fingerprints of donor and acceptor to divide the fluorescence spectrum of an FRET sample into the contributions from donor and acceptor. Therefore, the spFRET method requires at least three reference samples separately expressing donor-only, acceptor-only, and donor–acceptor tandem construct to calibrate the measurement system, and the spectra of FRET samples are generally performed under the same imaging conditions with reference samples, including the same illumination intensity and instrumental setting.6,9,17 This rigorous restriction makes it very difficult to perform a complete FRET quantification within single live cells. In order to circumvent the preparations of three reference samples separately expressing donor-only and acceptor-only as well as donor–acceptor tandem construct for every FRET measurement, Levy et al.14 proposed a novel spFRET method that utilizes the corrected spectral fingerprints of donor and acceptor to linearly resolve two corrected emission spectra of a FRET sample with two different excitations. The corrected spectral fingerprints of donor and acceptor are independent of the measurement system; thus, it is unnecessary to measure them for subsequent quantitative FRET measurement when they are predetermined by using this method to perform quantitative FRET measurement on a stable measurement system, such as wide-field fluorescence microscopy that is very stable over at least 3 months.11,18 Recently, we developed an independent emission-spectral unmixing-based spFRET method, named Iem-spFRET, to directly measure the and values of a FRET sample without any external references.12 Iem-spFRET circumvents the rigorous restriction of keeping constant measurement conditions for all FRET measurements; thus, it can be performed under the optimal imaging conditions by adjusting the illumination intensity and instrumental settings for cells expressing different FPs levels. Iem-spFRET requires to predetermine the molar extinction coefficient ratio () of acceptor-to-donor for the correction of acceptor excitation crosstalk.12 In reality, we used a standard tandem construct with known FRET efficiency previously measured by using the PbFRET method to predetermine values.12,19 Accurate measurement of the value is crucial for the measurement of and subsequent FRET quantification. However, inapplicability of the PbFRET and FLIM methods for GFP-YFP pair and instability of PbFRET limit the live-cell application of the Iem-spFRET method. In this report, we developed an improved Iem-spFRET method (termed as IIem-spFRET) for robust FRET measurement in living cells. First, we introduce two background (BG) spectral fingerprints measured from blank cells without FPs with two different excitations into IIem-spFRET, which improves the anti-interference ability of FRET measurement. Second, we introduce a factor denoting the relationship between two molar extinction coefficients ratios of acceptor to donor at two different excitations into IIem-spFRET, which circumvents predetermining the value of a tandem construct for the measurement of values. We performed IIem-spFRET and Iem-spFRET methods on our microscope–spectrometer (MSM) platform18 to measure the and values of tandem constructs with different acceptor–donor stoichiometries in single living Huh7 cells, and our experimental results firmly demonstrated that IIem-spFRET method has better robustness than the Iem-spFRET method especially for the cells with low expression levels of FPs. 2.Theory2.1.Spectral Unmixing of FRET SamplesFor an FRET sample containing free donors at concentration and free acceptors at concentration as well as the paired donor at concentration and acceptor at , the emission spectra should be a linear combination of six contributions from the free donor, paired donor, free acceptor, and paired acceptor, including direct excitation and sensitized emission, as well as BG. Similar to the Iem-spFRET method we recently developed,12 we can sort these fluorescence components according to these emission characteristics of donor and acceptor as well as BG, respectively where is the FRET efficiency of the paired donor–acceptor, is the excitation intensity at wavelength (); and are the extinction coefficients of donor and acceptor at wavelength , and is the molar extinction coefficient ratio of acceptor to donor at wavelength ;12 and are quantum yields of donor and acceptor; and normalized to unit area are the spectral fingerprints of donor and acceptor; is the spectra of both BG and autofluorescence with excitation, and is normalized to the unit area as the spectral fingerprints of BG []. Equation (1) becomes where , , and are the weight factors of donor, acceptor, and BG, respectively. We define the weight ratio () of donor to acceptor at excitation2.2.FactorThe measured emission fluorescence intensity spectra () and () for the cells exclusively expressing donors or acceptors, which is essential for predeterming the spectral fingerprints of donor and acceptor, are where the superscript () refers to the excitation wavelength and the subscripts and denote donor and acceptor, respectively; is the excitation intensity, and are the concentrations of donor-only and acceptor-only samples, respectively. The functions are the collection efficiencies of the instrument used and may be different for different excitation wavelengths due to differences in filters.The emission spectra of fluorophores in fluid solvents were independent of the excitation wavelength.20 We can define a factor to denote the relationship between two molar extinction coefficient ratios of acceptor to donor at two excitations ( and ) Here, and are the excitation absorption coefficients, which can be obtained by recording the emission intensities of donor-only or acceptor-only sample at two excitations (, ) as follows:3.Materials and Methods3.1.Reagents and PlasmidsCerulean and Venus-kras plasmid constructs were purchased from Addgene Company (Cambridge, Massachusetts). The FRET-standard constructs, including C32V (Cerulean-32-Venus, Addgene plasmid 29396), CVC (Cerulean-5-Venus-5-Cerulean, Addgene plasmid 27788), VCV (Venus-5-Cerulean-5-Venus, Addgene plasmid 27788), and VCVV (Venus-5-Cerulean-5-Venus-6-Venus, Addgene plasmid 27789), were kindly provided by the Vogel Lab (National Institutes of Health, Bethesda, Maryland). Plasmid DNA of CFP-Bax and YFP-Bax was kindly provided by Dr. Prehn.4 Plasmid DNA of 18AA was kindly supplied by Professor Kaminski.7 Staurosporine (STS) was purchased from Sigma-Aldrich Co. LLC (Santa Clara). 3.2.Cell Culture and TransfectionHuh7 and HepG2 cells line were obtained from the Department of Medicine, Jinan University (Guangzhou, China). Cells were cultured in Dulbecco’s modified Eagle’s medium (DMEM, Gibco, Grand Island) containing 10% fetal calf serum (FCS; Sijiqing, Hangzhou, China) at 37°C in a humidified atmosphere containing 5% . For transfection, Huh7 or HepG2 cells were cultured in DMEM containing 10% FCS in 35-mm glass dish with a density . After 24 h, all plasmids were transfected into cells for 24 to 48 h when the cells reached 70% to 90%. TurbofectTM (Fermentas Inc., Glen Burnie, Maryland) was used as a transfection reagent. 3.3.Microscope–Spectrometer PlatformFRET measurements were implemented on a user-built MSM platform that consists of a widefield fluorescence microscope (Axio Observer, Carl Zeiss, Oberkochen, Germany) with a oil objective and a miniature fiber optic spectrometer (QE65 Pro, Ocean Optics, Florida).18 The MSM platform, equipped with a metal halide lamp (X-Cite 120, Carl Zeiss, Oberkochen, Germany) and AxioVision Rel. 4.8 (Carl Zeiss, Oberkochen, Germany) software for CCD operation as well as SpecSuite (Ocean Optics, Florida) software for spectra detection, has two detection channels: a microscopic imaging channel with a CCD camera (AxioCam MRm, Carl Zeiss, Oberkochen, Germany) for guiding cells and a spectral detection channel with a QE65 Pro spectrometer for collecting spectra from the guided cells. The spectra channel was accorded to the middle of CCD imaging channel. The detection area () of the spectrometer is that accords to a of the sample area in this report. The illumination intensity can be attenuated in five discrete steps (, 12.5%, 25%, 50%, and 100%), and another neutral density filters controller with six discrete steps (, 20%, 40%, 60%, 80%, and 100%) can be used for the same purpose. In our study, the excitation optical filters were BP405/20 (Ex405 nm) (BP Exciter, Chroma) and BP 436/20 (Ex436 nm) (BP 436/20, Carl Zeiss, Oberkochen, Germany). 455-nm dichroic mirror (455DCLP Dichroic, Chroma) and emission long pass filter of LP455 (455DCLP Dichroic, Chroma) were used as emission control. The spectral detection range is 460 to 620 nm. Each count() or at the emission wavelength is related to the photos from about a 0.761-nm wavelength range. In addition, excitation bandpass filter of BP 500/25 (Ex500 nm), primary dichroic mirror FT 515, and emission bandpass filter of BP 535/30 (Carl Zeiss, Oberkochen, Germany) were used for the acceptor photobleaching. 4.Results and Discussions4.1.Factor and Spectral FingerprintsThe lifetime of the metal halide lamp we used for excitation is much longer than 2000 h, and thus our excitation is very stable. Furthermore, spectral responsivity of our MSM platform was carefully calibrated by using a standard lamp (LS-1-CAL, Ocean Optics, Florida), just as described previously.18 Our MSM platform has the same calibration curve [] of spectral sensitivity at an interval of 1 month (Appendix A1), further demonstrating the stability of the MSM platform. BG spectra were measured from 18 blank living Huh7 cells without expressing FPs with 405 and 436 nm excitations, respectively [Figs. 1(a) and 1(b)]. Figure 1(c) shows the images of cells separately expressing Cerulean and Venus with 405 nm () and 436 nm () excitations, respectively. Figures 1(d) and 1(e) show the spectra of the cell indicated by the red circles in Fig. 1(c) and the average BG spectra in Figs. 1(a) and 1(b). According to Eqs. (7) and (8), the excitation absorption coefficients are calculated from 460 to 560 nm wavelength range [Fig. 1(d)] and calculated from 520 to 550 nm wavelength range [Fig. 1(e)]. Statistical results from 14 cells expressing Cerulean and 13 cells expressing Venus were and , respectively. Thus, by Eq. (6). The normalized spectra of Cerulean and Venus from above cells with 436 nm excitation and the normalized BG spectra calculated from 18 blank living Huh7 cells were used as the spectral fingerprints of Cerulean () and Venus () as well as BGs ( and ), respectively [Fig. 1(f)]. Fig. 1Spectral fingerprints of Cerulean [] and Venus [] as well as BG [ (), or 2] inside living Huh7 cells. (a) and (b) Spectra of 18 blank cells without FPs at 405 nm (a) () or 436 nm (b) () excitation under the same measurement conditions. (c) Images of cells separately expressing Cerulean and Venus with 405 or 436 nm excitation. Scale bar: . (d) and (e) Emission spectra of Cerulean (d) and Venus (e) inside the living cell indicated by the red circles in (c) and the average of spectra of 18 cells in (a) and (b), as well as the corresponding and . (f) Normalized spectral fingerprints of donor () and acceptor () as well as BG ( and ) at two excitations.  Although careful calibration of the measurement platform is necessary for IIem-spFRET and Iem-spFRET methods, this step is not required for every FRET measurement due to the stability of our platform for at least 3 months. In addition, because of the independence of on the illumination intensity and emission-spectral transmission as well as FP concentration,6,12,20 predetermining the factor can be a one-off event for given FPs for at least 3 months on our platform. However, most imaging systems do not have this stability, and so investigators had better not skip the calibration step.18 In addition, as the two excitations used here share the same emission channel (, the calibration of our system is very simple and can be completed in a few seconds.18 We found that the normalized spectra of Cerulean () and Venus () in living cells with 436 nm excitation were consistent with those with 405 nm excitation.18 In fact, much of the literature assume that the spectra of FPs in living cells are independent of excitation wavelength.6,14,15,18,20–23 Therefore, Eq. (6) should be applicable to the FPs in living cells. As the extinction coefficient of Venus at 405 nm is very low and 436 nm excitation can effectively excite both Cerulean and Venus,24 so the measured normalized spectra of Cerulean and Venus with 436 nm excitation were used as their spectral fingerprints. Once , , and are predetermined, we need not measure them for subsequent quantitative FRET measurement. In addition, acquisition range of the spectral fingerprints must overlap well with the emission spectra of donor and acceptor to insure the accurate measurement of Iem-spFRET.14 In this study, the spectral ranges covering and of Cerulean and Venus [Fig. 1(f)] emission spectra fulfill this requirement. Although we introduce factor into IIem-spFRET, there is no need to add any external references for determining the factor. In addition, factor and spectral fingerprints can be determined at the same time [Figs. 1(d) and 1(e)]. We here predetermine the factor by measuring the excitation absorption coefficients ( and ), which can be obtained from the fluorescence intensities of cells exclusively expressing donor and acceptor with two excitations [Eqs. (7) and (8)]. The excitation intensity ratio () between two excitations must be constant for donor-only and acceptor-only reference, respectively. In fact, the is constant for a stable excitation light source; we thus only need to measure both and under the same instrumental conditions for determining the factor. In addition, and are constant for a given donor–acceptor pair and optical system and are also independent of the emission wavelength [Eqs. (7) and (8)]. In order to improve the accuracy of measurement, we chose the spectra of Cerulean in 460 to 560 nm wavelength range to calculate [Fig. 1(d)] and the spectra of Venus in 520 to 550 nm wavelength range to calculate [Fig. 1(e)] for the determination of factor (1.3520). Meanwhile, we also used the spectra of both Cerulean and Venus in the same wavelength range of 520 to 550 nm [Figs. 1(d) and 1(e)] to calculate the and , and obtained consistent factor (1.3477). 4.2.Extinction Coefficient Ratios of Venus to Cerulean in Living Huh7 CellsTo predetermine the extinction coefficient ratio () of Venus (V) to Cerulean (C) in living Huh7 cells on our platform, which is necessary for IIem-spFRET measurement, we transfected Huh7 cells with C32V, and the representative cell images with 405 () or 436 nm () excitation are shown in Fig. 2(a). The corresponding spectra and unmixing components by using Eq. (2) are shown in Figs. 2(b) and 2(c), and and . Substituting these parameters and the predetermined into Eq. (11), we calculate and , where , ,25,26 and . The statistical and values from 14 live Huh7 cells by IIem-spFRET were and [Table 1 and Fig. 2(d)]. Meanwhile, we also used the PbFRET method7,27 to measure the FRET efficiency () of C32V and then determined the values by using the Iem-spFRET method [Fig. 2(d) and Appendix A]. Fig. 2values of Venus to Cerulean in living Huh7 cells. (a) Fluorescence images of representative cells expressing C32V at 405 or 436 nm excitation. Scale bar: . (b) and (c) Spectral unmixing of the corresponding spectra by IIem-spFRET with 405 (b) or 436 nm (c) excitation in (a), where , , , , , and . (d) Statistical and values from at 14 living cells by using Iem-spFRET and IIem-spFRET methods, respectively.  Table 1γ values calculated by Iem-spFRET or IIem-spFRET method.
Note: Significantly larger than the average value. The real values of and (quantum yield) are the biggest unknown in our calculation due to the dependence of and on the cell environment. However, the fact that the values of FRET constructs in living cells obtained by a -dependent method are consistent with those obtained by a -independent method demonstrates that the cell environment does not seriously affect the value (or the ratio) of FPs.6,12,14,15,18,23 Based on our previous studies,12,18,23 we also used the values from a reference for our calculation.25,26 factor not only bridges the two molar extinction coefficient ratios ( and ) but also can be used to determine the values by using a tandem construct with unknown FRET efficiency [Eq. (11)], which is an incremental improvement for the IIem-spFRET method. Predetermination of values can be considered as a one-off event for given FPs and instruments.12 For the determination of values by using a standard FRET construct, the most merit of the IIem-spFRET method is that we need not measure the FRET efficiency of this construct. Although both the Iem-spFRET and IIem-spFRET methods obtained consistent values, the IIem-spFRET method showed more stable results [Fig. 2(d) and Table 1], demonstrating the robustness of the IIem-spFRET method. In contrast to the Iem-spFRET method, IIem-spFRET circumvents premeasuring the value of the tandem construct, which not only simplifies the measurement process of values but also makes IIem-spFRET very applicable to the quantitative measurement of GFP-YFP pair. Accurate measurement of the values of the reference construct is crucial for the determination of by using the Iem-spFRET method (Table 1). In fact, cellular motility of living cells and the degree of acceptor photobleaching may affect the PbFRET measurement,28 thus resulting in the unstable values measured by the Iem-spFRET method. 4.3.Implementation of Iem-spFRET and IIem-spFRET for Cells Separately Expressing C32V, CVC, VCV, and VCVVWe next performed the Iem-spFRET and IIem-spFRET methods on our platform to measure the and values of C32V, CVC, VCV, and VCVV inside living Huh7 cells. Figure 3(a) shows images of representative cells separately expressing C32V, CVC, VCV, and VCVV with 405 and 436 nm excitations. The corresponding normalized spectra are shown in Figs. 3(b)–3(e), and the unmixing weights by using IIem-spFRET are listed in Table 2. Substitute these unmixing weights into Eqs. (9) and (10) to obtain the corresponding and values: 29.97% and 0.973 for C32V, 47.66% and 0.521 for CVC, 66.33% and 2.296 for VCV, and 74.86%, and 3.154 for VCVV, respectively (Table 2). The unmixing weights by using Iem-spFRET for the same cells are also listed in Table 2, and the corresponding and values were 28.36% and 0.994 for C32V, 46.70% and 0.539 for CVC, 60.87% and 2.952 for VCV, and 39.93% and 9.710 for VCVV, respectively. Fig. 3Implementation of both Iem-spFRET and IIem-spFRET methods on MSM platform for FRET quantification with representative cells separately expressing C32V, CVC, VCV, and VCVV in living Huh7 cells. (a) Fluorescence images of cells with 405 (upper panels) or 436 nm (lower panels) excitations. Scale bar: . (b) and (e) Spectra normalized to unit area of C32V (b), CVC (c), VCV (d), and VCVV (e) constructs inside the cell indicated by red circles in (a) with 405 and 436 nm excitation, respectively. (f) Statistical values of C32V, CVC, VCV, and VCVV tandem constructs in living Huh7 cells obtained by Iem-spFRET and IIem-spFRET methods, respectively. (g) Statistical values obtained by Iem-spFRET and IIem-spFRET methods from Huh7 cells exclusively expressing C32V, CVC, VCV, and VCVV tandem constructs. 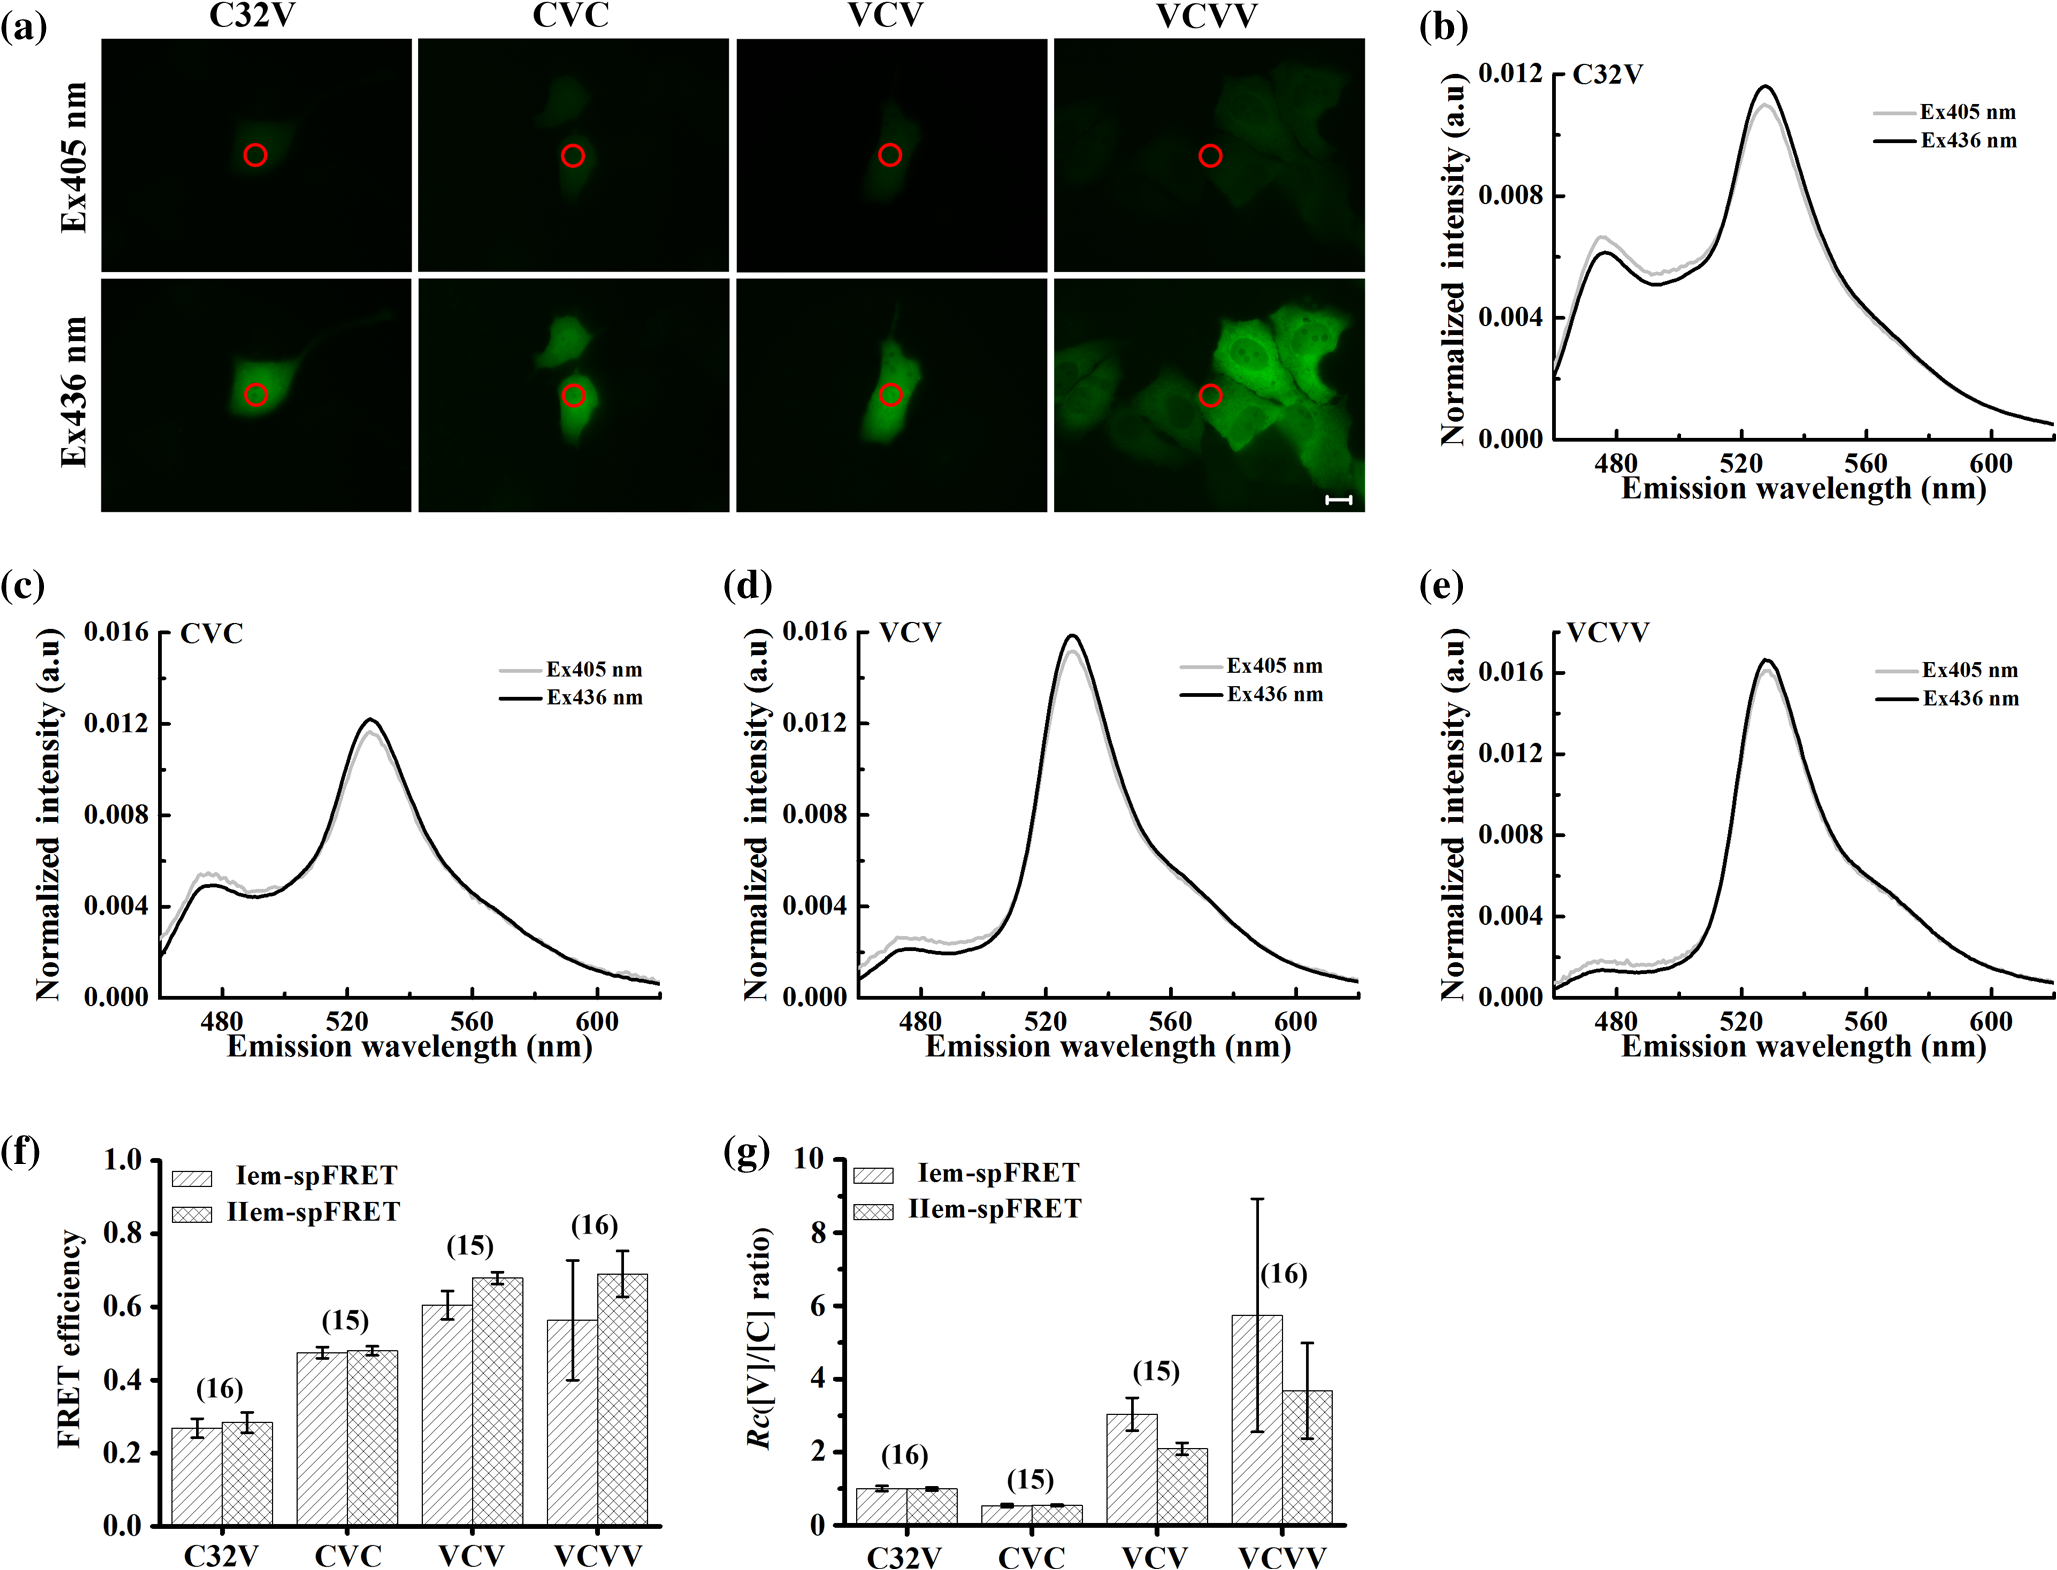 Table 2E and Rt values as well as unmixing parameters by Iem-spFRET or IIem-spFRET methods.
Statistical and values measured by IIem-spFRET were and for C32V (), and for CVC (), and for VCV (), and for VCVV (), respectively [Figs. 3(f) and 3(g)]. We also used the Iem-spFRET method to measure the and values of C32V, CVC, VCV, and VCVV constructs for the same cells, and the calculated and values were and for C32V, and for CVC, and for VCV, and for VCVV, respectively [Figs. 3(b) and 3(c)]. Here, the values measured by the two methods were basically consistent with measured by lux-FRET for C32V,18 for CVC measured by Vogel’s laboratory with FLIM method.9 Statistical values of VCV by the IIem-spFRET method are consistent with measured by Vogel’s laboratory with FLIM method.9 The values calculated by the two methods are in agreement with the corresponding theoretical values of 1 for C32V, 0.5 for CVC. The statistical value of VCV by the IIem-spFRET method is also consistent with the theoretical value of 2. However, for VCV and VCVV constructs, the and values measured by the Iem-spFRET method had large deviations and fluctuations, but the IIem-spFRET method showed greatly improved measured results [Figs. 3(f) and 3(g)]. For the cells expressing low levels of VCV or VCVV with higher FRET efficiency, the measured and values by using the Iem-spFRET method showed large deviations and fluctuations, whereas the results measured by using IIem-spFRET exhibited significant improvements [Figs. 3(f) and 3(g)]. Although the autofluorescence intensity of cells was very low, different autofluorescence intensity of each cell might affect the FRET measurement. When the expression levels of VCV and VCVV are very low, direct subtraction of the BG signal from the measured spectra of cells expressing VCV or VCVV seriously affected the spectra in the 460 to 500 nm wavelength range, especially with 405-nm excitation [Figs. 3(d) and 3(e)]. Generally, the spectra of BG and autofluorescence should be stable; thus, they can be introduced as the BG spectral fingerprints to resolve the measured spectrum of FRET sample for removing the BG and autofluorescence. Iem-spFRET simply subtracted the averaged BG signal (including BG and autofluorescence) obtained from many cells from the measured fluorescence signal for each cell expressing FPs, whereas IIem-spFRET used the BG spectral fingerprint as a component to linearly unmix the measured spectrum for eliminating the influences of autofluorescence of each cell. Therefore, IIem-spFRET improves the anti-interference ability and robustness of FRET measurements in living cells [Figs. 3(f) and 3(g)]. 4.4.Good Robustness of IIem-spFRET MethodWe next evaluated the effect of fluorescence intensity (or expression level of FPs) on Iem-spFRET and IIem-spFRET methods. Figure 4 shows the spectra of the C32V and VCV cells in Fig. 3(a) as well as the BG spectra with 405 and 436 excitations. Compared with the spectra of C32V cells [Fig. 4(a)], the 476-nm peak of VCV cells is very low, especially for the excitation of 405 nm [Fig. 4(b)], due to the high FRET efficiency of VCV. We chose 470 to 490 nm emission data as , and the relative intensities of the C32V cell in Fig. 4(a) with 405 and 436 excitations at CH0 were , , respectively, and the corresponding and values measured by using Iem-spFRET and Iem-spFRET were consistent (Table 3, cell 5). The relative intensities of the VCV cell in Fig. 4(b) with 405 and 436 excitations at CH0 were and , respectively, and Iem-spFRET and IIem-spFRET obtained different and values (Table 3, cell 6). Just as listed in Table 3, both the Iem-spFRET and IIem-spFRET methods can obtain consistent results for C32V cells with different fluorescence intensity. However, for VCV cells with different fluorescence intensity, only IIem-spFRET obtained consistent results, indicating the good robustness of the IIem-spFRET method to fluorescence intensity. Fig. 4Spectra of C32V (a) and VCV (b) constructs inside the cells indicated by red circles in Fig. 3(a) as well as BG spectra with 405 and 436 nm excitation, respectively.  Table 3E and Rt values of C32V and VCV constructs measured by Iem-spFRET or IIem-spFRET method.
Note: Significant deviation. The measured fluorescence intensity is proportional to the excitation intensity and the expression levels of FPs. To reduce photobleaching, the excitation intensity was controlled with in our system (Appendix A3). Therefore, the fluorescence intensity in this report mainly depends on the expression levels of FPs. In addition, we can choose 430 and 450 nm wavelengths as two excitations to enhance the emission intensity of Cerulean and Venus, which may further improve the robustness of the IIem-spFRET method. 4.5.Analysis on STS-Induced Bax Oligomerization in Living CellsBax is a proapoptotic protein required for the process of mitochondrial outer membrane permeabilization.4 We here used the IIem-spFRET method to analyze the stauroporine (STS)-induced Bax oligomerization in living HepG2 cells just as described previously.12 Figure 5 shows the fluorescence image of representative cells coexpressing CFP-Bax and YFP-Bax (left) and the corresponding fluorescence spectra with 405 nm (middle) or 436 nm (right) excitation. We found that Bax distributed evenly in cytoplasm in healthy cells [Fig. 5(a)] but translocated to mitochondria [Fig. 5(d)]. IIem-spFRET analysis showed that the corresponding value was 0.25% for control cells and 35.23% for STS-treated cells. The statistical value was for healthy cells () and for STS-treated cells (), indicating that STS induced Bax translocation to mitochondria and subsequent oligomerization. Fig. 5IIem-spFRET analysis on Bax oligomerization in single live HepG2 cells. (a) Fluorescence images of a cell coexpressing CFP-Bax and YFP-Bax. Scale bar, 10 μm. (b) and (c) Spectral unmixing of the corresponding spectra with 405 (b) or 436 nm (c) excitation for the cell in (a) by IIem-spFRET. (d) Fluorescence images of a cell coexpressing CFP-Bax and YFP-Bax after STS treatment for 4 h. Scale bar, . (e) and (f) Spectral unmixing of the corresponding spectra with 405 (e) or 436 nm (f) excitation for the cell in (d) by IIem-spFRET.  5.ConclusionWe here introduce the spectra of blank cells at two excitations as BG spectral fingerprints to resolve the BG and autofluorescence from the measured spectra of cells expressing FPs, which significantly enhances the robustness of the Iem-spFRET method. In addition, we also introduce a factor that can be simutaneously obtained with the predetermination of the spectral fingerprints of donor and acceptor for predeterming the extinction coefficient ratios () of acceptor to donor at excitations, which not only circumvents premeasuring the value of a tandem reference construct but also makes the measurement of values more simple and stable. The IIem-spFRET method significantly enhances the success rate of quantitative FRET measurement in living cells and will expand the application fields of FRET microscopy especially in cell biology. AppendicesAppendix:Miscellaneous Formatting DetailsA1.Calibration of Our MSM PlatformMSM platform was carefully calibrated by using a standard lamp.18 Figure 6 shows the corresponding spectral sensitivity calibration curve: , where is the reference spectrum of halogen lamp directly measured by the calibrated QE65 Pro spectrometer and is the spectrum of halogen lamp obtained by our MSM platform. The same curves were obtained at interval of 1 month [Fig. 2(b)], demonstrating the stability of the MSM platform. A2.Implementation of Iem-spFRET for the Measurement of Values of Venus to CeruleanFigure 7(a) shows the images of the cells in Fig. 2(a) with 436 or 500 nm excitations before and after partial acceptor photobleaching by using the maximum 500 nm excitation. The corresponding spectra from the cell area indicated by a red circle are shown in Fig. 7(b), and obtained by using the Eq. (4.14) in the literature.7 By unmixing the corrected spectra of C32V from the cell area indicated by red circle in Fig. 7(b) using Iem-spFRET method, we obtained and [Figs. 7(c) and 7(d)], and the corresponding and . Statistical and values from the same 14 live Huh7 cells were and [Table 1 and Fig. 2(d)]. Table 1 shows parameters from 14 live Huh7 cells by using IIem-spFRET and Iem-spFRET methods, respectively. Fig. 7values of Venus to Cerulean in living Huh7 cells measured by Iem-spFRET method. (a) Fluorescence images of cell in Fig. 2 at 436 or 500 nm excitation before and after partial acceptor photobleaching. Scale bar: . (b) Correction spectra from the cell area indicated by a red circle in (a) and the chose emission data of donor channel (CH1: 470 to 490 nm) and acceptor channel (CH2: 525 to 535 nm). Here, , , , , and the corresponding value calculated by using PbFRET method was 27.67%. (c) and (d) Spectral unmixing of the corresponding spectra of the cells in Fig. 2(a) with 405 (c) or 436 nm (d) excitation by Iem-spFRET, where , , , and . 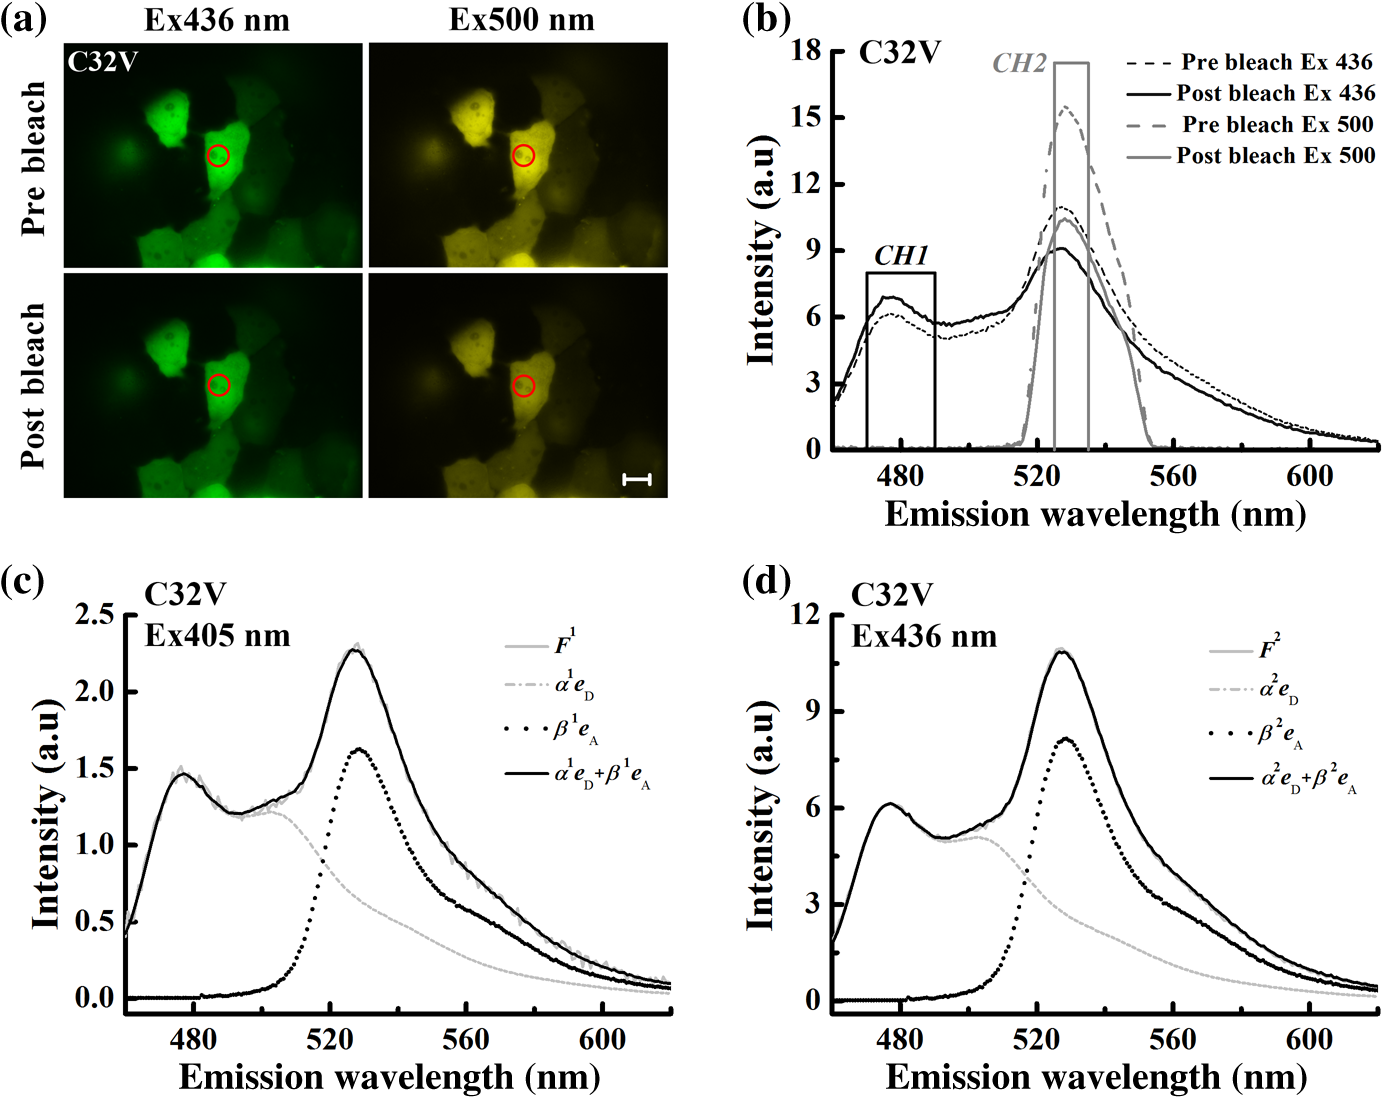 A3.Photobleaching Effect of ExcitationWe found that among C32V, CVC, VCV, and VCVV the acceptor of VCVV was easily photobleached. We thus used cells expressing VCVV construct to evaluate the photobleaching effects of excitations on constructs (Fig. 8). We used 405 or 436 nm excitation to continuously excite cells expressing VCVV construct for 20 s and found that excitation with 2.5% of transmission () resulted in a significant acceptor photobleaching [Figs. 8(a) and 8(c)], while excitation with did not induce significant photobleaching [Figs. 8(b) and 8(d)]. Thus, of illumination intensity was chosen for following experiments without indicated value. AcknowledgmentsThe authors would like to thank Prof. S. S. Vogel (NIH/NIAAA) for providing C32V, CVC, VCV, and VCVV plasmids. This work was supported by the National Natural Science Foundation of China (NSFC) (Grant Nos. 61527825 and 81471699) and the Science and Technology Plan Project of Guangdong Province (No. 2014B090901060). ReferencesG. W. Gordon et al.,
“Quantitative fluorescence resonance energy transfer measurements using fluorescence microscopy,”
Biophys. J., 74
(5), 2702
–2713
(1998). http://dx.doi.org/10.1016/S0006-3495(98)77976-7 BIOJAU 0006-3495 Google Scholar
E. Galperin, V. V. Verkhusha and A. Sorkin,
“Three-chromophore FRET microscopy to analyze multiprotein interactions in living cells,”
Nat. Methods, 1
(3), 209
–217
(2004). http://dx.doi.org/10.1038/nmeth720 1548-7091 Google Scholar
R. N. Day, C. F. Booker and A. Periasamy,
“Characterization of an improved donor fluorescent protein for Förster resonance energy transfer microscopy,”
J. Biomed. Opt., 13
(3), 031203
(2008). http://dx.doi.org/10.1117/1.2939094 JBOPFO 1083-3668 Google Scholar
H. Düssmann et al.,
“Single-cell quantification of Bax activation and mathematical modelling suggest pore formation on minimal mitochondrial Bax accumulation,”
Cell Death Differ., 17
(2), 278
–290
(2010). http://dx.doi.org/10.1038/cdd.2009.123 Google Scholar
M. Mohsin et al.,
“Genetically encoded FRET-based nanosensor for in vivo measurement of leucine,”
Biosens. Bioelectron., 50 72
–77
(2013). http://dx.doi.org/10.1016/j.bios.2013.06.028 BBIOE4 0956-5663 Google Scholar
J. Wlodarczyk et al.,
“Analysis of FRET signals in the presence of free donors and acceptors,”
Biophys. J., 94
(3), 986
–1000
(2008). http://dx.doi.org/10.1529/biophysj.107.111773 BIOJAU 0006-3495 Google Scholar
A. D. Elder et al.,
“A quantitative protocol for dynamic measurements of protein interactions by Förster resonance energy transfer-sensitized fluorescence emission,”
J. R. Soc. Interface, 6
(S1), S59
–S81
(2009). http://dx.doi.org/10.1098/rsif.2008.0381.focus 1742-5689 Google Scholar
A. Zeug et al.,
“Quantitative intensity-based FRET approaches—a comparative snapshot,”
Biophys. J., 103
(9), 1821
–1827
(2012). http://dx.doi.org/10.1016/j.bpj.2012.09.031 BIOJAU 0006-3495 Google Scholar
C. Thaler et al.,
“Quantitative multiphoton spectral imaging and its use for measuring resonance energy transfer,”
Biophys. J., 89
(4), 2736
–2749
(2005). http://dx.doi.org/10.1529/biophysj.105.061853 BIOJAU 0006-3495 Google Scholar
H. Wallrabe and A. Periasamy,
“Imaging protein molecules using FRET and FLIM microscopy,”
Curr. Opin. Biotechnol., 16
(1), 19
–27
(2005). http://dx.doi.org/10.1016/j.copbio.2004.12.002 CUOBE3 0958-1669 Google Scholar
T. Zal and N. R. Gascoigne,
“Photobleaching-corrected FRET efficiency imaging of live cells,”
Biophys. J., 86
(6), 3923
–3939
(2004). http://dx.doi.org/10.1529/biophysj.103.022087 BIOJAU 0006-3495 Google Scholar
J. Zhang et al.,
“Quantitative FRET measurement using emission-spectral unmixing with independent excitation crosstalk correction,”
J. Microsc., 257
(2), 104
–116
(2015). http://dx.doi.org/10.1111/jmi.2015.257.issue-2 JMICAR 0022-2720 Google Scholar
L. Zhang et al.,
“Binomial distribution-based quantitative measurement of multiple-acceptors fluorescence resonance energy transfer by partially photobleaching acceptor,”
Appl. Phys. Lett., 104
(24), 243706
(2014). http://dx.doi.org/10.1063/1.4885084 APPLAB 0003-6951 Google Scholar
S. Levy et al.,
“SpRET: highly sensitive and reliable spectral measurement of absolute FRET efficiency,”
Microsc. Microanal., 17
(2), 176
–190
(2011). http://dx.doi.org/10.1017/S1431927610094493 MIMIF7 1431-9276 Google Scholar
S. Mustafa et al.,
“Quantitative Förster resonance energy transfer efficiency measurements using simultaneous spectral unmixing of excitation and emission spectra,”
J. Biomed. Opt., 18
(2), 026024
(2013). http://dx.doi.org/10.1117/1.JBO.18.2.026024 JBOPFO 1083-3668 Google Scholar
T. Zimmermann,
“Spectral imaging and linear unmixing in light microscopy,”
Adv. Biochem. Eng. Biotechnol., 95 245
–265
(2005). Google Scholar
A. D. Hoppe et al.,
“N-way FRET microscopy of multiple protein-protein interactions in live cells,”
PLOS One, 8
(6), e64760
(2013). http://dx.doi.org/10.1371/journal.pone.0064760 POLNCL 1932-6203 Google Scholar
L. Chai et al.,
“Miniature fiber optic spectrometer-based quantitative fluorescence resonance energy transfer measurement in single living cells,”
J. Biomed. Opt., 20
(3), 037008
(2015). http://dx.doi.org/10.1117/1.JBO.20.3.037008 JBOPFO 1083-3668 Google Scholar
J. Zhang et al.,
“Spectral measurement of acceptor-to-donor extinction coefficient ratio in living cells,”
Micron, 68 98
–106
(2015). http://dx.doi.org/10.1016/j.micron.2014.09.007 MICNB2 0047-7206 Google Scholar
J. R. Lakowicz, Principles of Fluorescence Spectroscopy, 3rd ed.Springer, Singapore
(2006). Google Scholar
R. Y. Tsien,
“The green fluorescent protein,”
Annu. Rev. Biochem., 67 509
–544
(1998). http://dx.doi.org/10.1146/annurev.biochem.67.1.509 ARBOAW 0066-4154 Google Scholar
M. A. Rizzo et al.,
“Optimization of pairings and detection conditions for measurement of FRET between cyan and yellow fluorescent proteins [J],”
Microsc. Microanal., 12
(03), 238
–254
(2006). http://dx.doi.org/10.1017/S1431927606060235 MIMIF7 1431-9276 Google Scholar
M. Y. Du et al.,
“Wide-field microscopic FRET imaging using simultaneous spectral unmixing of excitation and emission spectra,”
Opt. Express, 24
(14), 16037
–16051
(2016). http://dx.doi.org/10.1364/OE.24.016037 OPEXFF 1094-4087 Google Scholar
N. C. Shaner, P. A. Steinbach and R. Y. Tsien,
“A guide to choosing fluorescent proteins,”
Nat. Methods, 2
(12), 905
–909
(2005). http://dx.doi.org/10.1038/nmeth819 1548-7091 Google Scholar
M. A. Rizzo et al.,
“An improved cyan fluorescent protein variant useful for FRET,”
Nat. Biotechnol., 22 445
–449
(2004). http://dx.doi.org/10.1038/nbt945 NABIF9 1087-0156 Google Scholar
T. Nagai et al.,
“A variant of yellow fluorescent protein with fast and efficient maturation for cell-biological applications,”
Nat. Biotechnol., 20 87
–90
(2002). http://dx.doi.org/10.1038/nbt0102-87 NABIF9 1087-0156 Google Scholar
H. Yu et al.,
“An empirical quantitative fluorescence resonance energy transfer method for multiple acceptors based on partial acceptor photobleaching,”
Appl. Phys. Lett., 100
(25), 253701
(2012). http://dx.doi.org/10.1063/1.4729481 APPLAB 0003-6951 Google Scholar
H. Yu et al.,
“Ma-PbFRET: multiple acceptors FRET measurement based on partial acceptor photobleaching,”
Microsc. Microanal., 19
(01), 171
–179
(2013). http://dx.doi.org/10.1017/S1431927612014079 MIMIF7 1431-9276 Google Scholar
BiographyJiang Zhang received his MS degree in optics from South China Normal University. His current research interests include quantitative FRET imaging. He is now working at the China National Infrared and Galvanothermy Product Quality Supervision and Inspection Center. Fangrui Lin is studying for his MS degree at South China Normal University. His current research interests include fluorescence microscopy and biomedical optics. Liuying Chai received her MS degree in optics from South China Normal University. She is studying for her PhD at Shanghai Jiao Tong University. She is the author of five journal papers. |
||||||||||||||||||||||||||||||||||||||||||||||||||||||||||||||||||||||||||||||||||||||||||||||||||||||||||||||||||||||||||||||||||||||||||||||||||||||||||||||||||||||||||||||||||||||||||||||||||||||||||||||||||||||||||||||||||||||||||||||||||||||||||||||||||||||||||||||||||||||||||||||||||||||||||||||||||||||||||||||||||||||||||||||||||||||||||||||||||||||


