|
|
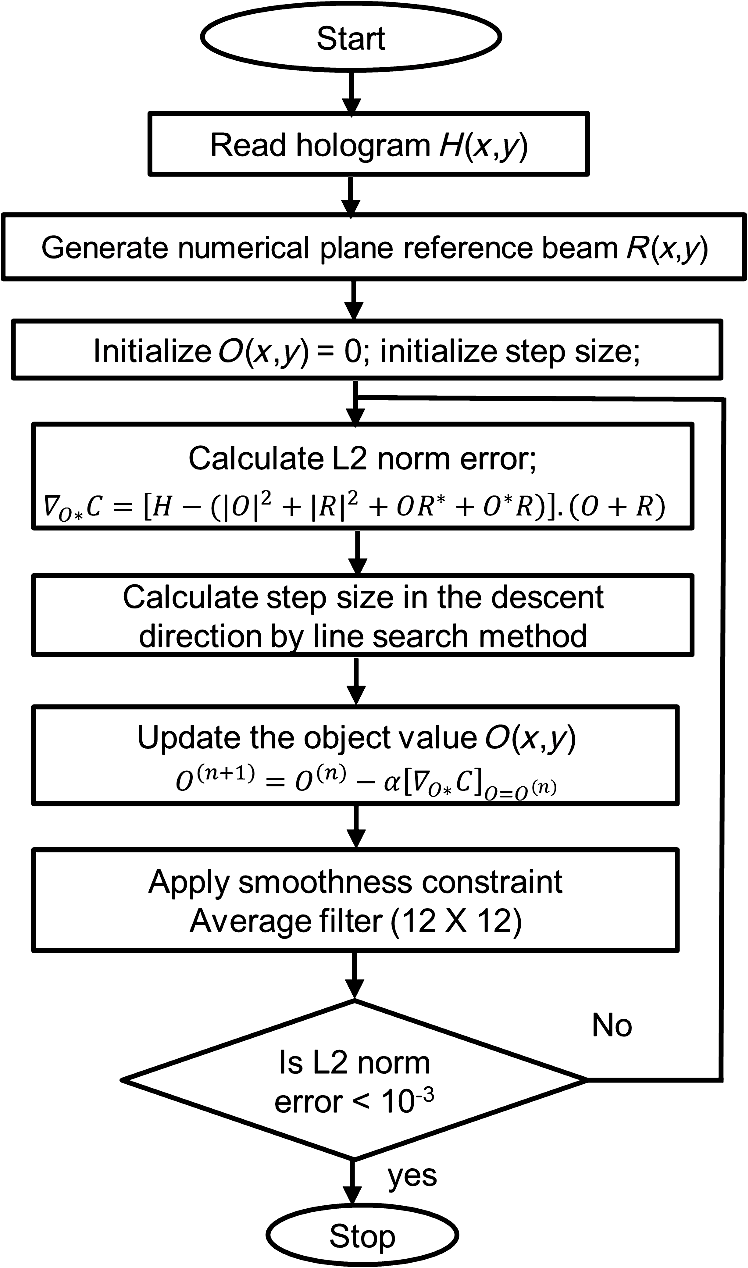
1.IntroductionBiological specimens are weakly scattering and absorbing and hence it is hard to visualize them using a bright field microscope. Zernike’s phase contrast microscope1 solves this problem by converting the phase change of the object into amplitude change to improve contrast. But quantitative estimation of phase is not feasible with this technique. Wang et al. developed a new technique named as spatial light interference microscopy2 combining the principle of Zernike phase contrast microscopy and temporal phase shifting3 to quantify the phase, but fast imaging is limited with this technique due to its multiple recording nature. Single-shot quantitative phase imaging (QPI) techniques such as Hilbert phase microscopy4, digital holographic microscopy (DHM),5,6 diffraction phase microscopy (DPM),7,8 and white light diffraction phase microscopy (w-DPM) have been developed in the last few decades, aiming at visualizing weakly scattering and absorbing biological specimens with high contrast and quantifying the thickness of the specimens to subwavelength accuracies. These QPI techniques have been explored in different biological applications.9–12 Ikeda et al. developed the Hilbert phase microscopy and demonstrated its application in studying the morphology of red blood cells (RBCs), quantifying the RBC volume, observing the thermal fluctuations in RBCs, and imaging tissue slices of mouse brain, spleen, and liver.4,13,14 DHM has been demonstrated in various applications such as quantifying the thickness of living neuron cells,15 imaging the remodeling of synaptic network in neurons,11 sperm imaging,16,17 and so on. Park et al.7 have combined the diffraction phase and fluorescence microscopy and demonstrated its application in simultaneous quantitative phase image and epifluorescence imaging of a mitotic kidney cell. Bhaduri et al.18 have developed the w-DPM and shown its application in imaging cell structure of HeLa cells with nucleoli. Most of the above techniques use the off-axis interferometric principle and hence require the reference beam to be at a minimum angle19 to spatially separate the DC and twin image terms in the Fourier domain. Few techniques use spatial phase shifting methods to separate the DC and twin image terms.20,21 However, phase shifting should be optimized to separate completely, the DC and the twin images for reconstruction. In the case of off-axis interferometric imaging, these spatial frequencies are often filtered using Fourier filtering techniques.22 The minimum reference angle required to reconstruct the off-axis interferograms of the object with the highest spatial frequency is given by .19 With commercially available cameras, with typical pixel sizes of 2 to in the visible wavelength region, this minimum angle criterion limits the achievable spatial resolution of the object. In other words, these off-axis interferometric techniques do not utilize the full spatial resolution offered by digital cameras23 and hence the practical resolution limit is well below the actual optical diffraction limit. This problem is addressed in temporal phase shifting interferometric (PSI) techniques24 in which multiple on-axis interferograms are recorded at different phase steps and the object phase can be retrieved with high spatial resolution. But due to the multiple recording nature, PSI prevents the real-time dynamic imaging. Recently, a constrained optimization approach has been described to address this reconstruction process in digital holography.25,26 Experimental results show excellent high-resolution image recovery compared to conventional Fourier filtering techniques, for the interferograms recorded with less than minimum angle criterion. This constrained optimization approach has been demonstrated to image the RBCs using DHM at the image plane.27 However, it requires an additional recording of the hologram to find the angle of reference beam. It also requires an additional microscope objective (MO) in the reference arm that is identical to the one used in the object arm to correct the aberrations introduced in the object arm. In this paper, we use the modulation property of the Fourier transform to find the reference beam angle from the hologram without any additional recording. A numerical aberration compensation algorithm is employed for correcting the aberrations in the object beam. The complex object field is recovered at the hologram plane by solving a constrained optimization problem. The optimization problem is solved by a gradient descent approach iteratively and a smoothness constraint is implemented by spatial averaging with an appropriately sized window. The recovered complex object is back-propagated from the hologram plane to the image plane using the Fresnel back-propagation algorithm. Experimental results show a higher resolution for image recovery of a United States Air Force (USAF) resolution target with the constrained optimization approach compared to the conventional Fourier filtering technique. We also demonstrate the potential of this technique in imaging biological cells, by reconstructing high-resolution quantitative phase microscope images of yeast cells, RBCs, and the dynamics of live dividing yeast cells. 2.Experimental Set-UpA Mach–Zehnder geometry is used to design the basic near on-axis DHM experimental set-up (Fig. 1). A coherent green laser source (wavelength: 532 nm, power 10 mW, Coherent™ make) is split into two beams using a beam splitter, to be used as the object, and the reference beams. Both the beams are spatial filtered and expanded using a spatial filter-beam expander assembly. The object beam passes through the specimen and is magnified using an MO. The magnified object wave interferes on the detector array with the reference beam () to produce the digital hologram of the microscopic object in a near on-axis configuration. In this near on-axis DHM configuration, the reference beam is used at a very small angle and the angle is not sufficient to spatially resolve the DC and twin images. It is always inconvenient to have a large reference beam angle while performing high-resolution microscopy of live cells and biological specimens due to the limited higher spatial frequencies recording by the camera.28 However, the reconstructed image is poorly resolved, if the hologram is recorded below a minimum reference angle. In this experiment, we explicitly record the hologram with the reference beam below its minimum reference beam angle to show the capability of our approach. A CMOS (IDS, UI-1482LE-M, array square pixel) array records the digital hologram 4 cm away from the image plane on the microscope and it is transferred to the computer for further processing. Image reconstructions are carried out on a MATLAB R2015 platform. 3.Reconstruction ProcessThe recovery of complex object information from a single digital hologram is modeled as a constrained optimization problem.25,26,29 The hologram recorded due to the interference between the object beam and the reference beam at the hologram plane is given by The complex object function can be recovered from the hologram with the known reference beam using the constrained optimization approach. The known plane reference beam should be numerically coded and it should match exactly the experimental reference beam.3.1.Reference Beam Angle CalculationThe plane reference beam can be mathematically expressed as where , are the two components of the reference wave vector and is the amplitude of the reference plane. The values of the and are calculated by the modulation property of the Fourier transform of the hologram without any additional recording. If and is a Fourier transform pair, then the modulation property of the Fourier transform30 is given as Fourier transform of the hologram will give the DC and the sideband frequencies in the Fourier plane. By knowing the shift in the number of pixels of sideband frequencies from the DC, the values of and can be calculated as where is the wavelength of the light, and are the shift in the number of pixels of sideband frequencies from the DC in the - and - directions, respectively, and and are spatial frequencies given by where and are the number of pixels of digital array and and are the pixel sizes.3.2.Constrained Optimization Approach for Single-Shot Holographic MicroscopyThe complex object function in the hologram plane can be recovered by solving an optimization problem with a smoothness constraint. We define a cost function to be minimized using the recorded hologram , the unknown object function and the known reference beam where the first term represents the L2-norm error and is a penalty function for imposing the smoothness constraint on the complex object function . The smoothness constraint is used to reduce the effect of the DC and the twin image in the solution of the minimization problem for . The cost function in Eq. (6) is minimized using a gradient descent approach.21The complex gradient of the cost function with respect to is represented as The object function is iteratively updated by Here, is the gradient cost function as per Eq. (7) and is the positive constant denoting the step size in the negative gradient direction that is selected by the standard line-search method in each iteration. This algorithm is implemented iteratively by setting in Eq. (7), calculating the L2 norm error and updating the guess solution by Eq. (8). The smoothness constraint is then applied with an averaging square shape filter () in each iteration. The overall algorithm is summarized into a single equation as Eq. (9) and also in Fig. 2, The averaging square shape filter is chosen in such a way that there should be minimal loss in the resolution of an image after reconstruction. However, this averaging filter may have a minor effect on sharp edges if the complex object field is recovered at the image plane and hence the hologram is recorded and the complex object field is recovered at minimum distance from the image plane and then back propagates to the image plane. Also, the advantage of the numerical propagation allows to computationally refocus the slightly defocused image to the exact image plane.3.3.Fresnel Back PropagationOnce the complex object function is recovered at the hologram plane then it is back-propagated31 to the image plane by the Fresnel back-propagation method where is the recovered complex object using the constrained optimization approach in the hologram plane, and are the sampling intervals of the hologram with the CMOS camera, is the distance between the hologram plane and image plane, and and are the sampling intervals in the reconstruction plane given by Eq. (11). The reconstructed object in the image plane is calculated by multiplying with and applying an inverse discrete Fourier transform to the product.3.4.Amplitude and Phase Contrast Imageis an array of complex numbers, from which the amplitude-contrast image can be obtained by calculating the intensity given by and the phase image, by calculating the argument given by3.5.Automated Aberration CorrectionMO used in the object path for magnification produces a curvature aberration in the object beam. This deformation affects only the phase of the object wave and does not disturb amplitude-contrast imaging. Phase aberration can be corrected by multiplication of the reconstructed wave front with the array of complex numbers called digital phase mask 31 and the final reconstruction equation with aberration correction is given by The aberration in the system is obtained by finding the coefficients of the Zernike polynomial using phase data.32–34 The coefficients of the Zernike polynomial is calculated by the two-dimensional linear least square fitting algorithm of any order to the phase data extracted along two-dimensional profiles in the areas of the specimen known to be flat. Using these coefficients, a digital phase mask which is the complex conjugation of aberration introduced in the object wave is calculated by where is the coefficient of the Zernike polynomial () and is the order of the polynomial. Finally, the aberration-corrected complex image in the image plane is obtained by Eq. (14). More details of the procedure are explained in Refs. 32 and 33.4.Results and DiscussionsWe have tested the constrained optimization approach for imaging live yeast cells. Yeast cells were grown in a yeast peptone dextrose medium, and of the culture were pipetted out onto a microscopic glass slide and covered with coverslip. The hologram is recorded using the MO and . A near on-axis angle of is used between the object beam and the reference beam. This angle is well below the minimum angle criterion, hence making it difficult to separate DC and twin image terms by Fourier filtering. Hence in this system, Fourier filtering will decide the maximum achievable resolution that is lower than the optical diffraction limit of the system. In this paper, we compare the reconstruction of a hologram by both the Fourier filtering method and the constrained optimization method. The recorded hologram and amplitude of Fourier transform of the hologram are shown in Figs. 3(a) and 3(b), respectively. 4.1.Image Recovery by Fourier Filtering ApproachFourier filtering is a well-known method for separating the DC and twin images from the off-axis hologram. Three different sizes of Fourier filters were used to demonstrate the quality of reconstruction by this method. We filtered the OR* term for the reconstruction process. In the amplitude of Fourier transform of the hologram image as shown in Fig. 3(b), the distance between the DC and the sideband peak is 118 pixels. Initially, we started with the Fourier filter of size of centered on the OR* peak as shown in Fig. 4(a). The reconstructed amplitude and phase images of the Fourier filtered hologram are shown in Figs. 4(b) and 4(c), respectively. The phase images shown are aberration-corrected and details of the aberration correction is shown in Sec. 3.5. The object region marked as a white rectangle in the amplitude images is used for aberration correction. The reconstructed image does not contain any DC or twin image term but the resolution is poor because of the selection of a low number of pixels in filtering. In the next step, we used a Fourier filter of size as shown in Fig. 4(d). Now, the reconstructed amplitude and phase images have improved in resolution as shown in Figs. 4(e) and 4(f), respectively, but it has interference noise from the background DC that destroys the original resolution. Similarly as the size of the Fourier filter increases to as shown in Fig. 4(g), the reconstructed amplitude and phase images contain both DC and OR* terms as shown in Figs. 4(h) and 4(i), respectively. Even though the resolution of the reconstructed image increased with a larger filter size, the presence of strong DC has increased the noise thereby spoiling the achievable resolution completely. Fig. 4Image reconstruction using Fourier filtering technique with the increasing size of filter window. (a), (d), and (g): amplitude of the Fourier transform of the hologram with square filter. (b), (e), and (h) The reconstructed amplitude images. (c), (f), and (i) The reconstructed phase images. As the filter size increases from () to , the resolution improves but it has interference from DC [Figs. 4(e) and 4(f)]. Similary as the filter size increases to , the image contains both DC and OR* [(h) and (i)]. (Color bar indicates phase in radians.) 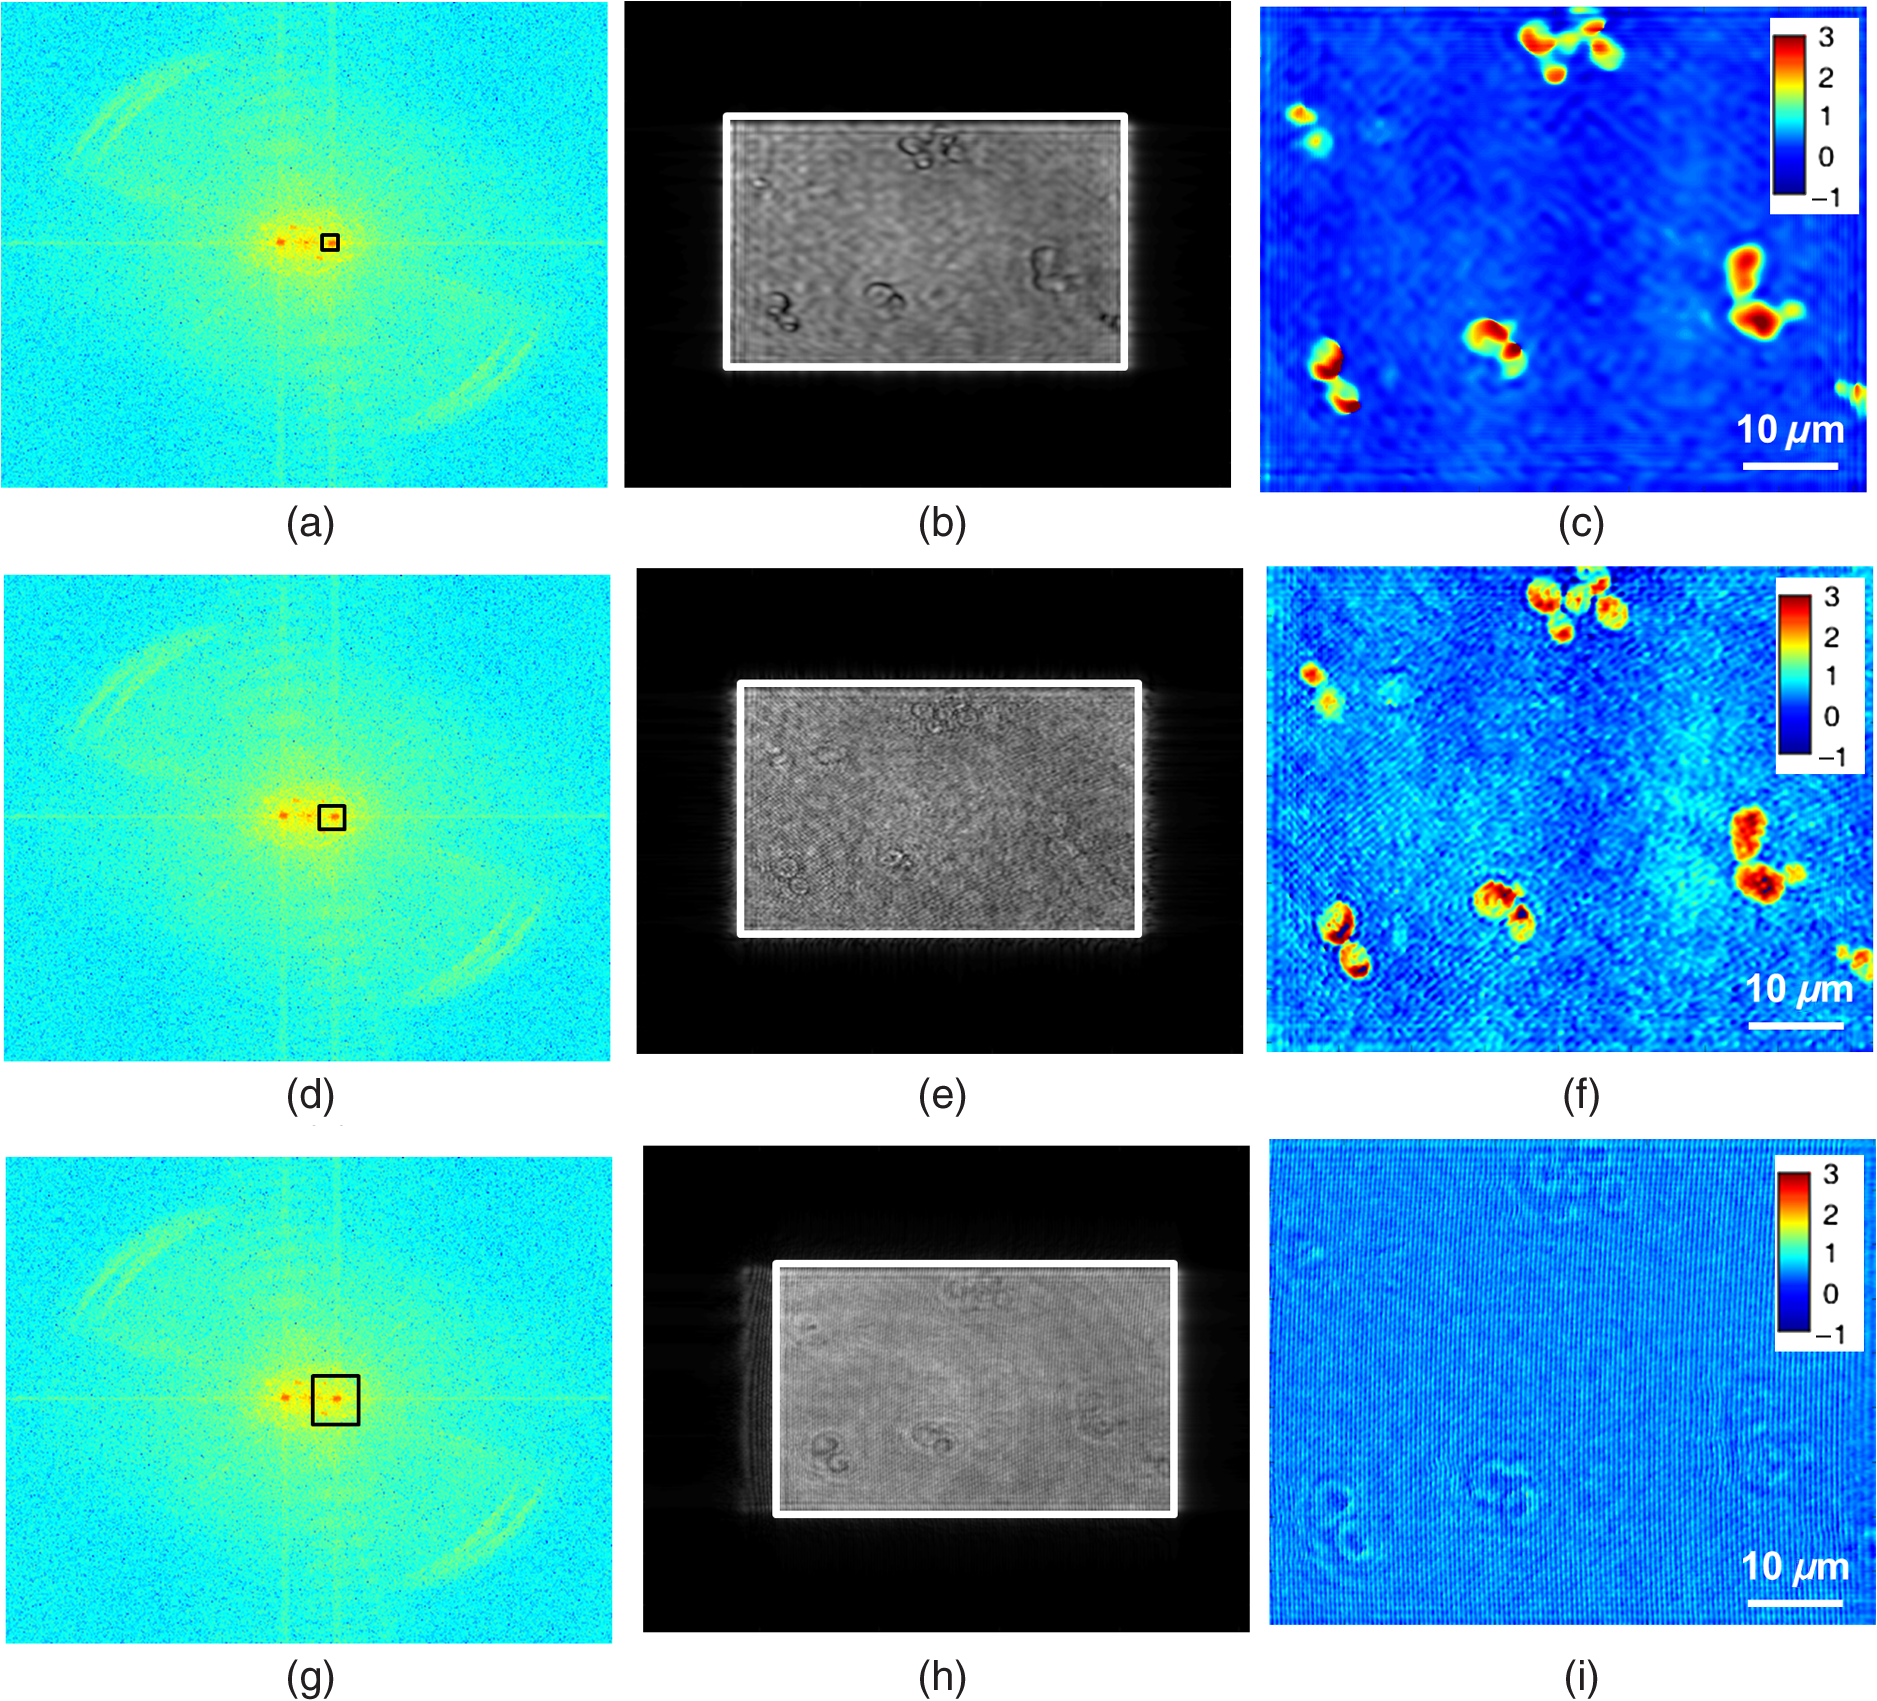 4.2.Image Recovery by Solving Minimum L2-Norm Problem with Smoothness ConstraintWe used the constrained optimization approach to reconstruct the same hologram that was used for Fourier filtered reconstruction. The solution to the optimization algorithm [Eq. (9)] is an iterative approach solved for minimum L2 norm. This approach provides the complex object wave in the hologram plane from a single hologram. The reference beam is numerically coded by Eq. (2) to exactly match the experimental reference beam. The distance between DC and sidebands in the -direction is 118 pixels and the -direction is 0 pixels. With the wavelength of 532 nm and pixel size of , the value of and is found to be 0.0111 and 0, respectively. We used a zero matrix of the size of object as an initial guess for this iterative approach. In our case, the solution converged to a minimum L2 norm error in 30 iterations. The step size “,” which is in the range of 0.01 to 0.1, was selected using the line-search method. The solution to Eq. (6) is modulated by the carrier frequencies and its harmonics. This modulation can be filtered by an averaging filter () in each iteration. The size of the averaging filter is chosen in such a way that it should be half of the fringe period of the hologram. In our case, the hologram fringe period was 24 pixels and hence the size of the average filter was . It may be noted that this averaging filter has a slight smoothening effect on the sharp edges of the object. Hence, we observed that the recording of the hologram at a short defocus distance from the image plane helped in recovering the sharp edges of the object better. The calculated computation time for 30 iterations is 15 s on a PC with 3.4 GHz Intel core processor. A graphics processing unit-based computation with further code optimization would further decrease the computation time. Figures 5(a) and 5(b) show the amplitude and phase of recovered object field in the hologram plane. The microscopic objective used in the object arm produces a wave front curvature in the object beam and affects only the phase of image. This curvature is clearly visible in the phase image [Fig. 5(b)]. The recovered complex object plane is back-propagated to the image plane by Fresnel back propagation [Eq. (10)] and the amplitude of the object field is shown in Fig. 5(c). The aberrated-phase image is numerically corrected by the algorithm mentioned in Sec. 3.5 and only the object region [marked as a white rectangle in Fig. 5(c)] is used for phase correction. A Zernike polynomial of order 21 was used for aberration correction. The aberration-corrected phase image is shown in Fig. 5(d). Fig. 5Imaging of yeast cells using constrained optimization approach on DHM. The results are compared with reconstruction using Fourier filter method [Fig. 5(e)]. (a) Amplitude image and (b) phase of the recovered complex object wave. (c) Amplitude of object at the image plane obtained by Fresnel propagation. (d) Aberration-corrected phase image at the image plane. (e) Aberration-corrected phase image at the image plane using Fourier filter method of filter size . Inset in (d) and (f) show the zoomed view of rectangle marked as 1 and 2. (f) 3-D rendering of yeast cell for the rectangle shown in (d) (color bar indicates phase in radians).  Comparison of the reconstructed amplitude images [Figs. 4(b) and 5(c) of the Fourier filtering of size and constrained optimization approach, respectively] shows that our approach provides images with improved resolution and less speckle noise and without any interference from DC and twin image terms. The phase images retrieved through the constrained optimization approach [Fig. 5(d)] show clear subcellular features [zoomed view show in inset] compared to the phase images obtained through the Fourier filtering approach [Fig. 5(e)] with a filter size of . Three–dimensional (3-D) rendering of yeast cells for the rectangle 1 shown in Fig. 5(d) is shown in Fig. 5(f). The thickness of yeast cells was found to be in the range of 3 to with the average refractive index as 1.395 (Refs. 35 and 36) and surrounding medium had a refractive index of 1.339. QPI of actively dividing live yeast cells were carried out to demonstrate the capability of the system for observing the real-time dynamics using single-shot imaging. The holograms of live yeast cells were recorded at the rate of for 22 s. The holographic videos were recorded in real time and reconstructed offline with our optimization approach. The phase images of live dividing yeast cells at different time stamps are shown in Fig. 6 and the multimedia file is shown in Video 1. Fig. 6Dynamics of live dividing yeast cells with different times stamps (color bar indicates phase in radians) (Video 1, QuickTime 10.9 MB [URL: http://dx.doi.org/10.1117/1.JBO.21.10.106003.1]).  A USAF resolution chart was used as an object to demonstrate the resolution improvement. An MO (, ) was used for recording the hologram. The recorded hologram and amplitude of the Fourier transform of the hologram are shown in Figs. 7(a) and 7(b), respectively. Figures 7(c) and 7(d) show the amplitudes of the recovered object field and the Fourier transform of the recovered object field in the hologram plane using the optimization approach. The reconstructed amplitude image [Fig. 7(e)] at the image plane is obtained by Fresnel back propagation [Eq. (10)] of the recovered complex object field. Reconstructed amplitude image [Fig. 7(f)] using the Fourier filtering of size is shown here for comparison. Insets in Figs. 7(e) and 7(f) show the zoomed view of the group 5 element 4 of the USAF resolution target in both the optimization approach and the conventional Fourier filtering approach, respectively. This shows that objects can be clearly recovered with improved resolution using a constrained approach from a near on-axis hologram from a single shot. Fig. 7Comparsion of constrained optimization approach and Fourier filtering approach. (a) Hologram of USAF resolution target. (b) Amplitude of Fourier transform of the hologram. (c) Amplitude image of the recovered complex object wave. (d) Amplitude of the Fourier transform of recovered object wave. (e) Reconstructed amplitude image using constrained optimization approach. (f) Reconstructed amplitude image using Fourier filtering approach of filter size . 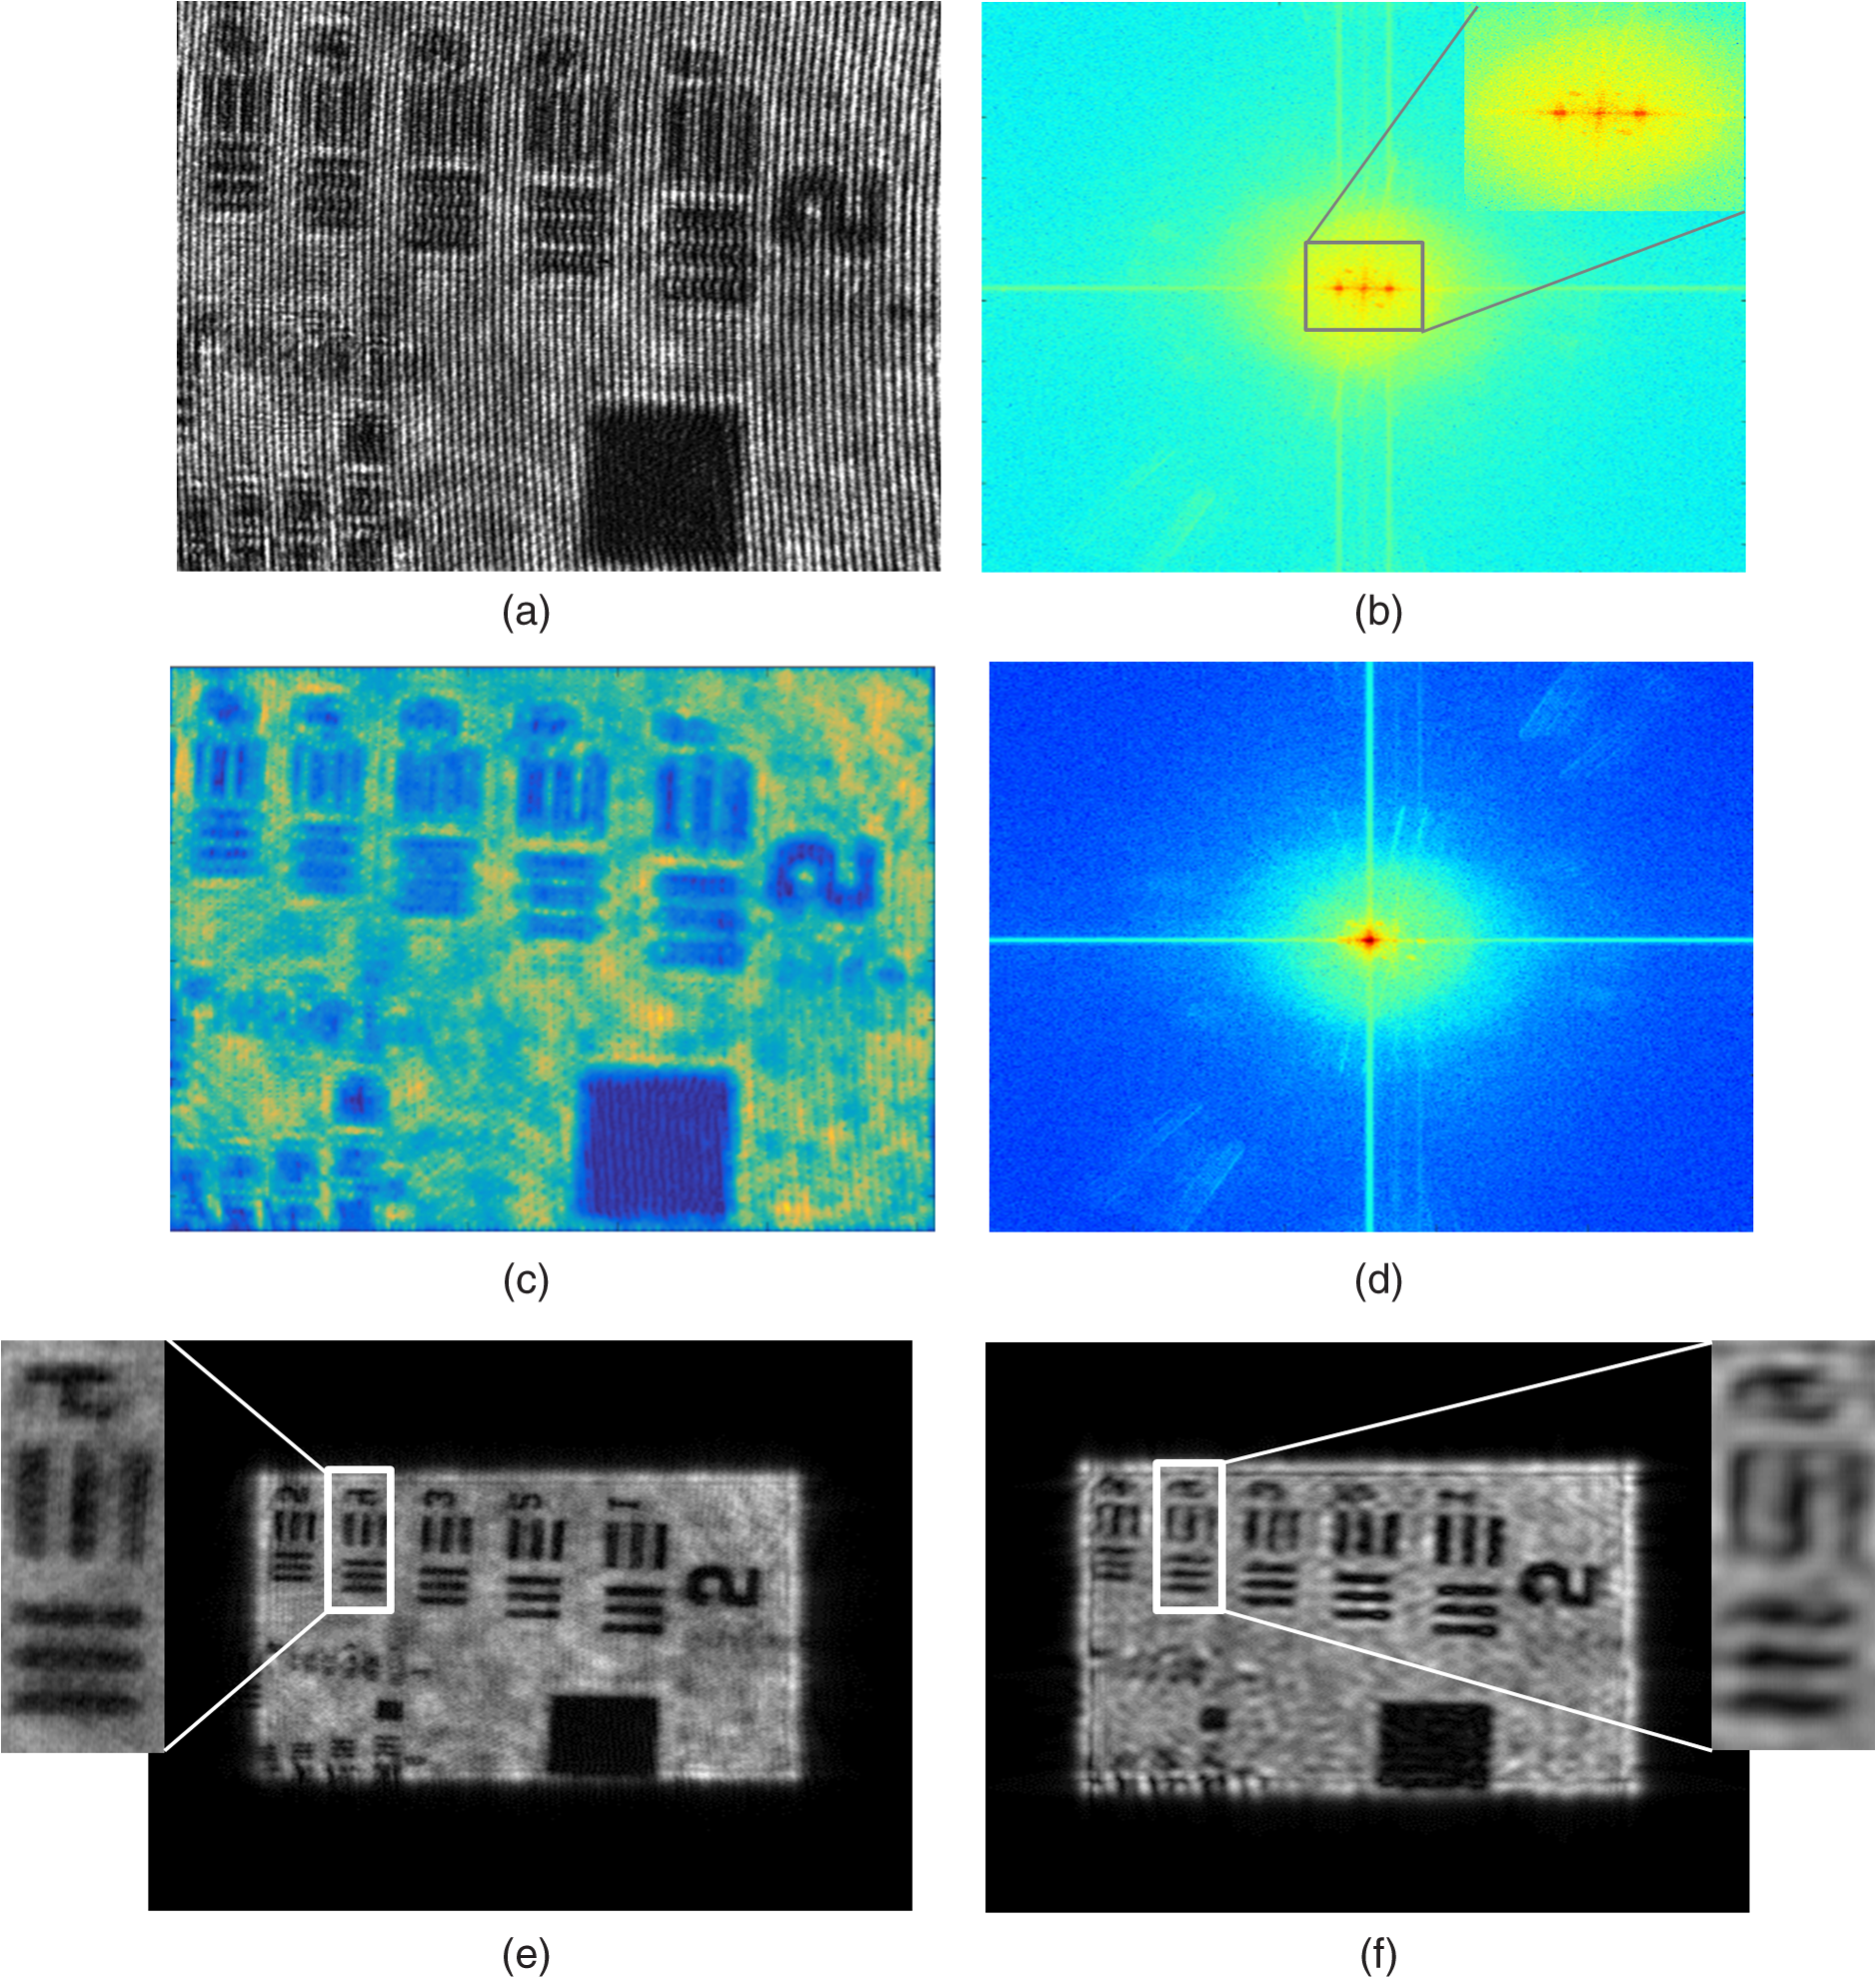 We also demonstrate this approach by reconstructing the near on-axis holograms recorded for RBCs. RBCs are prepared for imaging according to the standard procedure.37 Two micro liters of diluted RBCs were pipetted out on the glass slide and covered with the cover slip. The holograms are recorded with MO of and . The reconstructed phase images of RBCs with our constrained optimization approach and conventional Fourier transform approach are shown in Figs. 8(a) and 8(b), respectively. 3-D renderings of RBC shown in rectangles in Figs. 8(a) and 8(b) are shown in Figs. 8(c) and 8(d). The line profiles across the single RBC in Figs. 8(a) and 8(b) (dotted line) are shown in Fig. 8(e). Due to the overlapping DC and OR* term and subsequent limitation in selection of spatial frequencies by Fourier filter window size, the biconcave shape could not be reconstructed using the Fourier filtering approach, whereas the constrained optimization approach could reconstruct the biconcave shape of RBC. Fig. 8Reconstructed phase image of RBCs (a) and (c) constrained optimization approach (b) and (d) Fourier filtering approach. (c) and (d) 3-D rendering of RBC marked as rectangle in (a) and (b), respectively. (e) Line profile across cells in (a) and (b) (dotted line) indicating the improvement in phase resolution in the constrained optimization approach. (Color bar indicates phase in radians.)  By performing a near on-axis recording with overlapping interference terms, we capture higher spatial frequencies that would have been lost otherwise. Hence, we expect improved resolution in this technique in cases in which an off-axis technique would lose the higher spatial frequencies and result in lower resolution due to the angle chosen for the reference beam. As the constrained optimization approach can effectively retrieve the object in the presence of overlapping DC and twin image terms, we can effectively exploit the maximum space-bandwidth in terms of camera pixels and collected spatial frequencies without having to worry about overlapping terms. The proof of concept is well evident in the results reported using the USAF resolution chart [Figs. 7(e) and 7(f)], RBCs [Figs. 8(b) and 8(c)], showing improved resolution using the current technique compared to the Fourier filtering approach. 5.ConclusionWe demonstrate a quantitative phase microscope with a constrained optimization approach, capable of recovering images using a USAF resolution target, RBCs, and yeast cells. DHM with this optimization approach provides high-resolution image recovery even if a minimum reference beam criterion is not met to separate DC and twin image. The small reference beam angle is automatically calculated with a single hologram without any additional recording. Compared to conventional Fourier filtering DHM, this system has the ability to provide the images with improved resolution allowed by a digital detector array with a single shot. We also demonstrated an automatic aberration correction algorithm to correct the phase aberrations introduced by MO without any additional objectives in the reference beam. The results reported here demonstrate the strong potential of DHM in imaging live cells in three dimensions and their dynamics in real time with high sensitivity and high resolution. The use of a constrained optimization approach is promising for delivering a compact platform with near-zero angle between object and reference beams and with effective utilization of the camera resolution rendering high-resolution images at a slightly higher computational cost. This high-resolution computational approach for image recovery has high potential in rapid clinical quantifications and pathological applications in the near future. AcknowledgmentsOne of the authors, Renu John, acknowledges financial support from the Science and Engineering Research Board (SERB), DST, India (SR/S2/LOP-0024/2012) and BRNS, India (34/14/04/2015/BRNS). ReferencesF. Zernike,
“Phase contrast, a new method for the microscopic observation of transparent objects,”
Physica, 9
(7), 686
–698
(1942). http://dx.doi.org/10.1016/S0031-8914(42)80035-X Google Scholar
Z. Wang et al.,
“Spatial light interference microscopy (SLIM),”
Opt. Express, 19 1016
–1026
(2011). http://dx.doi.org/10.1364/OE.19.001016 OPEXFF 1094-4087 Google Scholar
I. Yamaguchi and T. Zhang,
“Phase-shifting digital holography,”
Opt. Lett., 22
(16), 1268
–1270
(1997). https://doi.org/10.1364/OL.22.001268 Google Scholar
T. Ikeda et al.,
“Hilbert phase microscopy for investigating fast dynamics in transparent systems,”
Opt. Lett., 30
(10), 1165
–1167
(2005). http://dx.doi.org/10.1364/OL.30.001165 OPLEDP 0146-9592 Google Scholar
X. Yu et al.,
“Review of digital holographic microscopy for three-dimensional profiling and tracking,”
Opt. Eng., 53
(11), 112306
(2014). http://dx.doi.org/10.1117/1.OE.53.11.112306 Google Scholar
X. Yu et al.,
“Four-dimensional motility tracking of biological cells by digital holographic microscopy,”
J. Biomed. Opt., 19
(4), 045001
(2014). http://dx.doi.org/10.1117/1.JBO.19.4.045001 JBOPFO 1083-3668 Google Scholar
Y. Park et al.,
“Diffraction phase and fluorescence microscopy,”
Opt. Express, 14
(18), 8263
–8268
(2006). http://dx.doi.org/10.1364/OE.14.008263 OPEXFF 1094-4087 Google Scholar
G. Popescu et al.,
“Diffraction phase microscopy for quantifying cell structure and dynamics,”
Opt. Lett., 31
(6), 775
–777
(2006). http://dx.doi.org/10.1364/OL.31.000775 OPLEDP 0146-9592 Google Scholar
E. Shaffer et al.,
“Digital holographic microscopy investigation of second harmonic generated at a glass/air interface,”
Opt. Lett., 34
(16), 2450
–2452
(2009). http://dx.doi.org/10.1364/OL.34.002450 OPLEDP 0146-9592 Google Scholar
N. Pavillon et al.,
“Study of intracellular ion dynamics with a multimodality approach combining epifluorescence and digital holographic microscopy,”
(2010). Google Scholar
Y. Cotte et al.,
“Marker-free phase nanoscopy,”
Nat. Photonics, 7
(2), 113
–117
(2013). http://dx.doi.org/10.1038/nphoton.2012.329 NPAHBY 1749-4885 Google Scholar
P. Marquet et al.,
“Exploring neural cell dynamics with digital holographic microscopy,”
(2013). Google Scholar
G. Popescu et al.,
“Erythrocyte structure and dynamics quantified by Hilbert phase microscopy,”
J. Biomed. Opt., 10
(6), 060503
(2005). http://dx.doi.org/10.1117/1.2149847 JBOPFO 1083-3668 Google Scholar
N. Lue et al.,
“Tissue refractometry using Hilbert phase microscopy,”
Opt. Lett., 32
(24), 3522
–3524
(2007). http://dx.doi.org/10.1364/OL.32.003522 OPLEDP 0146-9592 Google Scholar
P. Marquet et al.,
“Digital holographic microscopy: a noninvasive contrast imaging technique allowing quantitative visualization of living cells with subwavelength axial accuracy,”
Opt. Lett., 30
(5), 468
–470
(2005). http://dx.doi.org/10.1364/OL.30.000468 OPLEDP 0146-9592 Google Scholar
G. D. Caprio et al.,
“Quantitative label-free animal sperm imaging by means of digital holographic microscopy,”
IEEE J. Sel. Top. Quantum Electron., 16
(4), 833
–840
(2010). http://dx.doi.org/10.1109/JSTQE.2009.2036741 IJSQEN 1077-260X Google Scholar
I. Crha et al.,
“Digital holographic microscopy in human sperm imaging,”
J. Assisted Reprod. Genet., 28
(8), 725
–729
(2011). http://dx.doi.org/10.1007/s10815-011-9584-y JARGE4 1058-0468 Google Scholar
B. Bhaduri et al.,
“Diffraction phase microscopy with white light,”
Opt. Lett., 37
(6), 1094
–1096
(2012). http://dx.doi.org/10.1364/OL.37.001094 OPLEDP 0146-9592 Google Scholar
J. W. Goodman, Introduction to Fourier Optics, Roberts & Company, Pittsburgh, Pennsylvania
(2005). Google Scholar
M. Liebling, T. Blu and M. Unser,
“Complex-wave retrieval from a single off-axis hologram,”
J. Opt. Soc. Am. A, 21
(3), 367
–377
(2004). http://dx.doi.org/10.1364/JOSAA.21.000367 JOAOD6 0740-3232 Google Scholar
D. Carl et al.,
“Parameter-optimized digital holographic microscope for high-resolution living-cell analysis,”
Appl. Opt., 43
(36), 6536
–6544
(2004). http://dx.doi.org/10.1364/AO.43.006536 APOPAI 0003-6935 Google Scholar
E. Cuche, P. Marquet and C. Depeursinge,
“Spatial filtering for zero-order and twin-image elimination in digital off-axis holography,”
Appl. Opt., 39
(23), 4070
–4075
(2000). http://dx.doi.org/10.1364/AO.39.004070 APOPAI 0003-6935 Google Scholar
M. K. Kim,
“Principles and techniques of digital holographic microscopy,”
Proc. SPIE, 1
(1), 018005
(2010). http://dx.doi.org/10.1117/6.0000006 PSISDG 0277-786X Google Scholar
U. Schnars and W. Jüptner, Digital Holography: Digital Hologram Recording, Numerical Reconstruction, and Related Techniques, Springer, New York
(2005). Google Scholar
K. Khare, P. T. S. Ali and J. Joseph,
“Single shot high resolution digital holography,”
Opt. Express, 21
(3), 2581
–2591
(2013). http://dx.doi.org/10.1364/OE.21.002581 OPEXFF 1094-4087 Google Scholar
P. T. Samsheerali, K. Khare and J. Joseph,
“Quantitative phase imaging with single shot digital holography,”
Opt. Commun., 319 85
–89
(2014). http://dx.doi.org/10.1016/j.optcom.2013.12.083 OPCOB8 0030-4018 Google Scholar
M. Singh and K. Khare,
“Single shot high resolution digital holographic microscopy,”
in 12th Int. Conf. on Fiber Optics and Photonics,
(2014). Google Scholar
E. Abbe,
“Beiträge zur Theorie des Mikroskops und der mikroskopischen Wahrnehmung,”
Archiv für mikroskopische Anatomie, 9
(1), 413
–418
(1873). http://dx.doi.org/10.1007/BF02956173 Google Scholar
V. P. Pandiyan, K. Khare and R. John,
“High resolution quantitative phase imaging of live cells with constrained optimization approach,”
Proc. SPIE, 9718 971803
(2016). http://dx.doi.org/10.1117/12.2209289 PSISDG 0277-786X Google Scholar
A. K. Jain, Fundamentals of Digital Image Processing, Prentice-Hall, Inc., Upper Saddle River, New Jersey
(1989). Google Scholar
E. Cuche, P. Marquet and C. Depeursinge,
“Simultaneous amplitude-contrast and quantitative phase-contrast microscopy by numerical reconstruction of Fresnel off-axis holograms,”
Appl. Opt., 38
(34), 6994
–7001
(1999). http://dx.doi.org/10.1364/AO.38.006994 APOPAI 0003-6935 Google Scholar
T. Colomb et al.,
“Automatic procedure for aberration compensation in digital holographic microscopy and applications to specimen shape compensation,”
Appl. Opt., 45
(5), 851
–863
(2006). http://dx.doi.org/10.1364/AO.45.000851 APOPAI 0003-6935 Google Scholar
T. Colomb et al.,
“Numerical parametric lens for shifting, magnification, and complete aberration compensation in digital holographic microscopy,”
J. Opt. Soc. Am. A, 23
(12), 3177
–3190
(2006). http://dx.doi.org/10.1364/JOSAA.23.003177 JOAOD6 0740-3232 Google Scholar
V. P. Pandiyan and R. John,
“Optofluidic bioimaging platform for quantitative phase imaging of lab on a chip devices using digital holographic microscopy,”
Appl. Opt., 55
(3), A54
–A59
(2016). http://dx.doi.org/10.1364/AO.55.000A54 APOPAI 0003-6935 Google Scholar
F. D. Bryant, P. Latimer and B. A. Seiber,
“Changes in total light scattering and absorption caused by changes in particle conformation—a test of theory,”
Arch. Biochem. Biophys., 135 109
–117
(1969). http://dx.doi.org/10.1016/0003-9861(69)90521-9 Google Scholar
B. E. Pyle, A. Brunsting and P. Latimer,
“Detection of the vacuole of yeast cells in suspension by transmittance radiometry,”
Appl. Opt., 18
(21), 3615
–3619
(1979). http://dx.doi.org/10.1364/AO.18.003615 APOPAI 0003-6935 Google Scholar
G. Popescu et al.,
“Optical measurement of cell membrane tension,”
Phys. Rev. Lett., 97 1
–4
(2006). http://dx.doi.org/10.1103/PhysRevLett.97.218101 PRLTAO 0031-9007 Google Scholar
BiographyVimal Prabhu Pandiyan received his BTech degree in biomedical engineering and his MTech degree in medical electronics from Anna University, Chennai, Tamil Nadu, India, in 2006 and 2011, respectively. He is currently pursuing his PhD in biomedical engineering at the Indian Institute of Technology Hyderabad. His current research interests are digital holographic microscopy, coherence and low-coherence microscopy, and quantitative phase imaging. Kedar Khare received his PhD from the Institute of Optics, University of Rochester, New York, USA, in 2004. After spending a couple years more at the University of Rochester as a research associate and over five years at GE Global Research as a lead scientist, he has been a faculty member in the Department of Physics, Indian Institute of Technology Delhi, since December 2011. His research interests include optics/photonics, computational imaging, inverse problems, signal processing, and compressive sensing. Renu John received his PhD from the Indian Institute of Technology Delhi in 2006. He carried out his postdoctoral research at the Fitzpatrick Center for Photonics, Duke University, Durham, North Carolina, USA, and Biophotonics Imaging Laboratory, University of Illinois, Urbana-Champaign, USA. He is currently an associate professor and head of the Department of Biomedical Engineering, Indian Institute of Technology Hyderabad. His research interests include nanobiophotonics, noninvasive NIR bio-imaging, 3-D phase microscopy, and optical coherence tomography (OCT). |