|
|
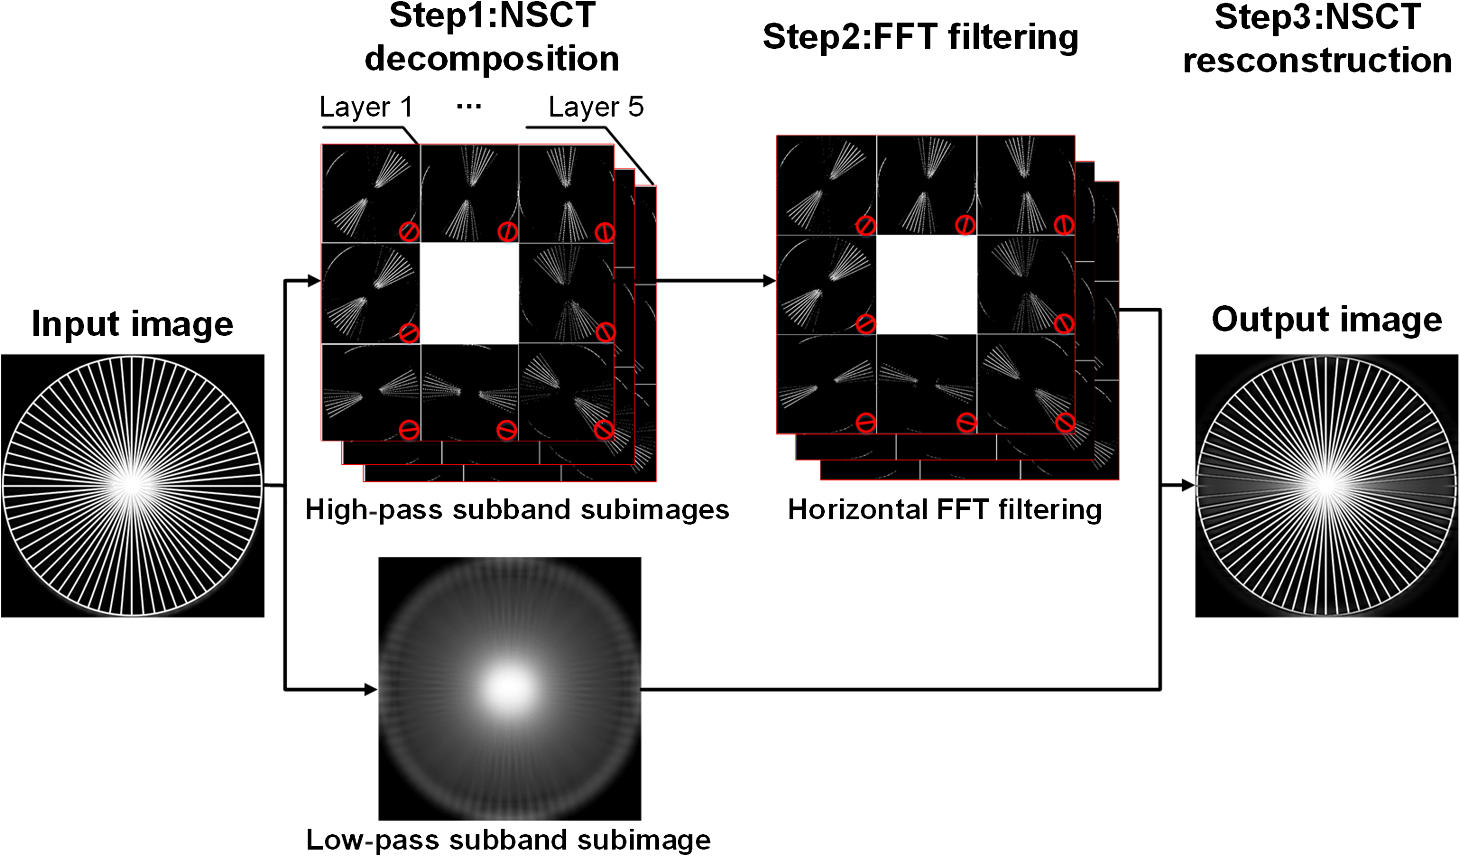
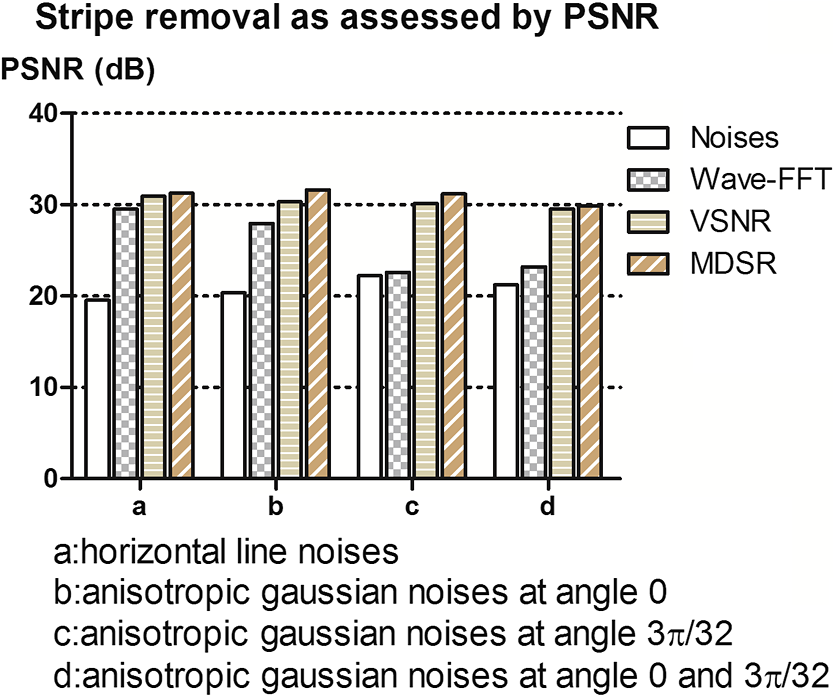
1.IntroductionLight sheet fluorescence microscopy (LSFM) is a high-resolution volumetric fluorescence microscopic technique which was selected as the “Method of the year” in 2014 by Nature Methods.1–4 Due to its large imaging scale and high imaging speed, LSFM is widely applied in embryo imaging,5 neurology,6 vascular analysis,7 tumor treatment evaluation,8,9 and even whole-body imaging.10,11 However, the accurate elimination of stripe artifacts is a limitation in the application of LSFM. These stripe artifacts are caused by high-absorption and/or scattering structures in the excitation light path such as impurities/bubbles outside the sample or a high light absorption/scattering structure inside the sample. Note that the appearance of bubbles often happens when dealing with highly viscous solutions such as tissue clearing solutions SeeDB12 and CUBIC.10 Unidirectional LSFM is the simplest LSFM system, in which the sample is illuminated from a single 90-deg angle with respect to the imaging objective. When observing large or dense samples, the unidirectional LSFM suffers the effects of stripe artifacts the most.13,14 As shown in Fig. 1(a), stripe artifacts in unidirectional LSFM occur in the same direction of the illumination. Several destriping algorithms have been developed for unidirectional LSFM. Many methods suppress stripe noise in the spatial domain by accounting for the distribution of the stripes according to a reference noise model, including histogram matching15 or moment matching16. Other methods treat destriping as a restoration problem and formulate an optimum problem to solve it.17–19 This is the case of the variational stationary noise remover (VSNR) method, which successfully removes stationary noise such as stripes.18 In addition, Münch et al.20 combined the wavelet and fast Fourier transform (wavelet-FFT method) to filter out the stripe noise. Furthermore, our group has developed a vertically scanned LSFM method to improve the image quality and reduce stripes in unidirectional LSFM.21 Fig. 1The stripe problem in LSFM images: (a) a slice of mouse colon imaged with a custom-made unidirectional LSFM system and (b) a slice of mouse heart imaged with a commercial multidirectional LSFM system. The red arrows indicate stripe noises.  In addition to these algorithms, bidirectional and multidirectional LSFM were developed to circumvent the stripe problem at the system level. Bidirection uses two parallel light sheets from both sides of the sample to remove the stripes.2 Similarly, multidirectional LSFM averages images from different illumination directions and further removes the stripes.22 Although these improvements generate homogenous fluorescence excitation, they still suffer from stripe artifacts in dense or low brightness samples.11 In Fig. 1(b), the image of a mouse heart scanned with a multidirectional system is shown and the remaining stripes are indicated with red arrows. Currently, there are few destriping methods for multidirectional LSFM. Moreover, most of the destriping algorithms in unidirectional LSFM will fail to deal with the multidirectional stripes since the stripes in multidirectional LSFM have complex noise patterns. Therefore, a general destriping method for both unidirectional and multidirectional LSFM is still needed. In this paper, we propose a multidirectional stripe remover (MDSR) method for both unidirectional and multidirectional LSFM images, making use of nonsubsampled contourlet transform (NSCT). The commercial LSFM system (Ultramicroscope II, Lavision Biotec.) used in this paper has six light sheets with every two placed in opposite directions, at 0-deg, 15-deg, and angles. NSCT is an image geometric information extraction method with the advantage of being totally shift invariant23 and it is widely used in image denoising and enhancing.24 The experimental results on a wide range of samples (such as mouse colon, heart, and brain) presented here show that MDSR effectively removes most of the stripe noise in both unidirectional and multidirectional LSFM. Moreover, a comparison and quantitative analysis revealed a higher destriping efficiency of the MDSR method when compared to VSNR and wavelet-FFT. This paper is organized as follows. Section 2 introduces the details of our method in three steps and Sec. 3 shows the comparative experiments with VSNR and the wavelet-FFT method. The validation experiment on custom-made and commercial systems, unidirectional and multidirectional LSFM are presented in Sec. 4. The conclusions and future directions are covered in Sec. 5. 2.AlgorithmIn an LSFM system, the stripes are parallel to the direction of the light sheet. The overall idea of our MDSR method is to split the stripes from the image and then eliminate them. Figure 2 shows the three-step workflow of MDSR including NSCT decomposition, FFT filtering, and NSCT reconstruction. A wheel-shaped graph is used as an input image and the inside lines simulate stripes in different directions. The purpose is to remove horizontal stripe artifacts. In the first step, NSCT decomposition splits the input image into subimages with different directions and scales. NSCT is an efficient multidirection and multiscale image edge representation method. Similar to the wavelets method, filter banks are also used in NSCT. The difference is that the wavelets method decomposes an image into only three directions: horizontal, vertical, and diagonal, whereas the NSCT considers more directions. More specifically, the input image is first decomposed into one low-pass subband layer and five high-pass subband layers, as shown in Fig. 2. Different layers indicate different scales. Each high-pass subband layer has eight subimages, representing components in eight directions. The stripe noise is often in a relatively fixed direction and most of its information is included in the high-pass subimage parallel to its direction. The red circle with a line inside indicates the decomposition direction of the high-pass subimage. Therefore, the NSCT step manages to decompose the input image into subimages with different directions and scales. The number of decomposition layers and directions is manually set to five and eight by visual guidance in MDSR. Note that when the two parameters are large, the model is accurate but time-consuming. In MDSR, the number of decomposition layers increases from one and stops when the stripe artifacts in the low-pass subimage are not visible. The number of directions is selected in a similar way; we found that eight is an appropriate value. In the second step, FFT filtering is performed on these high-pass subimages. Filtering in the horizontal direction is done in the frequency domain to remove the horizontal stripe coefficients. Then an inverse FFT is performed to update the subimages. In the NSCT reconstruction step, the enhanced image is generated by using NSCT reconstruction on these updated subimages in the space domain. The details of the proposed method are introduced as follows. 2.1.Nonsubsampled Contourlet Transform DecompositionThe first step of MDSR is to decompose an input image to multidirectional and multiscale subimages by using NSCT.25 NSCT is constructed based on a nonsubsampled pyramid (NSP) and nonsubsampled directional filter banks (NSDFB). The flowchart of NSCT decomposition in our method is shown in Fig. 3. An LSFM image is first filtered by NSP generating high- and low-pass subband subimages, which is similar to a Laplacian pyramid method. The low-pass image is then iteratively decomposed into high- and low-pass subimages. Multiscale subimages are obtained after the NSP process. After this process, NSDFB splits each high-pass subimage into different directional wedges, since NSDFB is a binary tree structured filter bank. In the NSCT decomposition step, the vector denotes the decomposition parameter of all layers in NSCT. indicates the total number of decomposition layers. means the decomposition level of NSDFB in layer and the NSDFB will decompose the high-pass subband subimage in layer to directions iteratively according to the binary tree structure of NSDFB. Each high-pass subimage has a scale value and a direction angle. The decomposition directions in layer are denoted as , where and its corresponding subimage is represented as . NSCT decomposition of the input LSFM image generates a series of subimages representing different geometric information. Benefiting from NSP’s multiscale property and NSDFB’s multidirectional property, the NSCT is suitable for generating subimages containing most of the stripe noise with fixed directions. 2.2.Fast Fourier Transform FilteringThe second step of MDSR is to filter all high-pass subimages to suppress the stripe noise. Given a unidirectional LSFM system, the directions of the light sheet and stripe are the same, in which case we assume that the stripes are at a fixed angle . The stripes in multidirectional LSFM images can be viewed as an overlay of stripes with several fixed angles. Given a single stripe artifact with a fixed direction, it has a low response in its horizontal direction and a high response in its vertical direction in the frequency domain.26 Figures 4(a)–4(c) show examples of regular line stripes, horizontal, and nonhorizontal anisotropy Gaussian stripes. The real stripes in unidirectional LSFM are similar to Fig. 4(b). As shown in Fig. 4(e), the two-dimensional (2-D) FFT image presents a high response in the vertical direction. Moreover, as shown in Figs. 4(c) and 4(f), 2-D FFT has rotational invariance, which means if we rotate the image at an angle, its Fourier transform will also rotate the same angle. This effect means that stripe frequency coefficients concentrate on a narrow frequency band, which may be suppressed to reduce the contribution of these particular stripe artifacts. The concept of damping the values of these frequency coefficients is an important part of several existing stripe removal methods.20,26 Fig. 4Different stripe models and their FFT images: (a) regular horizontal lines, (b) horizontal stripes generated by anisotropy Gaussian function, (c) nonhorizontal stripes generated by anisotropy Gaussian function with angle , and (d–f) FFT images of (a–c). 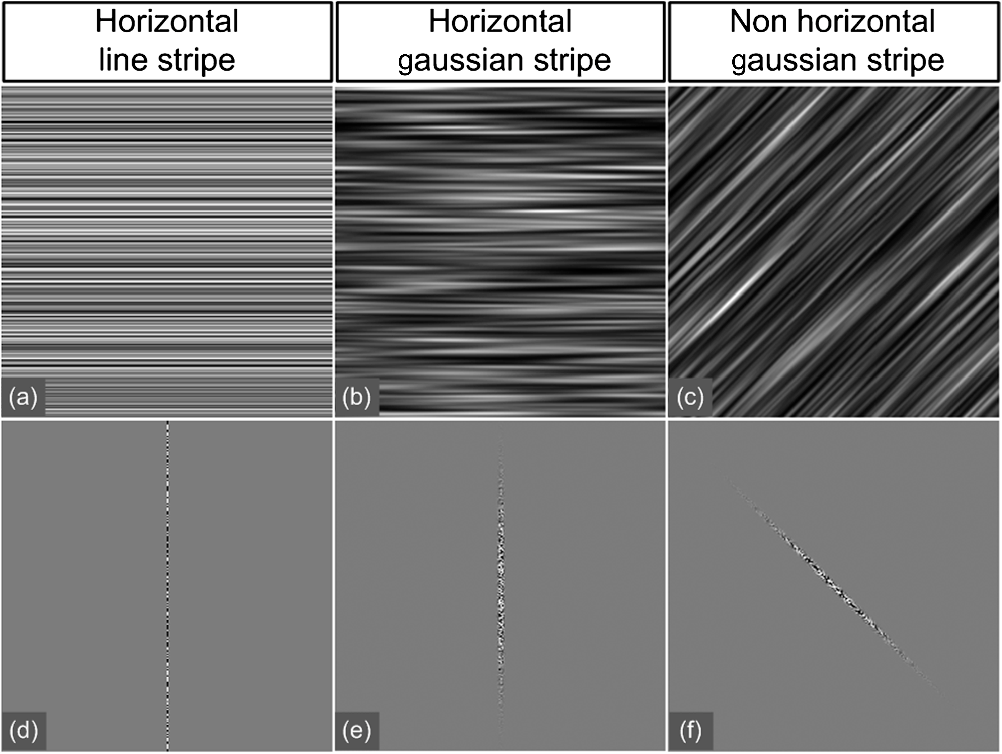 We name as the Fourier transform of the subimage . For stripes with a fixed direction in subimage , their Fourier coefficients are distributed mainly around the line in direction passing through in the Fourier domain. We suppress the stripes in the frequency domain by using the following equation: where is the standard deviation of the Gaussian function controlling the suppression degree of the FFT coefficients. The shape of is like a groove and the bottom is the line with angle passing through the origin point where the value of is 0. decreases from 1 to 0 when moving away from the line. The groove grows wider when increases, thus more frequency values will be suppressed. The parameter is selected manually according to the destriping performance.Since suppression is performed on subimages with different decomposition directions, the FFT filter is modified according to the decomposition direction . When is close to the stripe direction , the subimage contains most of the stripe information and is greatly suppressed. The modified frequency-domain weight function is given as where adjusts the suppression weight according to the deviation between and . represents an updated NSCT subimage in layer in the frequency domain. is set manually to 0.8 by visual assessment. The FFT filtering is done on all high-pass subimages in the NSCT. Then we use inverse FFT transform to get new subimages .Note that in unidirectional LSFM, is equal to 0 deg in MDSR, and the FFT filtering is performed once on the subimages. When dealing with multidirectional LSFM, FFT filtering is repeated several times according to the angle number of the stripes. Therefore, the repeat times of FFT filtering are adjusted to LSFM hardware. The multidirectional LSFM system used in this paper has three angles (0 deg, 15 deg, ). To remove these stripes, making use of the expected stripe angles for the multiangle configuration shown here, FFT filtering is repeated three times on the subimages using one angle during each iteration. 2.3.Nonsubsampled Contourlet Transform ReconstructionThe last step of the MDSR method is the reconstruction of the enhanced image with these updated subimages. All high-pass subband subimages experience FFT filtering and the stripe components are suppressed. NSCT can reconstruct the image with high- and low-pass subimages similar to the wavelet method. The NSCT reconstruction is performed on the updated subimages , then we get the final image. 3.Comparative ExperimentTo validate the MDSR method, we perform a comparative experiment on an image where we introduce artifacts in a controlled manner, by adding random horizontal lines as anisotropic Gaussian noise. Moreover, the stripes in multidirectional LSFM are simulated as an overlay of anisotropic Gaussian stripes with two fixed angles [shown in Fig. 5(d)]. We then compared our denoising approach with both VSNR18 and wavelet-FFT20 on these images. As shown in Figs. 5(m)–5(p), wavelet-FFT effectively reduces the horizontal lines or stripes, but it cannot remove the nonhorizontal noise since the wavelet is limited in decomposition directions. The VSNR method needs a preset structure noise model, thus we set its noise model the same as with the noise added to the original images. VSNR removes most of the stripe noise, but there are still light stripes remaining in the images. In contrast, MDSR performs well in all four situations, indicating that MDSR can effectively remove stripe noise. Fig. 5Comparative experiments of the three methods: (a–c) original image with horizontal line noise, anisotropic Gaussian noise at angle 0 deg and , (d) is 0 deg and mixed anisotropic Gaussian noise, (e–h) our results for (a–d), (i–l) the VSNR results for (a–d), and (m–p) the wavelet-FFT results for (a–d). Red arrows indicate some remaining stripes. 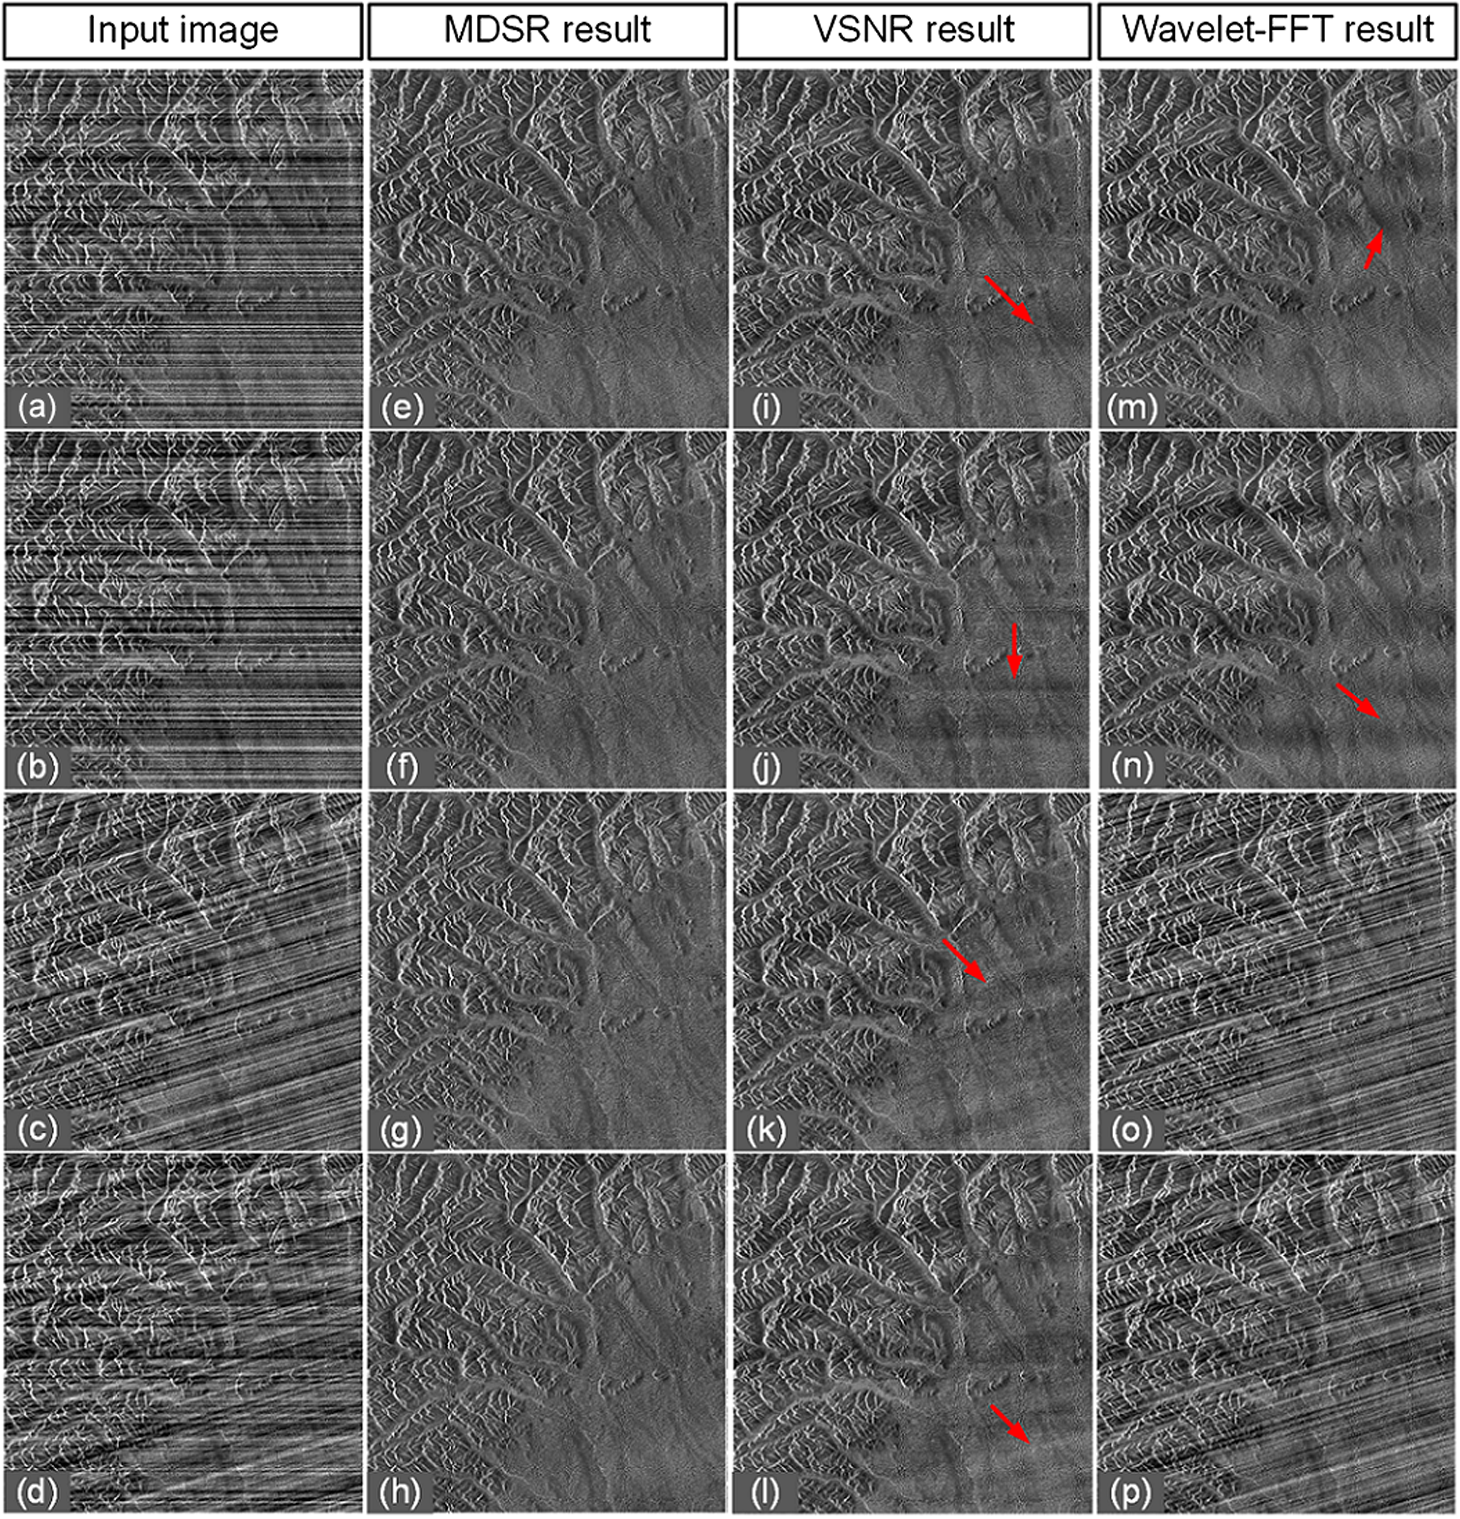 In addition to the visual contrast, peak signal-to-noise ratio (PSNR) is used for the quantitative evaluation of the three methods. PSNR is commonly used as a measure of image quality. It is computed with the equation below: where is maximum image gray value, is the real signal image without noises, and is the noise image. As shown in Fig. 6, the PSNR evaluation indicates that MDSR performs better than wavelet-FFT on the four input images and is similar to VSNR. MDSR increases the PSNR value by about 10 db. The experiment is done with 64-bit MATLAB®2013a, CPU 3.5 GHz, 8-GB memory. Test image size is . Average time cost for MDSR, wavelet-FFT, and VSNR is 3.70, 0.09, and 8.99s, respectively. The maximum number of iteration steps for VSNR is set as 100. Greater iteration steps using VSNR would give better results but at the cost of longer computing times. Note that the MDSR method takes more time than wavelet-FFT, but runs faster than the iterative method.4.ApplicationsIn this section, MDSR is validated in real LSFM images from both a custom-made unidirectional LSFM system and commercial multidirectional LSFM system. Four samples were imaged, including a mouse colon, two mouse brains, and a mouse heart. All of these samples were optically cleared by BABB (a solution of benzyl benzoate and benzyl alcohol at a rate of ).27,28 The mouse colon sample was stained with propidium iodide, as described previously.28 The vascular network of the mouse brain was immunolabeled with Alexa Flour488 (AF488) using the iDISCO method.29 All animals were purchased from the Department of Experimental Animals, Peking University Health Science Center. All animal experiments were performed in accordance with the guidelines of the Institutional Animal Care and Use Committee at Peking University. The research procedures were approved by the Key Laboratory of Molecular Imaging, Chinese Academy of Sciences (CAS). In the first experiment, a mouse colon sample is stained with propidium iodide and optically cleared with BABB.28 Figure 7 shows an LSFM image of the colon collected by a custom-made unidirectional LSFM (excitation laser 473 nm, emission light filter , exposure time 20 ms, and laser power about 100 mW). The description of the system are detailed in Refs. 28, 30, and 31. The results of MDSR, VSNR, and wavelet-FFT are shown in Figs. 7(b)–7(d). The VSNR fails to remove all the stripes and there are still light stripes remaining. Both MDSRs and wavelet-FFT reduce most of the visible stripes. Figure 8 shows the vertical line intensity profiles of the three results in Fig. 7. P1, P2, and P3 indicated by red arrows are points in three dark stripes at column 250. As shown in Figs. 8(a)–8(c), MDSR and wavelet-FFT methods improve the gray values of the three points notably, but VSNR fails to recover these points. Therefore, MDSR and wavelet-FFT perform better than VSNR in this experiment. Fig. 7Destriping results on a unidirectional LSFM image of the colon: (a) input LSFM image, (b) MDSR, (c) VSNR, and (d) wavelet-FFT results. 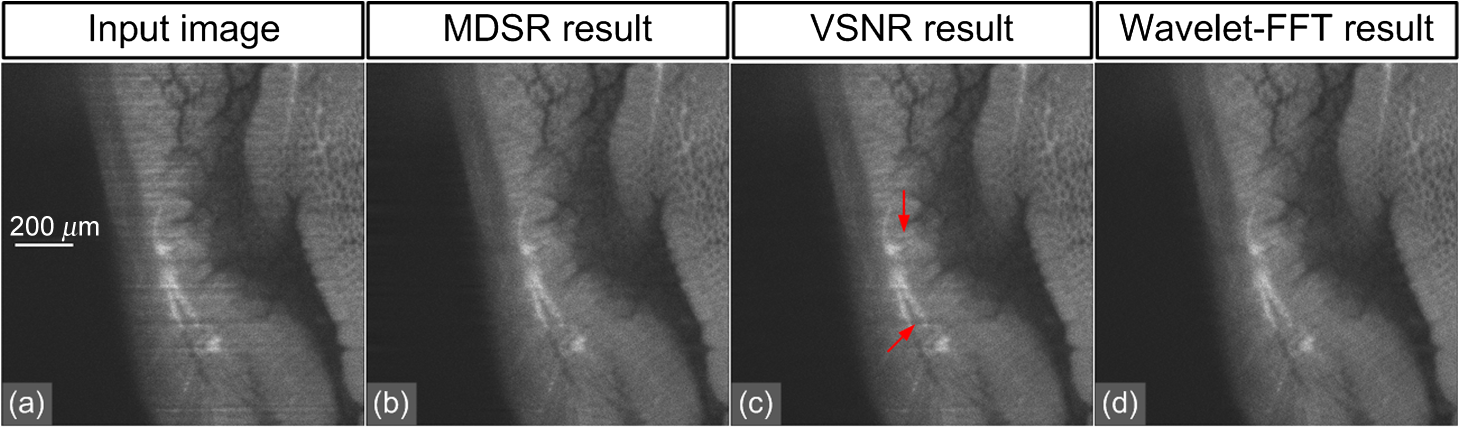 Fig. 8The vertical line intensity profiles of Fig. 7 at column 250 and from row 260 to 380. The scale of vertical axis is 103. Black curve and magenta curve are the line intensity profiles of original image and recovered images. (a–c) are the lines of MDSR, VSNR, and wavelet-FFT method, respectively, and (d) is the original LSFM image. The white line in (d) shows the sampling line. P1, P2, and P3 indicate three points at row 274, 313, and 359. 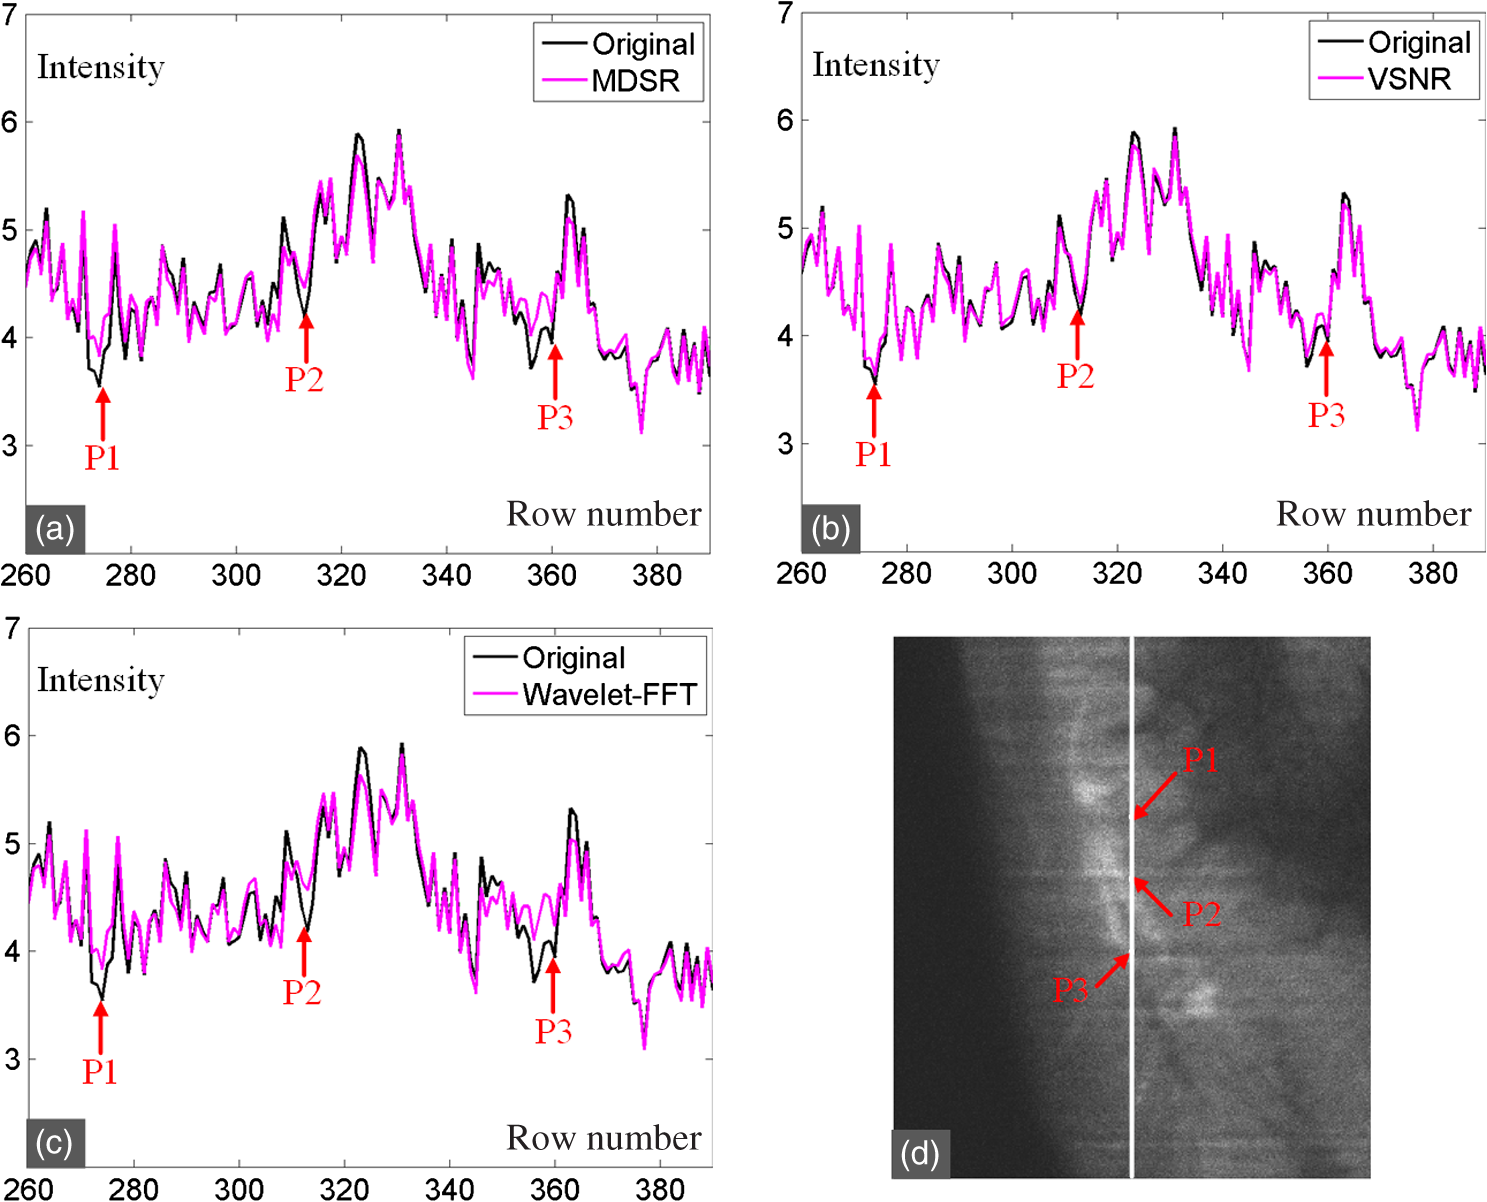 In the second experiment, a hemisphere of a 5-day old mouse was cleared with the iDISCO method29 and stained for fluorescent imaging. CD31 (Platelet endothelial cell adhesion molecule-1) was used as a marker for the brain vessels. Rat antimouse CD31 antibody (BD Biosciences, San Jose, California) and a secondary antibody donkey antirat IgG conjugated with Alexa Fluor 488 (Life Technologies, Carlsbad, California) were used for immunohistochemical staining. The sample was imaged with a commercial multidirectional system Ultramicroscope II made by Lavision Biotec (excitation light filter , emission light filter , exposure time 200 ms, and laser power about 100 mW). Figure 9(a) shows an image of the brain and Fig. 9(b) shows a zoomed area of the image. Although six light sheets were used in the commercial system, there are still evident stripe artifacts present in the LSFM image. As shown in Figs. 9(c) and 9(d), most of the visible stripes are removed by using MDSR. In contrast, as shown in Figs. 9(e) and 9(f), the VSNR method fails to remove all of the stripes, showing that MDSR performs better than VSNR when denoising multidirectional fluorescent LSFM images. Note that the wavelet-FFT method has not been tested on the multidirectional LSFM image since it is not suitable for nonhorizontal stripes. Fig. 9Destriping results on mouse brain vessel images: (a) input LSFM image, (b) zoomed image of (a), (c and d) results of MDSR, and (e and f) results of VSNR.  MDSR was also tested in images where autofluoresence was used as a source of contrast. Figure 10 shows autofluorescence images (excitation light filter , emission light filter , exposure time 360 ms, and laser power about 100 mW) of a mouse brain (a–j) and heart (c–l). These samples were not stained with any fluorescent dyes but were directly cleared with BABB. The images were collected by using the commercial multiangle system. As shown in Figs. 10(e)–10(f), MDSR effectively removes nearly all of the stripes and recovers the details of the brain. In contrast, there are still stripes remaining in the VSNR results, shown in Fig. 10(i) and 10(j). Moreover, as shown in Figs. 10(g), 10(h), 10(k), and 10(l), the contrast results for the mouse heart also demonstrate that MDSR can efficiently remove stripe artifacts. The average time cost of Figs. 9 and 10 is 171 s for MDSR and 522 s for VSNR with the same running environment as the one used in Fig. 5. 5.ConclusionThis paper proposes a destriping method based on NSCT for both unidirectional and multidirectional LSFM. The idea of our approach is to filter stripes in the frequency domain, and benefiting from NSCT’s multidirectional and multiscaling properties, to obtain an enhanced suppression of most stripes in LSFM images. Moreover, quantitative contrast experiments were performed with the VSNR and the wavelet-FFT methods, and the results showed that MDSR had a better performance both visually and quantitatively with the PSNR value. In addition, extensive validations were performed on MDSR including custom-made and commercial systems on unidirectional and multidirectional LSFM images. These experiments show that MDSR is robust in different situations. Furthermore, MDSR could also be used in other imaging modalities suffering from stripe artifacts such as in atomic force microscopy, scanning electron microscopy, remote sense images, or spectroradiometry. Even though MDSR showed a good suppression of stripe noise, we believe there is still room for improvement. For example, MDSR is time-consuming, which might represent a problem when dealing with large three-dimensional LSFM volumes. Another problem of MDSR is that it may introduce pseudo-Gibbs artifacts around singularities. These phenomena are quite common in transform domain-based methods.32,33 Although shift-invariance of NSCT mitigates this problem,23 the pseudo-Gibbs artifacts still appear. Future work will optimize the speed of the reconstruction algorithm making use of parallel computing and study pseudo-Gibbs artifacts free method. Moreover, the number of decomposition layers and directions are set manually to five and eight by visual guidance in MDSR. An automated method deciding these parameters should be studied in the future. AcknowledgmentsThis work was supported by the National Natural Science Foundation of China under Grant Nos. 81227901, 61231004, 81501616, 81301346, 81527805, and 81671851, the Instrument Developing Project (Nos. YZ201502 and YZ201457), the Strategic Priority Research Program (B) (No. XDB02060010) of the CAS, and Beijing Municipal Science and Technology Commission under Grant No. Z161100002616022. A. Arranz acknowledges support from the Marie Curie Intra-European Fellowship Program No. IEF-2010-275137. J.R. acknowledges support from EC FP7 CIG grant HIGH-THROUGHPUT TOMO, and the Spanish MINECO project Grant No. FIS2013-41802-R MESO-IMAGING. References
“Method of the year 2014,”
Nat. Methods, 12
(1), 1
(2015). http://dx.doi.org/10.1038/nmeth.3251 1548-7091 Google Scholar
H. U. Dodt et al.,
“Ultramicroscopy: three-dimensional visualization of neuronal networks in the whole mouse brain,”
Nat. Methods, 4
(4), 331
–336
(2007). http://dx.doi.org/10.1038/nmeth1036 1548-7091 Google Scholar
J. Huisken et al.,
“Optical sectioning deep inside live embryos by selective plane illumination microscopy,”
Science, 305
(5686), 1007
–1009
(2004). http://dx.doi.org/10.1126/science.1100035 SCIEAS 0036-8075 Google Scholar
J. Huisken and D. Y. Stainier,
“Even fluorescence excitation by multidirectional selective plane illumination microscopy (mSPIM),”
Opt. Lett., 32
(17), 2608
–2610
(2007). http://dx.doi.org/10.1364/OL.32.002608 OPLEDP 0146-9592 Google Scholar
B. C. Chen et al.,
“Lattice light-sheet microscopy: imaging molecules to embryos at high spatiotemporal resolution,”
Science, 346
(6208), 1257998
(2014). http://dx.doi.org/10.1126/science.1257998 SCIEAS 0036-8075 Google Scholar
M. B. Ahrens et al.,
“Whole-brain functional imaging at cellular resolution using light-sheet microscopy,”
Nat. Methods, 10
(5), 413
–420
(2013). http://dx.doi.org/10.1038/nmeth.2434 1548-7091 Google Scholar
X. Liang et al.,
“Brain vascular image enhancement based on gradient adjust with split Bregman,”
Proc. SPIE, 9711 97111D
(2016). http://dx.doi.org/10.1117/12.2211627 PSISDG 0277-786X Google Scholar
M. Dobosz et al.,
“Multispectral fluorescence ultramicroscopy: three-dimensional visualization and automatic quantification of tumor morphology, drug penetration, and antiangiogenic treatment response,”
Neoplasia, 16
(1), W1
–W7
(2014). http://dx.doi.org/10.1593/neo.131848 Google Scholar
S. Rühland et al.,
“Quantification of in vitro mesenchymal stem cell invasion into tumor spheroids using selective plane illumination microscopy,”
J. Biomed. Opt., 20
(4), 68
–72
(2015). http://dx.doi.org/10.1117/1.JBO.20.4.040501 JBOPFO 1083-3668 Google Scholar
E. Susaki et al.,
“Whole-brain imaging with single-cell resolution using chemical cocktails and computational analysis,”
Cell, 157
(3), 726
–739
(2014). http://dx.doi.org/10.1016/j.cell.2014.03.042 CELLB5 0092-8674 Google Scholar
K. Tainaka et al.,
“Whole-body imaging with single-cell resolution by tissue decolorization,”
Cell, 159
(4), 911
–924
(2014). http://dx.doi.org/10.1016/j.cell.2014.10.034 CELLB5 0092-8674 Google Scholar
K. Meng-Tsen, F. Satoshi and I. Takeshi,
“SeeDB: a simple and morphology-preserving optical clearing agent for neuronal circuit reconstruction,”
Nat. Neurosci., 16
(1), 74
–74
(2013). http://dx.doi.org/10.1038/nn.3447 NANEFN 1097-6256 Google Scholar
P. J. Keller et al.,
“Reconstruction of zebrafish early embryonic development by scanned light sheet microscopy,”
Science, 322
(5904), 1065
–1069
(2008). http://dx.doi.org/10.1126/science.1162493 SCIEAS 0036-8075 Google Scholar
P. Keller and M. Ahrens,
“Visualizing whole-brain activity and development at the single-cell level using light-sheet microscopy,”
Neuron, 85
(3), 462
–483
(2015). http://dx.doi.org/10.1016/j.neuron.2014.12.039 NERNET 0896-6273 Google Scholar
P. Rakwatin, W. Takeuchi and Y. Yasuoka,
“Stripe noise reduction in MODIS data by combining histogram matching with facet filter,”
IEEE Trans. Geosci. Remote Sens., 45
(6), 1844
–1856
(2007). http://dx.doi.org/10.1109/TGRS.2007.895841 IGRSD2 0196-2892 Google Scholar
F. L. Gadallah, F. Csillag and E. J. M. Smith,
“Destriping multisensor imagery with moment matching,”
Int. J. Remote Sens., 21
(12), 2505
–2511
(2000). http://dx.doi.org/10.1080/01431160050030592 IJSEDK 0143-1161 Google Scholar
H. Shen and L. Zhang,
“A MAP-based algorithm for destriping and inpainting of remotely sensed images,”
IEEE Trans. Geosci. Remote Sens., 47
(5), 1492
–1502
(2009). http://dx.doi.org/10.1109/TGRS.2008.2005780 IGRSD2 0196-2892 Google Scholar
J. Fehrenbach, P. Weiss and C. Lorenzo,
“Variational algorithms to remove stationary noise: applications to microscopy imaging,”
IEEE Trans. Image Process., 21
(10), 4420
–4430
(2012). http://dx.doi.org/10.1109/TIP.2012.2206037 IIPRE4 1057-7149 Google Scholar
C. Yi et al.,
“Robust destriping method with unidirectional total variation and framelet regularization,”
Opt. Express, 21
(20), 23307
–23323
(2013). http://dx.doi.org/10.1364/OE.21.023307 OPEXFF 1094-4087 Google Scholar
B. Münch et al.,
“Stripe and ring artifact removal with combined wavelet—Fourier filtering,”
Opt. Express, 17
(10), 8567
–8591
(2009). http://dx.doi.org/10.1364/OE.17.008567 OPEXFF 1094-4087 Google Scholar
D. Dong et al.,
“Vertically scanned laser sheet microscopy,”
J. Biomed. Opt., 19
(10), 106001
(2014). http://dx.doi.org/10.1117/1.JBO.19.10.106001 JBOPFO 1083-3668 Google Scholar
H. Jan and D. Y. R. Stainier,
“Even fluorescence excitation by multidirectional selective plane illumination microscopy (mSPIM),”
Opt. Lett., 32
(17), 2608
(2007). http://dx.doi.org/10.1364/OL.32.002608 OPLEDP 0146-9592 Google Scholar
A. L. D. Cunha, J. Zhou and M. N. Do,
“The nonsubsampled contourlet transform: theory, design, and applications,”
in IEEE Transactions on Image Processing a Publication of the IEEE Signal Processing Society,
15
(2006). http://dx.doi.org/10.1109/TIP.2006.877507 Google Scholar
J. Zhou, A. L. Cunha and M. N. Do,
“Nonsubsampled contourlet transform: construction and application in enhancement,”
in IEEE Int. Conf. on Image Processing,
469
–472
(2005). http://dx.doi.org/10.1109/ICIP.2005.1529789 Google Scholar
M. N. Do,
“Nonsubsampled contourlet toolbox,”
(2006) http://minhdo.ece.illinois.edu/software/ Google Scholar
Z. Wang and Y. Fu,
“Frequency-domain regularized deconvolution for images with stripe noise,”
in Fourth Int. Conf. on Image and Graphics (ICIG 2007),
110
–115
(2007). Google Scholar
S. James et al.,
“Optical projection tomography as a tool for 3D microscopy and gene expression studies,”
Science, 296
(5567), 541
–545
(2002). http://dx.doi.org/10.1126/science.1068206 SCIEAS 0036-8075 Google Scholar
A. Alicia et al.,
“Helical optical projection tomography,”
Opt. Express, 21
(22), 25912
–25925
(2013). http://dx.doi.org/10.1364/OE.21.025912 OPEXFF 1094-4087 Google Scholar
N. Renier et al.,
“iDISCO: a simple, rapid method to immunolabel large tissue samples for volume imaging,”
Cell, 159
(4), 896
–910
(2014). http://dx.doi.org/10.1016/j.cell.2014.10.010 CELLB5 0092-8674 Google Scholar
A. Arranz et al.,
“In-vivo optical tomography of small scattering specimens: time-lapse 3D imaging of the head eversion process in Drosophila melanogaster,”
Sci. Rep., 4 7325
(2014). http://dx.doi.org/10.1038/srep07325 SRCEC3 2045-2322 Google Scholar
M. Fang et al.,
“Polarization-sensitive optical projection tomography for muscle fiber imaging,”
Sci. Rep., 6 19241
(2016). http://dx.doi.org/10.1038/srep19241 SRCEC3 2045-2322 Google Scholar
D. Yin and I. W. Selesnick,
“Artifact-free wavelet denoising: non-convex sparse regularization, convex optimization,”
IEEE Signal Process. Lett., 22
(9), 1364
–1368
(2015). http://dx.doi.org/10.1109/LSP.2015.2406314 IESPEJ 1070-9908 Google Scholar
T. Xiang, Y. Li and G. Rongrong,
“A fusion algorithm for infrared and visible images based on adaptive dual-channel unit-linking PCNN in NSCT domain,”
Infrared Phys. Technol., 69 53
–61
(2015). http://dx.doi.org/10.1016/j.infrared.2015.01.002 IPTEEY 1350-4495 Google Scholar
BiographyXiao Liang received his BE degree from the Institute of Automation, Chinese Academy of Sciences (CAS), Beijing, in 2013. He received his BE degree from Wuhan University in 2013. He is an assistant engineer at the Institute of Automation, CAS. His research interests are mainly focused on optical imaging. Yali Zang received her PhD from the University of CAS in 2013 and received her bachelor’s degree from Xi’an Jiaotong University in 2008. She is an assistant researcher at the Institute of Automation, CAS. Her research interests include medical image processing, biometrics, and radiomics. Di Dong received his BS degree in automation from the University of Science and Technology, Beijing, in 2008, and his PhD in pattern recognition and intelligent systems from the Institute of Automation, CAS, in 2013. He is an associate professor at the Institute of Automation, CAS. His current research interests include selective plane illumination microscopy, optical projection tomography, and radiomics. Liwen Zhang received his BE degree from the Inner Mongolia University of Technology in 2013. He is a master’s student at the Institute of Automation, CAS, Beijing. His research interests are mainly focused on medical image processing, pattern recognition, and radiomics. Mengjie Fang received his BE degree from Huazhong University of Science and Technology in 2015. He is a master’s student at the Institute of Automation, CAS, Beijing. His research interests are mainly focused on medical image processing, pattern recognition, and radiomics. Xin Yang received her PhD from Tianjin University in 2000. She is a professor at the Key Laboratory of Molecular Imaging, Institute of Automation, CAS. Her research interests are medical image processing and analysis, pattern recognition. She has published more than 50 papers in academic journals and international conferences. She is an IEEE member. Alicia Arranz obtained her PhD in biology from the Universidad Complutense de Madrid, UCM, Spain in 2008, and has worked in different prestigious international institutions such as University of California, Los Angeles, Tufts University in Boston and Swiss Federal Institute of Technology in Zurich. She recently joined the Center for Molecular Biology “Severo Ochoa” CBMSO. Her current interests lie in developing new methodologies for imaging inflammation and immune responses. Jorge Ripoll obtained his PhD in physics from the Universidad Autónoma de Madrid, UAM, Spain in 2000. He obtained tenure track positions in Foundation for Research and Technology-Hellas FORTH, from 2005 to 2012, where he led a research group for more than 7 years. Since September 2012, he has been with the Department of Bioengineering of the Universidad Carlos III de Madrid, Spain. His current interests lie in the development of in vivo optical tomography approaches. Hui Hui received his MSc from Chang’an University, China, in 2006 and his PhD from the University of Franche-Comté, France, in 2013. He is currently an assistant professor at the Key Laboratory of Molecular Imaging, Institute of Automation, CAS. His research focuses on developing of microscopic imaging techniques and their applications. Jie Tian received his PhD degree in artificial intelligence from the Institute of Automation, CAS, Beijing, China, in 1992. From 1995 to 1996, he was a postdoctoral fellow with the Medical Image Processing Group, University of Pennsylvania, Philadelphia. Since 1997, he has been a professor at the Intelligent Medical Research Center, Institute of Automation. His current research interests include medical image process and molecular imaging. |