
|
|
1.IntroductionDuring normal development, the heart transforms from a linear tube into a complex four-chambered pump. Under pathological conditions, the process of cardiogenesis is altered, resulting in structural abnormalities at birth in the form of congenital heart defects (CHDs). In the United States, CHDs occur in of newborns with many requiring surgical intervention.1 The etiology of heart defects is multifactorial, often as a result of a complex interplay between individual genetic predispositions and environmental stimuli. Blood flow has been identified as a critical factor governing heart development by providing mechanical stimuli to cardiac tissues that induce changes in genetic developmental programs and cellular responses.2–6 In animal models, altered blood flow has been shown to induce CHDs similar to those observed in humans.7–9 Although it is well established that hemodynamic forces are important modulators of cardiovascular development, the transduction of these signals and the mechanisms by which they induce abnormal remodeling of the developing heart are poorly understood. The optical properties of early embryonic tissues make them excellent candidates for study using light microscopy. Specifically, the tubular embryonic heart is translucent, allowing observation of blood moving through the heart. Over the cardiac cycle, the heart expands and contracts, increasing and decreasing its blood volume. Red blood cells and plasma absorb a fraction of incident light thereby decreasing the light intensity transmitted to the microscope.10 Thus, grayscale images of the embryonic heart lumen show reduced intensity values (relative to other tissues and albumen) in proportion to the thickness of blood within the lumen at the moment an image is captured. This feature allows for detailed visualization and analysis of the beating heart motion. We present here a methodology that exploits the optical properties of the embryonic heart to identify cardiac pumping characteristics. The method is based on video densitometry, which was developed by radiologists and cardiologists to track the relative intensity of tissues and blood.11–14 A similar optical technique, based on hemoglobin contrast angiography, has been used to study the biomechanics of the developing Xenopus tropicalis embryonic heart.15 During embryonic development, the diameter of the tubular heart varies over the cardiac cycle as the lumen expands and contracts to accommodate changing blood volumes. The expansion is characterized by both increasing cardiac dimensions and decreasing lumen image intensity (and vice-versa during contraction). From optical videos, we used grayscale intensity to track the relative thickness of blood and analyze cardiac motion over the cardiac cycle and at different positions along the heart. Using this optical microscopy technique, we have mapped the cardiac wall motion of the developing chicken heart at an early developmental stage (Hamburger-Hamilton stage 18 or HH18). At HH18, the heart is an “S”-shaped tube and composed of an atrium, a ventricle, and an outflow tract (OFT) connected in series.16 The embryonic chicken is an ideal model to study cardiovascular development due to its short developmental period (21 days to hatching), and ease of access for microsurgical modification and in vivo imaging. The highly conserved heart development processes are shared by vertebrate species, which makes studies in chicken embryos relevant in the study of human CHD. Further, we used a well-established microsurgical intervention, outflow tract banding (OTB, also referred to as “banding”), to increase blood pressure within the embryonic heart and increased blood flow velocities and wall shear stress in the heart OFT. During banding, a suture was tied around the OFT and tightened to reduce its cross-sectional area and restrict motion of the OFT wall at the banding site,17–21 and it has been shown that banding results in a spectrum of CHDs in the developing chick.4,5,18,21,22 By analyzing cardiac motion under banding conditions, we illustrate the sensitivity of our method to changes in cardiac mechanics induced by altered blood flow conditions. Understanding how biomechanical stimuli are altered in the embryonic heart as a result of hemodynamic interventions is critical in elucidating the mechanisms underlying abnormal cardiac remodeling. 2.MethodsIn this study, we acquired optical videos of the HH18 embryonic heart, spanning approximately three to four cardiac cycles at physiological temperature (37.5°C). We then quantified cardiac tissue dynamics via measurements of time-dependent changes in the heart centerline intensity at three positions in both the ventricle and OFT. This characterization of ventricle and OFT wall motion, using a simple optical imaging modality, is essential in understanding the role of cardiac biomechanics in normal and abnormal cardiogenesis, while accessible to any research group. 2.1.Preparation of EmbryosFertilized White Leghorn chicken eggs were incubated blunt end up at 37.5°C and 80% humidity until HH18 ( days).16 A small portion of the blunt-end shell and the inner shell membrane (ISM) were carefully removed directly over the embryo, exposing the beating heart. Embryos that bled upon ISM removal, exhibited obvious structural defects, or were not at the proper developmental stage were discarded. Those meeting the selection criteria were subjected to one of two interventions: (1) OTB, in which a 10-0 nylon suture was tied around the OFT-ventricle junction to constrict the lumen cross-sectional area (note that this band placement differs from that of our previous work and has been chosen here for ease in the optical analyses); and (2) a control, sham-operated procedure in which the suture was passed under the OFT and removed. Following microsurgical modification, the eggs were sealed with saran wrap and incubated for an additional 2 h to return to normal physiological temperature before videographic data acquisition. To determine band tightness and the hemodynamic effect of banding, OTB embryos were imaged with optical coherence tomography (OCT) immediately before and 2 h after banding (as detailed in Midgett et al.17), and band tightness was calculated as where is the external OFT diameter after banding (at the band location) and is the diameter at the same location before banding.To reduce variations in hemodynamic parameters, only OTB embryos with bands placed at the OFT-ventricle junction with constrictions ranging from 35% to 45% were used for analysis. 2.2.Stereoscopic ImagingAt stage HH18, the developing heart consists of distinguishable anatomic and functional segments: an atrium, atrioventricular canal, ventricle, and OFT. Due to the positioning and s-looping of the heart at this stage, only certain parts of the heart can be visualized in ovo with optical techniques without disturbing the embryo: the atrium rests out-of-plane, dorsal to the ventricle, but large portions of the ventricle and OFT are visible in optical images. This embryonic heart configuration, however, allows simultaneous tracking of OFT and ventricle wall motion [see Fig. 1(a)]. Fig. 1Pipeline of intensity data analysis. (a) Representative imaging frame showing each heart segment visible in the imaging plane at HH18. (b) Lines used for analysis. The centerline (blue) was calculated from traces of the myocardial walls (red), as the midline between the walls. White dashed lines show the lines along which M-mode images were extracted from the ventricle (V1, V2, and V3) and the OFT (O1, O2, and O3). (c) The OFT or ventricle cross-section perpendicular to the centerline at the point of interest (inlet, medial, or outlet) was identified. (d) An M-mode was extracted from the optical data set along a line perpendicular to the centerline at the point of interest and the pixel intensities inverted. (e) Intensity data were extracted from the M-mode centerline (corresponding to the heart centerline) at each measurement location.  To capture the dynamic wall motion of the rapidly beating () embryonic heart, we acquired two-dimensional (2-D) video image sequences at a rate of 140 frames per second over 200 frames (3 to 4 cardiac cycles) using a PCO Edge 5.5 camera through a lens mounted on a Leica M250 stereomicroscope at magnification. Throughout imaging, the temperature of the embryo was maintained near the physiological norm (37.5°C) using a custom-made warming chamber to preserve temperature-dependent heart function (; ).23,24 Data from this study (not shown) and previous studies show that banding does not affect the period of the cardiac cycle.19 2.3.Intensity Measurement and Data ProcessingAfter optical video image acquisition, M-mode images were generated using a custom MATLAB® program (The MathWorks, Inc. Natick, Massachusetts, see Fig. 1 for a schematic of the procedure). M-mode images are 2-D graphs that depict cardiac wall motion from a line intersecting the heart in the video, by displaying grayscale pixels along the selected line in the vertical direction versus time (or frame number) in the horizontal direction [see Figs. 1(c) and 1(d)]. To visualize and analyze tubular heart motion, M-mode data were extracted from lines perpendicular to the heart centerline [see Figs. 1(b)–1(d)] such that M-mode images clearly showed changes in the tubular heart diameter over time at specific locations. We selected three equally spaced M-mode lines across both the ventricle and the OFT [see Fig. 1(b)]. Lines were selected according to several criteria that maximized reproducibility and minimized background noise: (1) lines closer to the ventricular inlet [V1, see Fig. 1(b)] were chosen at the point at which the lumen diameter sharply increased. Similarly, lines closer to the OFT outlet [O3, see Fig. 1(b)] were chosen near the point at which the lumen diameter sharply decreased. (2) The line closer to the inlet of the OFT [O1, see Fig. 1(b)] was chosen just downstream of the band and far enough from the ventricle to avoid signal interference from ventricular motion. An equivalent location was chosen in sham embryos. (3) The line closer to the ventricular outlet [V3, see Fig. 1(b)] was chosen just upstream from the OFT inlet, before the endocardial cushions. (4) In each segment (ventricle and OFT), the position of the middle line (V2 and O2) was selected at the center of the segment, halfway between inlet and outlet positions. After generating M-mode images at each location, we extracted pixel intensity data corresponding to the heart certerline [see Fig. 1(e)]. The periodicity of the cardiac cycle (luminal expansion/contraction) enables localization of the lumen center point (the intersection of the centerline and the M-mode line). The M-mode center point was identified as the halfway position between the opposing heart walls during maximum cardiac contraction at each location in the OFT and ventricle. These center points form the heart centerline. To minimize the effect of noise, we extracted average intensity values from 5 to 10 pixels surrounding the centerpoint. To create a direct correlation between pixel intensity and blood thickness, the intensity was inverted so that cardiac expansion and contraction corresponded with increased and decreased image intensity, respectively [Fig. 1(e)]. Then, inverse pixel intensities from the lumen centerline were extracted and plotted against time (200 time points). Nonparametric smoothing (Loess) was then applied to extract major cardiac motion features of intensity plots throughout the cardiac cycle. This allowed for simultaneous tracking of the motion of the heart wall in the ventricle and OFT portions of the developing heart. 2.4.Analysis of Centerline Intensity DataTo simplify further analysis, centerline intensity data plots were fitted to harmonic functions. To this end, the cardiac frequency and period of the cardiac cycle were quantified from intensity data using Fourier analysis. Then the data were fitted to harmonic functions of the form where is the cardiac frequency, , and are the amplitudes of each contributing harmonic (up to three in our analysis), and , and are the phase shifts of each contributing harmonic. The values of the amplitudes and phase shifts were found by minimizing the difference between and the intensity data using the curve fitting toolkit in MATLAB®.Time derivatives of centerline intensity plots were used to further analyze the motion of the developing heart. To avoid noise amplification from intensity data, the derivatives were found by differentiating the fitted harmonic functions, Time derivative plots of centerline intensity allowed easy identification of the time at which intensity maxima and minima [] occurred.To facilitate data comparison and avoid intensity bias, we normalized the intensity plots (0-1) for each location. Also, time in [Eq. (2)] was normalized to the cardiac period () to account for naturally occurring biological variations in heart rate. Further, we synchronized centerline intensity plots such that the beginning of the cardiac period, was coincident with the initiation of ventricular expansion at the inlet position (V1). To characterize cardiac motion within a group of embryos (, ), the average and standard deviation of the time-normalized intensity curves was calculated and plotted for each location. Additionally, the proportion of the cardiac cycle spent in the expansion phase was calculated as time-lapse between minimum and maximum intensities, while the contraction phase was defined as the time between maximum intensity and the subsequent minimum intensity. Expansion and contraction were expressed as proportions of the cardiac period. 2.5.Validation of the Centerline Intensity MethodAt early developmental stages, and given the tubular nature of the heart, cardiac motion in the depth direction (perpendicular to the imaging plane) approximates in-plane motion. This is because the heart myocardium expands and contracts approximately uniformly in the tubular heart radial direction.20 Thus, we expected that changes in diameter in the depth direction, measured from the heart centerline intensity, would approximate changes in diameter in the imaging plane. To determine how closely smoothed inverse-intensity curves depict opening and closing of the cardiac lumen, the lumen diameter from the M-mode images was manually extracted over several cardiac cycles using a custom MATLAB® program. We then compared normalized intensity and normalized diameter data for validation using linear regression analysis. An identical analysis was performed for -derived intensities and heart wall diameters (Fig. 2). Fig. 2Comparison of centerline intensity and myocardial diameter over the cardiac cycle. Centerline intensity and myocardial diameters were obtained from the same M-mode images along lines in the (a) medial ventricle (V2) and (b) medial OFT (O2). (c, d) Correlation between normalized diameter and normalized intensity for the cases shown in (a) and (b), respectively. In (c) and (d), the line shows the idealized 1:1 correspondence.  2.6.Dimensional MeasurementsA hemodynamic consequence of banding is an increased end diastolic and end systolic blood pressure in the ventricle and systemic circulation.18,19 To further characterize the consequences of increased load on the developing heart, we measured maximum and minimum myocardial diameter in the ventricle and OFT. Because, in some cases, the myocardial walls were difficult to visualize in M-mode images, myocardial diameters were measured directly from optical image frames in ImageJ (NIH). To measure ventricular and OFT diameters, a line was drawn perpendicular to the heart centerline at the V2 and O2 positions [see Fig. 1(b)], and maximum and minimum diameters were measured for three cardiac cycles. In addition, the end diastolic (maximum) and end systolic (minimum) ventricle areas in the imaging plane were computed from optical images as described in Keller et al.25 Briefly, the in-plane ventricle perimeter from image frames was traced manually in ImageJ and the area of the enclosed region computed. These data describe changes in cardiac dimensions after banding. 3.ResultsWe used the proposed centerline intensity method to determine embryonic cardiac motion in control and hemodynamically intervened chicken embryos. Specifically, we demonstrate that: (1) changes in heart centerline intensity can be used to track wall motion over the cardiac cycle. (2) OFT wall motion is altered dramatically with banding. (3) Ventricular wall motion is largely conserved with banding. 3.1.Validation of the Centerline Intensity MethodTo validate the use of centerline pixel intensities to approximate heart wall motion, manually extracted normalized heart wall diameters were plotted against normalized centerline intensity data over multiple cardiac cycles [Figs. 2(a) and 2(b)]. Linear regression analysis demonstrated a near 1:1 correspondence between intensity and diameter data, with slopes of 0.98 and 1.05 for the ventricle and OFT, respectively, and for both cases [Figs. 2(c) and 2(d)]. This close agreement between normalized intensity and diameter measurements establishes the use of the centerline intensity as a valid method to study cardiac motion along the tubular heart. Additionally, we sought to determine whether the fitted harmonic functions, , could be used with confidence in approximating cardiac wall diameter over the cardiac cycle. We found that normalized diameter data and normalized -derived data are highly correlated ( in both the ventricle and OFT) with near 1:1 correspondence (slope = 0.95 and 0.96 in the ventricle and OFT, respectively). Therefore, accurately describes the expansion and contraction profile of the developing heart over the cardiac cycle, validating its use in further analysis. Because results were reproducible over multiple cardiac cycles, further data are shown for one cardiac cycle for simplicity. 3.2.Characterizing Wall Motion in the OFT and VentricleVisual inspection of optical videos (see Figs. 3 and 4) revealed obvious differences in the motion of the ventricle and OFT walls. In the sham control heart, ventricular expansion appeared uniform and the rate of expansion increased dramatically as the atrium contracted. A seemingly uniform ventricular contraction then ejected blood into the OFT, which expanded the OFT walls proximally to distally. The OFT walls then contracted, closing the lumen in the same proximal-to-distal manner. Over the cardiac cycle, this pattern emerged seamlessly and unimpeded (see Fig. 3). Fig. 3Beating heart of a control chicken embryo at HH18 as captured by optical imaging. The video shows blood flowing through the ventricle and OFT and motion of cardiac walls. (Video 1, MP4, 1564 KB) [URL: http://dx.doi.org/10.1117/1.JBO.21.11.116003.1]. 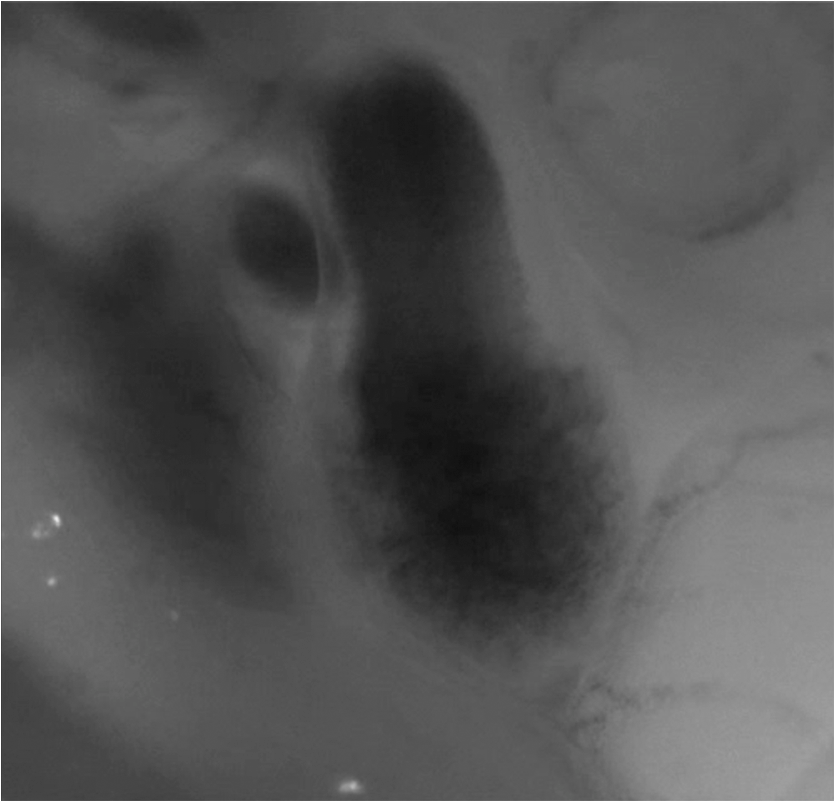 Fig. 4Beating heart of a banded chicken embryo at HH18 as captured by optical imaging. The video clearly shows the surgical suture that banded the heart OFT, as well as blood flowing through the ventricle and OFT. (Video 2, MP4, 1562 KB) [URL: http://dx.doi.org/10.1117/1.JBO.21.11.116003.2].  A similar pattern emerged in the banded embryo, but with distinct differences. Immediately prior to and at the beginning of ventricular contraction, blood flow was impeded at the banding site, creating a buildup of blood upstream of the band. After a short delay following the onset of ventricular contraction, blood was pushed past the banding site. While ventricular contraction and expansion seemed uniform, in the OFT the proximal-to-distal expansion and contraction pattern became less distinct, i.e., the OFT appeared to expand and contract in a more synchronous manner with banding (see Fig. 4). In order to quantify these visually observed changes in heart wall motion, we analyzed centerline intensity data from control and banded hearts. Intensity traces in the sham control ventricle were nearly indistinguishable at each location [V1, V2, and V3, see Fig. 5(a)]. Between locations, the normalized time intensity maxima and minima differed by no more than one percent of the cardiac cycle, suggesting synchronous expansion and contraction of ventricular walls. As expected, this pattern of synchronous expansion and contraction was approximately conserved with banding [see Fig. 5(b)]. Intensity traces along the OFT centerline (O1, O2, and O3) in the sham control embryo showed similar expansion and contraction patterns, but with a clear proximal-to-distal phase lag among traces [see Fig. 5(c)]. In the OTB embryos, conversely, intensity traces had a much smaller phase lag, so that traces were almost synchronous [see Fig. 5(d)]. Fig. 5Intensity traces obtained from a sham and an OTB HH18 embryonic heart over the cardiac cycle. Intensity traces depict fitted intensity functions, , for three selected centerline points corresponding to the V1, V2, and V3 (see Fig. 1) positions in the (a) sham and (b) OTB ventricle. Likewise, fitted intensity functions, for three selected centerline points corresponding to the O1, O2, and O3 positions in the (c) sham and (d) OTB OFT are shown. Note that for this particular OTB embryo the OFT traces depict an almost synchronous motion; while peristaltic-like motion in the OFT is faster after banding, not all embryos exhibit an almost synchronous behavior (as can be inferred from aggregate data, Fig. 6). , time; , cardiac period; , normalized cardiac cycle. 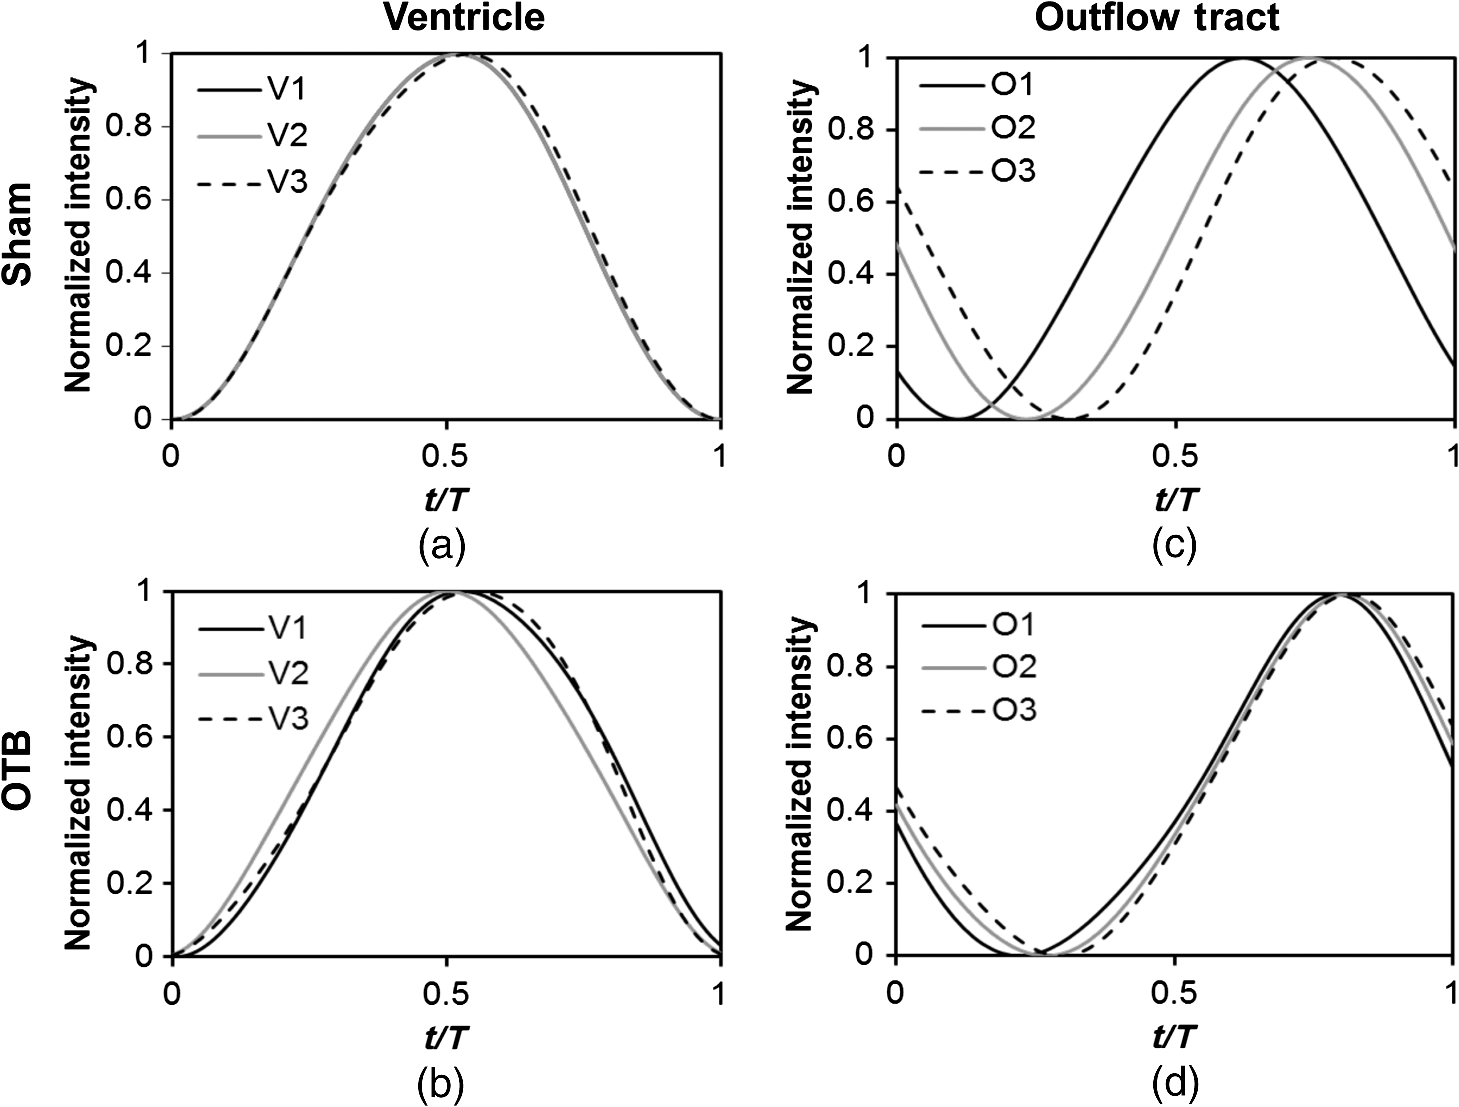 We next compared centerline intensity traces among embryos in each group to analyze variations in wall motion of the sham control and banded HH18 hearts. Only one average aggregate ventricle trace per embryo was considered due to the synchronous behavior of the ventricle at this early developmental stage, whereas the three OFT traces from each embryo were considered for analysis. Average and standard deviations were calculated at each normalized time point, and plotted as bands around the averaged data (see Fig. 6). Overall, the intensity profiles demonstrate a remarkable conservation of wall motion in both the control and banded groups, suggesting the motion of the heart wall varies little between embryos in each group; however, greater variation within the banded group was observed, compared to controls. Fig. 6Aggregate cardiac intensity traces from sham and banded embryos. (a and c) Representative video frames of peak expansion in the ventricle at the V2 position (VEN) and each successive location in the OFT (O1, O2, O3). For a (a) sham control embryo; (c) banded (OTB) embryo. (b and d) Average traces (solid black lines) (dashed lines) for the ventricle (VEN) and each selected location in the OFT (O1, O2, O3). Averages were calculated across all embryos ( sham control embryos; banded embryos). For (b) sham control embryos and (d) banded embryos. . , time; , cardiac period; , normalized cardiac cycle. 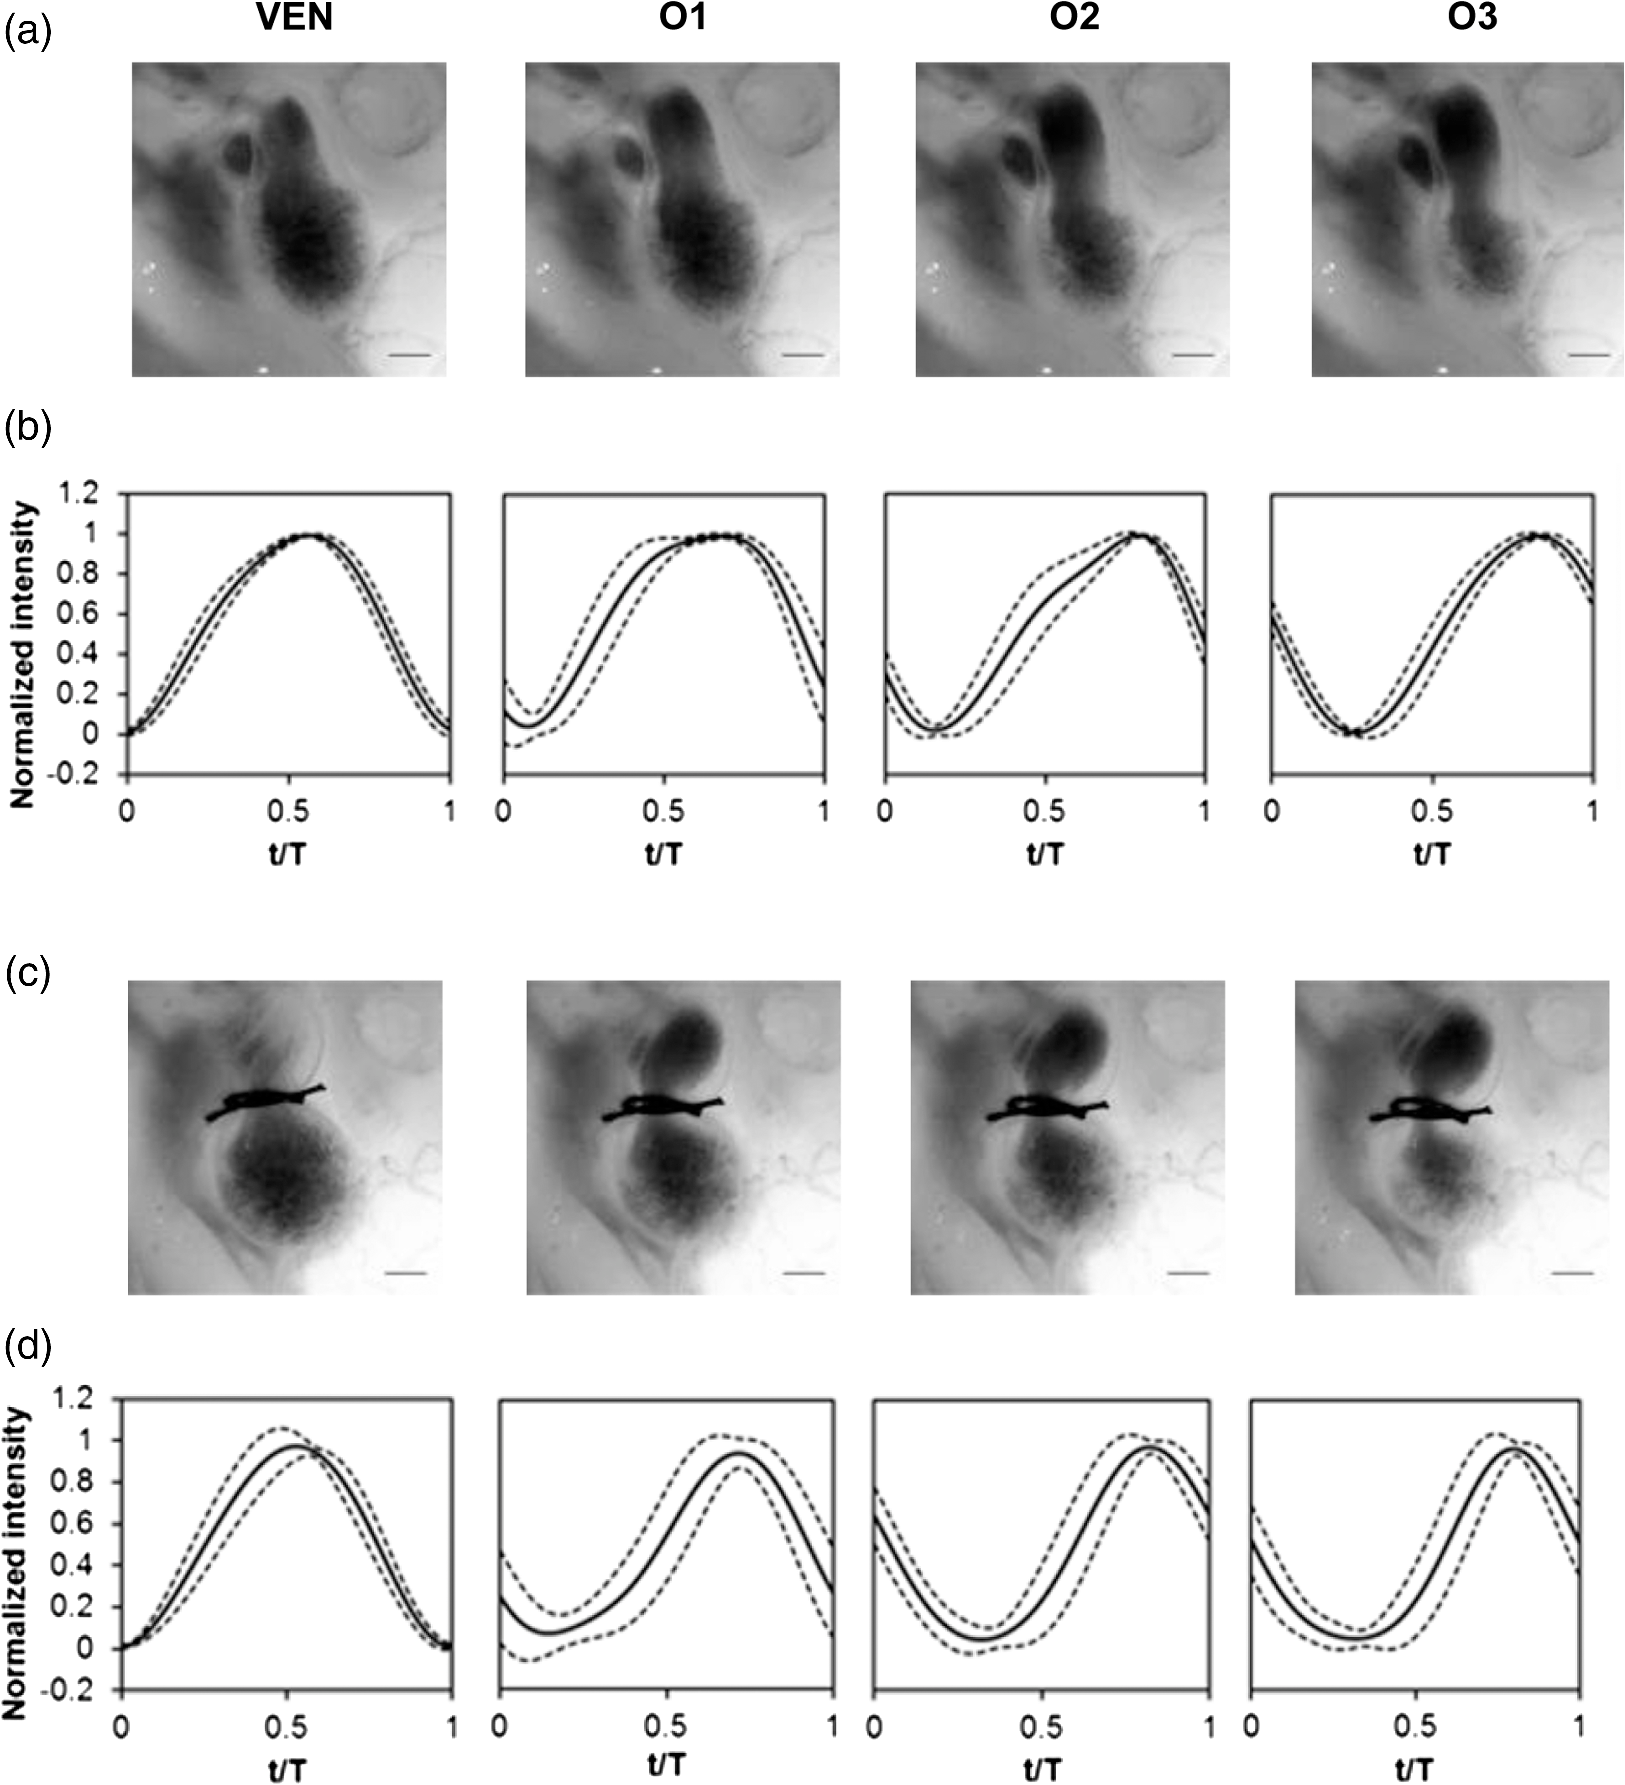 To quantify the motion phase lag between different positions along the heart, the time span between points of maximum expansion or maximum contraction among ventricular and OFT intensity curves (VEN, O1, O2, and O3) was calculated. In the sham controls, the phase lag between peak ventricle expansion and each successive location in the OFT increased, as expected due to the peristaltic-like motion of the OFT [Figs. 7(a) and 7(b)]. Our results suggest that wave propagation speed, however, increases in the distal OFT. In the banded group, the phase lags between peak expansion of the ventricle and OFT inlet (O1) were significantly increased, as compared to controls, due to the described delay of flow at the banding site. Even though there was a delayed expansion at the OFT inlet with respect to the ventricle and, in comparison to controls, the outlet (O3) reached peak expansion at the same time point as the normal OFT outlet [Fig. 7(a)], demonstrating the increased wave propagation speed distal to the band. The patterns of maximum contraction were somewhat similar, except that full (maximum) contraction occurs later in banded embryos as compared to controls [see Figs. 7(c) and 7(d)]. Therefore, the band not only affects hemodynamic parameters within the OFT11,17 but also the patterns of wall motion over the length of the OFT. Fig. 7Comparison of the OFT and ventricle myocardial motion at maximum expansion and contraction in the sham control and banded HH18 embryo. Normalized time () to reach (a) maximum expansion (inverse-intensity) and (c) minimum inverse-intensity, corresponding to peak and minimum myocardial diameter, along the tubular HH18 heart Normalized time values greater than 1 in (c) indicate that peak contraction in the OFT occurs after peak contraction in the ventricle. Region-specific phase lags between points of (b) peak and (d) minimum inverse-intensity. Data are shown as mean ± SEM. -values obtained from Student’s -tests of less than 0.05 were considered statistically significant and are denoted by asterisks. , time; , cardiac period; , normalized cardiac cycle.  3.3.Characterizing Expansion and Contraction in the Ventricle and OFTTo further characterize the dynamic motion of the developing heart, we measured the proportion of the cardiac cycle spent in the contraction and expansion phases in the ventricle and at each location in the OFT. At each location measured, sham control embryos demonstrated roughly equal proportions of the cardiac cycle spent in the contraction and expansion phases. Further, no significant changes were observed between the sham and OTB groups in the ventricle and OFT inlet (O1). However, proportion of the cardiac cycle spent in the expansion phase increased in the medial and downstream portions of the OFT (O2 and O3) in banded hearts compared to controls, while the time spent in the contraction phase in banded hearts obviously decreased (Fig. 8). Fig. 8Portion of the cardiac cycle spent in (a) the contraction and (b) expansion phases in the sham control and banded developing heart. Time in contraction was calculated as the time difference between minimum intensity and following peak intensity and time in expansion was calculated as the time difference between peak intensity and following minimum intensity. Data are shown as ; -values obtained from Student’s -tests of less than 0.05 were considered statistically significant and are denoted by asterisks. , time; , cardiac period; , normalized cardiac cycle.  We measured ventricular and OFT dimensions to determine possible dimensional changes after banding. End diastolic (maximum) and end systolic (minimum) ventricular diameters did not show significant changes with banding, and thus control and banded embryos exhibited the same total change in ventricular diameter [Figs. 9(a) and 9(b)]. Further analysis revealed, however, that ventricular area in the imaging plane increased significantly after banding, while the overall change in ventricular area over the cardiac cycle did not change [Figs. 9(c) and 9(d)]. Maximum OFT diameter over the cardiac cycle did not exhibit significant dimensional changes with banding. However, the minimum OFT diameter increased significantly in the banded group as compared to control hearts [Fig. 9(e)]. As a result, a significant decrease in the overall change in diameter of the OFT (at the O2 position) was observed with banding [Fig. 9(f)]. Fig. 9Chicken embryo heart dimensional changes after banding. (a) Ventricular diameters at end diastole (maximum diameter) and end systole (minimum diameter) at the V2 position; and (b) change in diameter, calculated as the difference between end diastolic and end systolic diameter. (c) Ventricular areas at end diastole and end systole; and (d) change in area, calculated as the difference between end diastolic and end systolic area. (e) Maximum and minimum OFT diameters at the O2 position; and the (f) change in diameter, calculated as the difference between maximum and minimum diameter over the cardiac cycle. Data are shown as ; -values obtained from Student’s -tests of less than 0.05 were considered statistically significant and are denoted by asterisks.  4.DiscussionOur results offer a detailed description of cardiac ventricular and OFT wall motion in control embryos and the response to OTB in the HH18 embryonic heart, before biological changes were evident. Collectively, our data quantify changes in cardiac wall motion using a simple light microscopy imaging modality. We found that banding induces a time delay of blood flow from the ventricle to the OFT followed by a faster-than-normal (and perhaps even synchronous) expansion and contraction wave velocity through the OFT. These results complement previous studies and demonstrate that, in addition to altering hemodynamic conditions, banding results in altered cardiac motion. These changes are in response not only to the physical restriction to motion imposed by the band but also in tissues upstream and downstream of the band by interaction between flow and the cardiac wall. The main advantages of the optical imaging approach presented here are ease of implementation, and ability to visualize the heart at early developmental stages. While recent studies using in vivo tomographic modalities, such as OCT and ultrasound, have provided accurate descriptions of cardiac wall motion in 2-D and three-dimensional (3-D), acquisition of data is not simple and subjected to equipment limitations.19,21,26–31 Even though optical images lose the details of the 3-D geometry, such as the elliptical shape of the cardiac lumen, they can be effectively used to analyze wall motion patterns and changes in those patterns due to altered hemodynamics in the developing heart. Using our proposed method, the intensity traces, overall, demonstrate remarkably consistent expansion and contraction profiles in the control group, whereas the banded group demonstrated greater variation, perhaps owing to slight differences in band tightness and band placement despite efforts to control for these factors. The high reproducibility of data within the control group, however, showed that our approach is accurate and sufficiently sensitive to detect subtle changes in wall motion dynamics. 4.1.Limitations of the Centerline Intensity ApproachSeveral limitations of the centerline-intensity approach need to be considered, specifically relating to heart morphology and methodological considerations. During looping the heart bends in a direction perpendicular to the imaging plane, which limits the visible portion of the heart available for analysis. This natural morphology of the heart, combined with the viewing angle, may cause optical superposition of signals that complicate interpretation of data. In this work, the implementation of a smoothing algorithm reduced the effects of superimposing signals, but more elaborate algorithms might be required in other applications. In the ventricle, trabeculae (a muscular “sponge-like” structure in the luminal outer ventricular curvature) alter the maximum intensity reached; however, the overall behavior of the intensity profile during cardiac motion is unaffected. Nevertheless, optimizing image contrast is critical, so that changes in intensity during expansion and contraction, especially the timing of maximum and minimum intensity, can be detected. Rigid-body motions could also influence interpretation of M-modes and centerline intensities. The effect of such motion, however, is negligible in our measurements as the early embryo is stationary. Moreover, any rigid-body motion from cardiac pumping is small relative to periodic cardiac wall motion. Needless to say, optical visualization and analysis of changes in blood flow require semitransparent tissues that are easily accessible for imaging. This constrains the applicability of the centerline intensity method to early stages of development, when tissues are semitransparent, and in the case of chicken, embryos are easy to access inside the egg and on top of the yolk. Overall, our data were consistent among embryos. Differences among embryo traces were largely due to biological variations in heart rate ( due to temperature and natural variations) and human error in precisely selecting regions of interest along the centerline. The consistency in the obtained data from successive locations in the OFT relative to the ventricle suggests a minimal contribution from manual selection of points along the centerline, providing evidence for the accuracy and reproducibility of the presented centerline intensity method. While limitations of this approach should be taken into account to properly interpret intensity data, they are somewhat offset by the centerline intensity method’s simplicity, ease of implementation, and reproducibility. 4.2.Wave Propagation Through the OFT and VentricleWith respect to results, this study complements previous work assessing the development and function of the cardiac conduction system at early embryonic stages. By measuring activation patterns in the developing heart, Reckova et al. showed that cardiovascular conduction decelerates through the atrioventricular (AV) canal and OFT and accelerates in the ventricle at HH17.27 Similar results were found in HH15 quail embryos using optical mapping and 3-D modeling.32 This rapid rate of impulse propagation at this early developmental stage could account for the seemingly “synchronous” expansion and contraction of the ventricle observed here at HH18, assuming excitation–contraction coupling is similar throughout the heart. Despite altered loading conditions induced by banding, ventricle functional parameters are conserved with OTB, including the proportion of the cardiac cycle when the ventricle is expanding and contracting and the timing of expansion and contraction events. This indicates that the developing heart exhibits a large range of compensatory adaptations to the altered hemodynamic load. Increased resistance to flow at the banding site induces increased blood pressure in the ventricle, which may cause sarcomere lengthening and an increase in end-diastolic volume. This, in turn, would increase ventricular contraction forces as a “Starling response” permitting flow against increased resistance in the presence of the band.33–35 While ventricular diameter did not show a significant change, a significant increase in the ventricular area at both end diastole and end systole was observed after banding with respect to controls. Importantly, however, the overall change in ventricular area over the cardiac cycle is not altered with banding. These observations agree with previous studies, which show that the heart demonstrates an astonishing ability to conserve stroke volume even when end-diastolic volume is increased with banding.17,36,37 We demonstrate that the peristaltic-like motion of the OFT walls is disrupted by banding (Figs. 7 and 8). In control embryos, the OFT walls expand and contract proximally to distally, resembling a wave propagating through the OFT. The speed of the propagating wave increases distally and the OFT wall motion is distinct from the motion of the ventricular wall. When the OFT is banded, however, the motion of the OFT walls becomes more synchronous, that is to say, the speed of the propagating wave becomes faster. However, there is a delay in OFT wall motion with respect to ventricular wall motion (see Figs. 7 and 8). These findings support recent work that used OCT to track OFT wall motion;26,28 and a servo-null system coupled with ECG measurements to synchronize blood pressure data.18,19 Those studies showed that blood pressure and OFT wave propagation speed increase after banding.19,26 4.3.Characterizing Expansion and Contraction in the Ventricle and OFTIn addition to inducing abnormal wave propagation in the OFT, banding changes the proportion of time the OFT uses to expand and contract (see Fig. 8). Here, we observed a significant decrease in the percent of the cardiac cycle spent in the contraction phase in the distal portion of the OFT (O2 and O3), during which the time of flow—or portion of the cardiac cycle during which blood flows through the OFT—decreases somewhat linearly with band tightness.17 Meanwhile, dimensional measurements of the OFT (at the O2 position) show a decrease in the range of wall motion after banding with respect to controls. While maximum expansion diameter did not change after banding, the OFT diameter during wall contraction (minimum diameter) increased in banded embryos with respect to controls. This change could perhaps be explained given that the time the OFT wall is contracting is decreased after banding with respect to controls, and thus maximum contraction range might not be reached with banding. This will also explain why the expansion phase lag in the OFT (O1 to O3) significantly decreases with banding, but there is no difference between control and banded hearts in the contraction phase lag (see Fig. 7). These changes in the expansion and contraction profile of the developing OFT provide insights into how the biomechanical microenvironment is altered with OTB and could lead to abnormal remodeling of the early embryonic heart. Understanding the long-term consequences of banding on wall motion and cardiomyocyte function, however, requires further study. 5.ConclusionsIn this study, we present a centerline-intensity method to characterize embryonic heart wall motion. While the method could be used in several different applications, we compared the motion of chicken embryo hearts under control and hemodynamically altered conditions, more specifically hemodynamic overload introduced by banding. Regional changes in cardiac motion were observed with banding. In control hearts, the ventricle expanded and contracted in an apparent synchronous fashion, while the OFT walls expanded and contracted in a peristaltic-like manner. With banding, however, the peristaltic-like motion of the OFT was disrupted and motion of OFT walls was more synchronous. The conservation of ventricular wall motion, featuring similar patterns of synchronous expansion and contraction in control and banded hearts, suggests that the embryonic cardiovascular system exhibits highly adaptive capabilities at early developmental stages in response to altered hemodynamic load. These changes in cardiac wall motion were observed after only a couple hours of banding, before the heart had time to remodel its tissues in response to the hemodynamic load, and thus mainly reflect immediate adaptation mechanisms of the early embryonic heart. Importantly, our proposed method’s simplicity and reliance on simple light microscopy permits its widespread use for assessing changes in dynamic heart wall motion and other cardiac parameters in a number of developmental biology studies, without relying on more expensive and sophisticated imaging systems, such as OCT or ultrasound. AcknowledgmentsThis work has been supported by grants funded by the National Heart, Lung, and Blood Institute (NIH R01 HL094570). The authors would like to thank Dr. Tracy Petrie and Dr. Venkat Keshav Chivikula for assisting in the development of the project. The content is solely the responsibility of the authors and does not necessarily represent the official views of grant giving bodies. ReferencesA. S. Go et al.,
“Heart disease and stroke statistics—2013 update: a report from the American Heart Association,”
Circulation, 127 e6
–e245
(2013). http://dx.doi.org/10.1161/CIR.0b013e31828124ad CIRCAZ 0009-7322 Google Scholar
B. Hogers et al.,
“Unilateral vitelline vein ligation alters intracardiac blood flow patterns and morphogenesis in the chick embryo,”
Circ. Res., 80 473
–481
(1997). http://dx.doi.org/10.1161/01.RES.80.4.473 CIRUAL 0009-7330 Google Scholar
J. R. Hove et al.,
“Intracardiac fluid forces are an essential epigenetic factor for embryonic cardiogenesis,”
Nature, 421 172
–177
(2003). http://dx.doi.org/10.1038/nature01282 Google Scholar
J. C. Culver and M. E. Dickinson,
“The effects of hemodynamic force on embryonic development,”
Microcirculation, 17 164
–178
(2010). http://dx.doi.org/10.1111/micc.2010.17.issue-3 MCCRD8 0275-4177 Google Scholar
T. Bartman and J. Hove,
“Mechanics and function in heart morphogenesis,”
Dev. Dyn., 233 373
–381
(2005). http://dx.doi.org/10.1002/(ISSN)1097-0177 DEDYEI 1097-0177 Google Scholar
E. Loots, B. Hillen and A. E. P. Veldman,
“The role of hemodynamics in the development of the outflow tract of the heart,”
J. Eng. Math., 45 91
–104
(2003). http://dx.doi.org/10.1023/A:1022029300196 JLEMAU 0022-0833 Google Scholar
D. Sedmera et al.,
“Developmental changes in the myocardial architecture of the chick,”
Anatomical Record, 248 421
–432
(1997). http://dx.doi.org/10.1002/(ISSN)1097-0185 Google Scholar
S. Stekelenburg-de et al.,
“Acutely altered hemodynamics following venous obstruction in the early chick embryo,”
J. Exp. Biol., 206 1051
–1057
(2003). http://dx.doi.org/10.1242/jeb.00216 JEBIAM 0022-0949 Google Scholar
E. B. Clark and G. C. Rosenquist,
“Spectrum of cardiovascular anomalies following cardiac loop constriction in the chick embryo,”
Birth Def. Orig. Artic. Ser., 14 431
–442
(1978). BTHDAK Google Scholar
E. B. Clark et al.,
“Effect of increased pressure on ventricular growth in stage 21 chick embryos,”
Am. J. Physiol., 257 H55
–H61
(1989). AJPHAP 0002-9513 Google Scholar
Z. Chen et al.,
“The study on the light absorption and transmission laws of the blood components,”
Proc. SPIE, 5254 257
(2003). http://dx.doi.org/10.1117/12.546171 PSISDG 0277-786X Google Scholar
D. P. Boyd et al.,
“A proposed dynamic cardiac 3-D densitometer for early detection and evaluation of heart disease,”
J. Comput. Assisted Tomogr., 4 135
(1980). http://dx.doi.org/10.1097/00004728-198002000-00042 JCATD5 0363-8715 Google Scholar
N. R. Silverman,
“Clinical videodensitometry,”
Am. J. Roentgenol. Radium Ther. Nucl. Med., 114 840
–850
(1972). http://dx.doi.org/10.2214/ajr.114.4.840 AJRRAV 0002-9580 Google Scholar
M. Mischi, T. Kalker and E. Korsten,
“Videodensitometric methods for cardiac output measurements,”
EURASIP J. Adv. Signal Process., 2003 479
–489
(2003). http://dx.doi.org/10.1155/S1110865703211185 Google Scholar
E. Deniz et al.,
“Endogenous contrast blood flow imaging in embryonic hearts using hemoglobin contrast subtraction angiography,”
Opt. Lett., 37 2979
–2981
(2012). http://dx.doi.org/10.1364/OL.37.002979 OPLEDP 0146-9592 Google Scholar
V. Hamburger and H. L. Hamilton,
“A series of normal stages in the development of the chick embryo,”
Dev. Dyn., 195 231
–272
(1992). http://dx.doi.org/10.1002/aja.1001950404 DEDYEI 1097-0177 Google Scholar
M. Midgett, S. Goenezen and S. Rugonyi,
“Blood flow dynamics reflect degree of outflow tract banding in Hamburger-Hamilton stage 18 chicken embryos,”
J. R. Soc. Interface, 11 20140643
(2014). http://dx.doi.org/10.1098/rsif.2014.0643 1742-5689 Google Scholar
K. Tobita et al.,
“Regional passive ventricular stress-strain relations during development of altered loads in chick embryo,”
Am. J. Physiol. Heart Circ. Physiol., 282 H2386
–H2396
(2002). http://dx.doi.org/10.1152/ajpheart.00879.2001 Google Scholar
L. Shi et al.,
“Alterations in pulse wave propagation reflect the degree of outflow tract banding in HH18 chicken embryos,”
Am. J. Physiol. Heart Circ. Physiol., 305 H386
–H396
(2013). http://dx.doi.org/10.1152/ajpheart.00100.2013 Google Scholar
A. Liu et al.,
“Quantifying blood flow and wall shear stresses in the outflow tract of chick embryonic hearts,”
Comput. Struct., 89 855
–867
(2011). http://dx.doi.org/10.1016/j.compstruc.2011.03.003 CMSTCJ 0045-7949 Google Scholar
S. Rugonyi et al.,
“Changes in wall motion and blood flow in the outflow tract of chick embryonic hearts observed with optical coherence tomography after outflow tract banding and vitelline-vein ligation,”
Phys. Med. Biol., 53 5077
–5091
(2008). http://dx.doi.org/10.1088/0031-9155/53/18/015 PHMBA7 0031-9155 Google Scholar
D. Sedmera et al.,
“Remodeling of chick embryonic ventricular myoarchitecture under experimentally changed loading conditions,”
Anat. Rec., 254 238
–252
(1999). http://dx.doi.org/10.1002/(ISSN)1097-0185 ANREAK 0003-276X Google Scholar
J. Coucelo et al.,
“Myocardial architecture, texture and left ventricular heterogeneity in the pulsed Doppler tissue imaging pattern,”
Rev. Port. Cardiol., 19 217
–224
(2000). Google Scholar
B. Keller and E. Clark,
“Cardiovascular structural and functional maturation,”
Curr. Opin. Cardiol., 8 98
–107
(1993). http://dx.doi.org/10.1097/00001573-199301000-00012 COPCE3 0268-4705 Google Scholar
B. B. Keller, N. Hu and E. B. Clark,
“Correlation of ventricular area, perimeter, and conotruncal diameter with ventricular mass and function in the chick embryo from stages 12 to 24,”
Circ. Res., 66 109
–114
(1990). http://dx.doi.org/10.1161/01.RES.66.1.109 CIRUAL 0009-7330 Google Scholar
A. Liu et al.,
“Biomechanics of the chick embryonic heart outflow tract at HH18 using 4D optical coherence tomography imaging and computational modeling,”
Plos One, 7 e40869
(2012). http://dx.doi.org/10.1371/journal.pone.0040869 POLNCL 1932-6203 Google Scholar
M. Reckova et al.,
“Hemodynamics is a key epigenetic factor in development of the cardiac conduction system,”
Circ. Res., 93 77
–85
(2003). http://dx.doi.org/10.1161/01.RES.0000079488.91342.B7 CIRUAL 0009-7330 Google Scholar
V. K. Chivukula et al.,
“Effect of outflow tract banding on embryonic cardiac hemodynamics,”
J. Cardiovasc. Dev. Dis., 3 1
(2016). http://dx.doi.org/10.3390/jcdd3010001 Google Scholar
C. L. Gregg and J. T. Butcher,
“Quantitative in vivo imaging of embryonic development: opportunities and challenges,”
Differentiation, 84 149
–162
(2012). http://dx.doi.org/10.1016/j.diff.2012.05.003 DFFNAW 0301-4681 Google Scholar
S. E. Lindsey, J. T. Butcher and H. C. Yalcin,
“Mechanical regulation of cardiac development,”
Front. Physiol., 5 318
(2014). http://dx.doi.org/10.3389/fphys.2014.00318 FROPBK 0301-536X Google Scholar
A. M. Oosterbaan et al.,
“Doppler flow velocity waveforms in the embryonic chicken heart at developmental stages corresponding to 5-8 weeks of human gestation,”
Ultrasound Obst. Gynecol., 33 638
–644
(2009). http://dx.doi.org/10.1002/uog.v33:6 Google Scholar
S. Gu et al.,
“Mapping conduction velocity of early embryonic hearts with a robust fitting algorithm,”
Biomed. Opt. Express, 6 2138
–2157
(2015). http://dx.doi.org/10.1364/BOE.6.002138 BOEICL 2156-7085 Google Scholar
J. E. Stelzer et al.,
“Activation dependence of stretch activation in mouse skinned myocardium: implications for ventricular function,”
J. Gen. Physiol., 127 95
–107
(2006). http://dx.doi.org/10.1085/jgp.200509432 JGPLAD 0022-1295 Google Scholar
K. B. Campbell and M. Chandra,
“Functions of stretch activation in heart muscle,”
J. Gen. Physiol., 127 89
–94
(2006). http://dx.doi.org/10.1085/jgp.200509483 JGPLAD 0022-1295 Google Scholar
J. S. Davis et al.,
“The overall pattern of cardiac contraction depends on a spatial gradient of myosin regulatory light chain phosphorylation,”
Cell, 107 631
–641
(2001). http://dx.doi.org/10.1016/S0092-8674(01)00586-4 CELLB5 0092-8674 Google Scholar
B. B. Keller, M. Yoshigi and J. P. Tinney,
“Ventricular-vascular uncoupling by acute conotruncal occlusion in the stage 21 chick embryo,”
Am. J. Physiol., 273 H2861
–H2866
(1997). AJPHAP 0002-9513 Google Scholar
M. Yoshigi, N. Hu and B. B. Keller,
“Dorsal aortic impedance in stage 24 chick embryo following acute changes in circulating blood volume,”
Am. J. Physiol., 270 H1597
–H1606
(1996). AJPHAP 0002-9513 Google Scholar
BiographyStephanie Stovall received her BA degree in chemistry and communication arts from Linfield College in 2014. She is an MD candidate at Oregon Health and Science University. Madeline Midgett is a PhD candidate in Sandra Rugonyi’s lab in the Biomedical Engineering Department at Oregon Health and Science University, Oregon. After receiving her undergraduate degree in bioengineering from Oregon State University in 2011, she joined the Rugonyi lab in 2013 and focused on characterizing the role of blood flow patterns in the development of cardiac malformation and defects. Kent Thornburg is a professor of medicine and the M. Lowell Edwards Chair in cardiology in the Knight Cardiovascular Institute. He was trained in developmental biology and cardiovascular physiology. He studies heart development and its influence on adult heart disease. Sandra Rugonyi is an associate professor of biomedical engineering at Oregon Health and Science University, Oregon. She received her PhD in mechanical engineering from Massachusetts Institute of Technology in 2001, and since then has been applying her skills to the biomedical engineering field. Her interests are on cardiac development and cardiovascular mechanics. |


