|
|
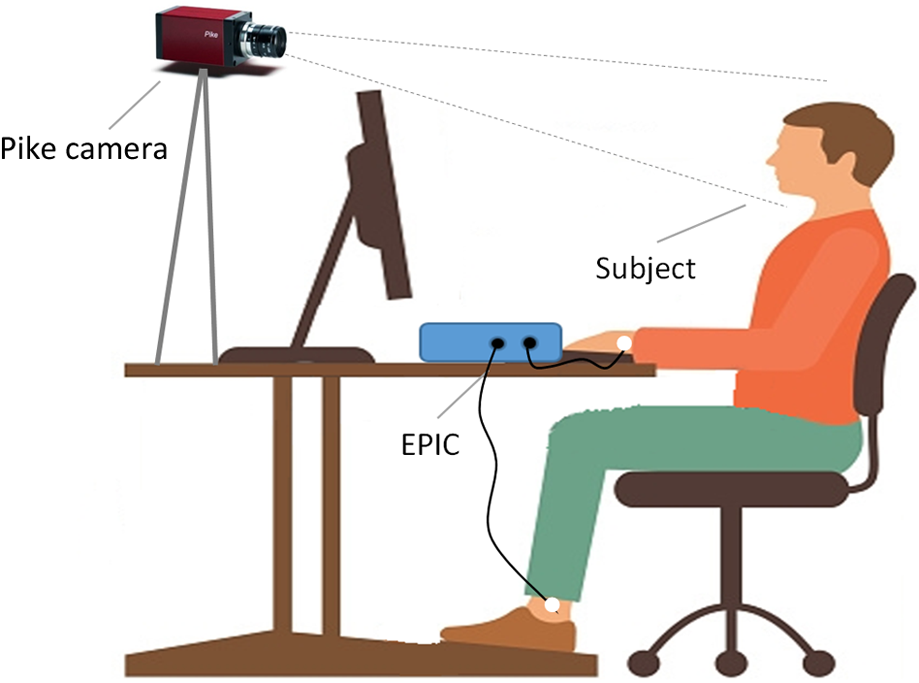
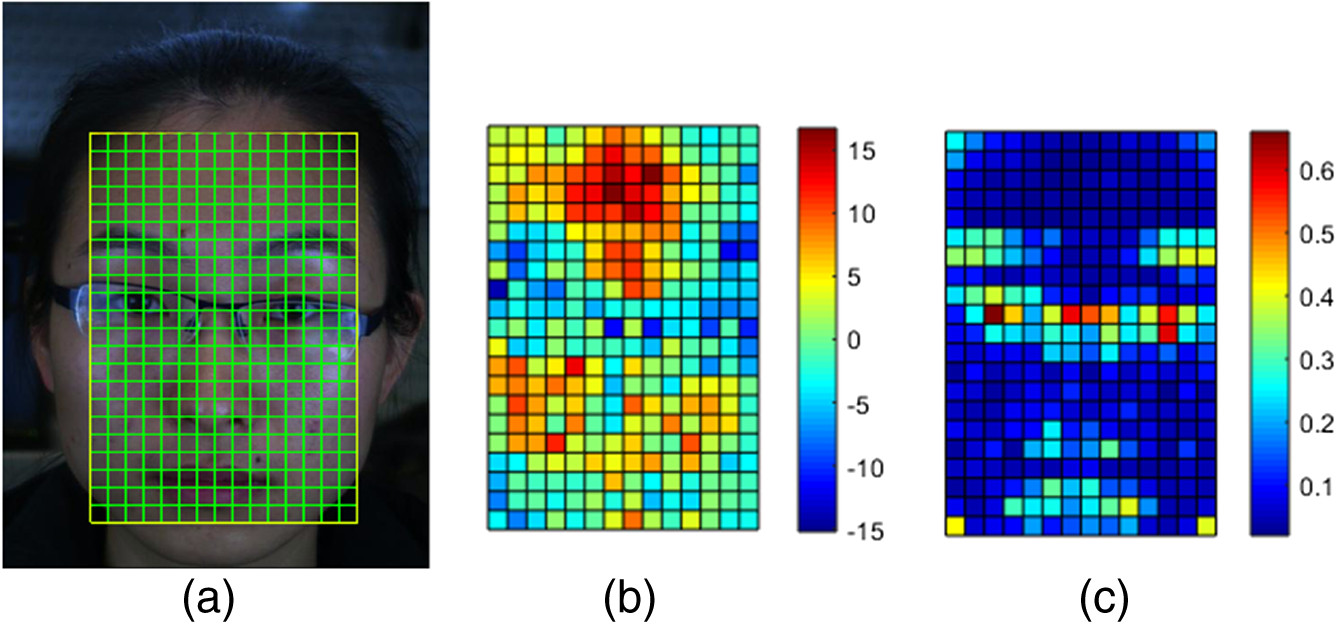
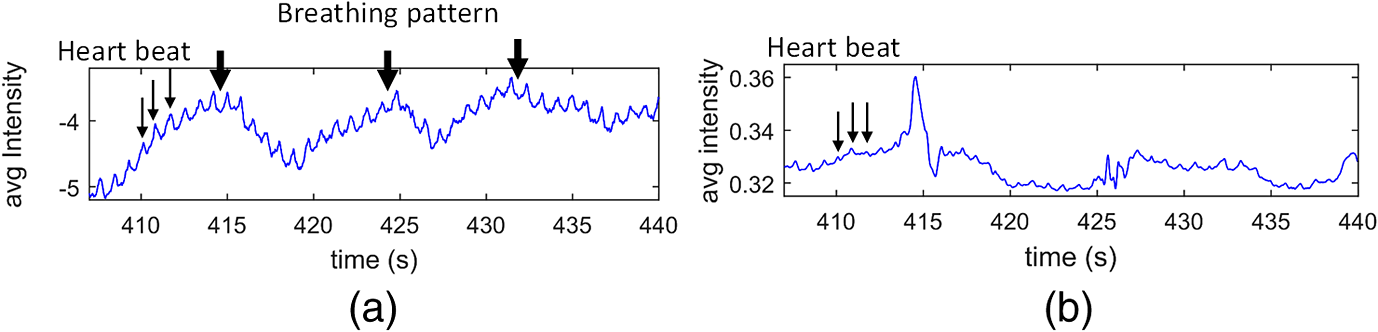
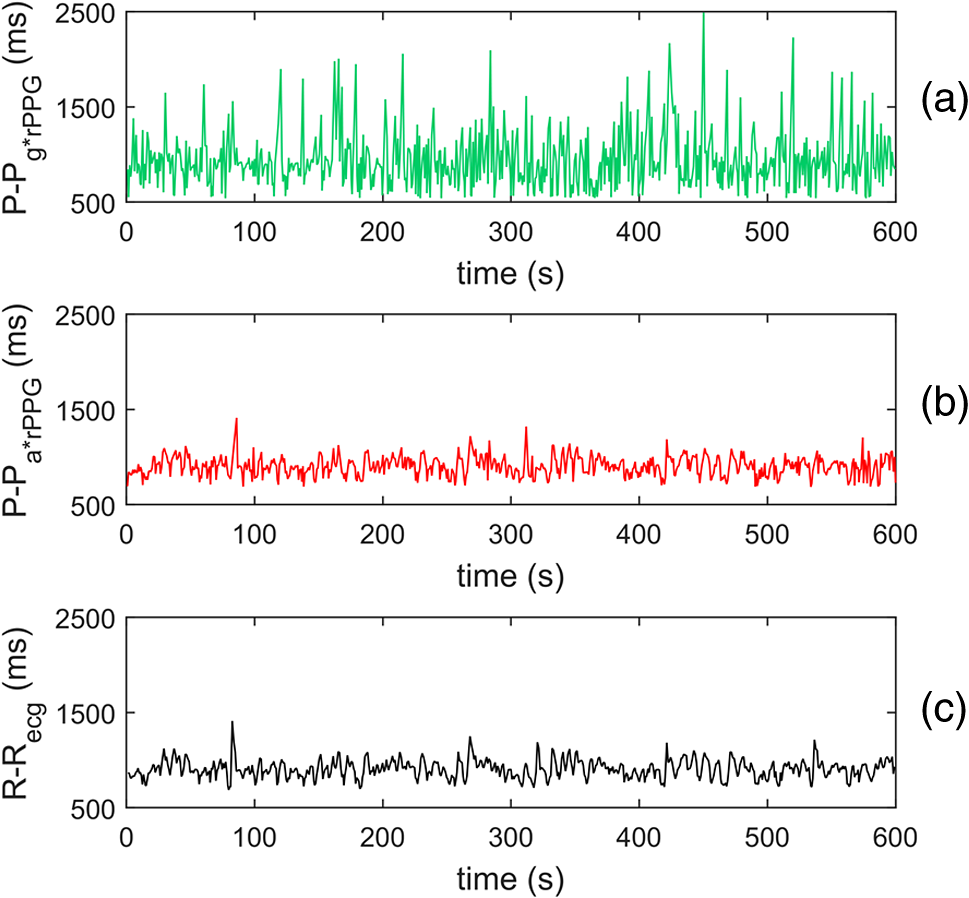
1.IntroductionPhotoplethysmography (PPG)1 is an essential tool to monitor patients’ vital signs in medical practice.2 It detects the optical absorption variations of human skin associated with blood volume variations during cardiac cycles. Traditional PPG requires contact of a device to the skin, which is not suitable for monitoring patients with skin damage (burn, ulcer, and trauma), or under conditions when unconstrained movement is required.3 Recently, remote photoplethysmography (rPPG) has been proposed for contactless monitoring of a subject’s PPG using a regular camera.4–6 This approach is particularly attractive because it allows tracking of the subject’s PPG under free-living conditions, while he or she is performing daily activities, e.g., working on a computer, watching television at home, or in the workplace. Several recent reports have shown that rPPG can be monitored under well-controlled laboratory conditions.7–9 However, in realistic settings, e.g., in hospitals or homes, reliable rPPG is difficult due to artifacts associated with the natural and involuntary movements of the subject.10,11 To overcome this difficulty, various creative methods have been developed, including independent component analysis11,12 and principle component analysis.13,14 These blind source separation algorithms help to improve the quality of rPPG, but often fail to recover rPPG signal from serious movement artifacts. Another effort is to divide the face area into many small regions, and then reduce the body movement-induced artifacts on the rPPG from the entire face area by adjusting the weighting factors for different regions.15 Since rPPG signals have different amplitudes in the three color channels of RGB color space,16,17 algorithms based on a combination of different color channels have been developed to reduce the movement artifacts.16,18 For example, Feng et al.19 proposed an adaptive green and red difference method to remove the movement-modulated scattered light and diffuse reflection light. Haan and Jeanne20 calculated two chrominance components from the three RGB color channels and then reconstructed the rPPG signal as a linear combination of the two components. The essence of these methods is to analyze the movement artifacts in different color channels, and then remove them via subtraction and normalization. Wang et al.21 exploited spatial redundancy of image sensor for robust rPPG. Several groups compared rPPG signals obtained with different color models.22,23 Despite the extensive efforts described above, body movements remain to be a difficult challenge that prevents one from moving rPPG-tracking technologies from research labs to clinical settings. In the present work, we describe a new approach for robust rPPG. First, we examine the effects of body movement on image intensity and chromaticity and find it affects the former much more than the latter. This is because the chromaticity reflects the intrinsic optical properties of hemoglobin in blood.24 Then we develop an rPPG algorithm in CIELab color space,25 which naturally separates intensity (channel L*) from the chromaticity (channels a* and b*). The algorithm analyzes changes in the skin-tone associated with cardiac cycle26 from the chromaticity channels in CIELab color space, so it can isolate the rPPG signals from motion artifacts effectively. In addition to the CIELab color space analysis, our method includes adaptive selection of region of interest (ROI) and pruning of image frames, in which the subject’s face moves out of the view or is blocked by objects. We validate the method with a pilot study, including 17 subjects with various skin tones, under realistic free-living conditions. 2.Materials and MethodsTo minimize body movement-induced artifacts in rPPG, our method first determines an optimal ROI to perform rPPG, and then tracks the ROI as the subject moves.27 Sometimes, the subject may turn his/her head around, or even stand up and walk away. In such events, tracking of the ROI is interrupted. The method detects such events and removes the corresponding image frames so that they will not produce artifacts to rPPG. Finally, it determines rPPG with an algorithm in CIELab color space. We design experiments to validate our method. The details are described below. 2.1.Experimental SetupTo examine the effectiveness of the present method, we performed a pilot study including 17 subjects. The subjects consisted of 11 males and 6 females, with different ages (), ethnic profiles, and skin tones. This study was approved by Arizona State University’s Institutional Review Board (STUDY00003940), and all the subjects were informed of potential risks and benefits and signed an informed consent. The experiment setup is shown in Fig. 1. Each subject was asked to sit on a chair and work on a computer naturally, such that various natural body movements occurred during the experiment. A Pike color camera (F-032C) was positioned behind the computer at about 0.8 m from the subject. During video recording, the subject’s electrocardiogram (ECG) was synchronously recorded with an electric potential integrated circuit (EPIC; Plessey Semiconductors, Inc.), using a pair of electrodes attached to the left wrist and ankle of the subject, respectively. The ECG recording served as a reference to validate rPPG. The auto-white balance mode of the camera was turned off and a 10-min video for each subject was recorded under ambient light (with a regular fluorescent lamp). All videos were recorded in color (24-bit RGB with three channels ) format at 30 frames per second with resolution of . Each video was divided into 60 segments, with 10-s duration each. rPPG signal within a time window of 20 s (two segments) was analyzed, and the window was moved from the beginning to the end of the entire 10-min video with a step of 10 s. 2.2.Automatic Identification of Optimal ROIThe face of the subject is first detected with the Viola–Jones (VJ) face detection algorithm28 [big rectangle in Fig. 2(a)]. The VJ algorithm is based on Harr features and can identify multiscale faces by training a boosted cascade of classifiers.28 The rectangular area of the face is selected and then divided into smaller areas. The areas are small enough to capture major facial features (e.g., forehead, nose, mouth, and eyes), and also large enough ( each) so that the signal-to-noise ratio (SNR) of the rPPG signal in each area is sufficiently high [Fig. 2(b)]. The forehead area provides some of the highest quality rPPG signals, followed by the cheek areas. This observation is in agreement with the literature.17 The forehead area is a good ROI for rPPG also because it is less affected by complications associated with facial expression changes, such as talking and smiling. Furthermore, the algorithm identifies the most uniform area on the forehead, which helps minimize light distribution changes on the face due to body movements. We evaluate the uniformity by calculating the surface roughness with where is the average intensity of all pixels in this area and is the standard deviation of the image intensity within the ROI. Note that in Eq. (1), larger means less uniform. As shown in Fig. 2(c), the most uniform areas are the forehead and cheek areas. A region of is automatically selected from the forehead as the optimal ROI for rPPG. This size of ROI is empirically determined to include most of the uniform area of the forehead.2.3.ROI Tracking and Image Frame PruningAs the subject moves, the optimal ROI changes. To determine rPPG with the same ROI, the ROI is tracked with the Kanade–Lucas–Tomasi (KLT) algorithm.27 Some body movements are large, e.g., waving of hands in front of the face and sudden turning of head, which block the ROI or move it out of the camera view, causing failure of the ROI tracking algorithm. To mitigate this problem, the corresponding image frames are pruned with an algorithm described below. A movement vector that describes the movement-induced changes in the ROI is calculated by tracking feature points within the ROI with the KLT algorithm.27,29 Using the movement vector, the location, shape, and size of the ROI are adjusted for each frame. Feature points within the ROI are detected in the first frame using the corner point detection algorithm developed by Shi and Tomasi,30 and these feature points are then tracked frame by frame. Thresholding in the calculation28 causes loss of some points during tracking. To minimize this error, the feature points are reinitialized for every 900 frames (corresponding to 30 s). When a large movement occurs, many of the feature points are lost. If too many feature points are lost, then tracking of the ROI becomes difficult or meaningless. In the present algorithm, image frames with loss over 30% of the feature points are pruned. 2.4.rPPG Signal Extraction in CIELab Color SpaceCIELab color space is perceptually uniform, i.e., the Euclidean distance between two different colors is close to the color difference perceived by the human eye.25 Channel L* is the luminance or lightness component, which ranges from 0 to 100. Channels a* and b* are two chromatic components, both ranging from to 120.31 To convert an image in RGB to CIELab color space, the first step is to convert it into color space according to32 where , , and denote the three channels after normalization by (). The normalization helps reduce the illumination nonuniformity. The CIELab channels are calculated by where , and are the CIE XYZ tristimulus values of white color, which is given by under CIE standard illuminant D65 (developed to represent average daylight).The green (g*) channel in RGB color space is widely adopted for rPPG tracking. RGB color space is device-dependent, nonintuitive, and perceptually nonuniform,25 and its three components are highly correlative with cross correlation coefficients of (between blue and red channels), (between red and green channels), and (between green and blue channels).33 In contrast, CIELab color space separates the intensity and chromaticity components. We hypothesize that the body movements affect mainly the intensity distribution over the body, and little the color of the skin. Because PPG arises from cardiac cycles, which change both the intensity and chromaticity of the skin, CIELab is then expected to be superior for robust rPPG. To examine the above hypothesis, we simulated the human body with a mannequin with color resembling the human skin color [Fig. 3(a)], and human body movements by translating the mannequin (left/right and forward/backward) with amplitudes of , and rotating it (left/right and upward/downward) with . Because the mannequin has no cardiac cycles, the image intensity and color changes are entirely due to the movements. An ROI was selected on the forehead of the mannequin [Fig. 3(a)] and tracked with the KLT algorithm, and the movement-induced changes in L*, a*, and b* channels of the ROI were determined [Fig. 3(b)]. Figure 3(b) plots the normalized changes in L*, a*, and b* channels associated with the movements of the mannequin at 10 to 15 s and 25 to 30 s, which shows large changes in L*, but little changes in a* and b*. This observation indicates that the chromaticity channels, a* and b*, are more tolerant of the movement-induced artifacts than the intensity channel, L*. For comparison, the effects of the same movements on red, green, blue channels in RGB color space were also analyzed [Fig. 3(c)], which show substantial movement-induced artifacts on all three RGB color channels. Fig. 3Testing of body movement-induced artifacts in rPPG with a mannequin. (a) ROI selection on the mannequin. (b) Movement-induced changes in L*, a*, and b* channels (CIELab color space). (c) Movement-induced changes in red, green and blue channels (RGB color space). For fair comparison, the change in each channel (L*, a*, b*, red, green, and blue) is normalized by the corresponding range.  The experiment indicates that the chromaticity channels in CIELab color space are least sensitive to the body-movement artifacts. This observation may be rationalized by the following considerations. Under ambient light illumination (fixed and close-to white light), the movements can change the angle of light incident on the mannequin, and the angles of light reflected and scattered from the mannequin that enter the camera. Forward and backward translations also change the size of the mannequin image captured by the camera. However, all these changes are expected to change mostly the image intensity, rather than the color. This is because the chromaticity reflects the intrinsic optical properties of hemoglobin in blood.24 3.Results3.1.Remote PhotoplethysmographyFollowing the process described in Sec. 2, rPPG signals were extracted from the recorded videos for different subjects. Figure 4 is an example of rPPG in L*, a*, and b* channels of CIELab color space, showing that the rPPG signal is cleanest in a* and most noisy in L* channel. The finding for L* channel is expected because L* is most sensitive to the body movement artifacts as discussed earlier. The rPPG in b* channel () is better than that in L* channel (), but not as clean as that in a* channel (). We will discuss more on the mechanism in the next section. Previous studies17 have shown that g* channel in RGB color space provides the best rPPG, so we compare a* channel rPPG with g* channel rPPG below. Figure 5 plots the rPPG signals extracted from a* and g* channels of the same video. Compared with g* rPPG in RGB color space, a* rPPG in CIELab color space shows more clearly the breathing pattern with an average time interval of . Close inspection of the rPPG signals in g* and a* of the same time interval shows that the heartbeat signals in a* is far cleaner than those in g*. The large fluctuations in g* rPPG were due to head movements of the subject. The same head movements had little effect on a* rPPG. This comparison indicates that rPPG in CIELab space is more robust to the subject body movement than that in RGB color space. To further compare and quantify the performance of rPPG analysis in CIELab and RGB color spaces, we determine heart rate (HR) correlation with the gold standard ECG, SNR, and error of peak-to-peak (P-P) interval. We describe each of them below. 3.2.Heart Rate EvaluationHR is one of the most important physiological parameters. We validate the accuracy of the present method for tracking HR by comparing the results with those by ECG, the gold standard reference for HR tracking. The heart beating cycles were determined from the oscillatory peaks in rPPG within each time window of 20 s. Figures 6(a) and 6(b) show the correlation between HR detected by g* channel in RGB color space and a* channel in CIELab color space with the reference ECG signal, respectively. The correlation plot for g* channel rPPG has a slope of 0.74 with the Pearson value () of 0.79. In contrast, the correlation plot for a* channel rPPG has a slope of 0.94 with , which is much better than the rPPG signals in RGB color space. 3.3.Signal-to-Noise Ratio EvaluationWe evaluated the SNR of the rPPG signals obtained in RGB and CIELab color spaces, using the following definition for SNR:20 where is the spectrum of the pulse signal ( is the frequency) within 0.7 and 4 Hz, is a binary template window, which is 1 within two frequency windows, one window is around the fundamental frequency () [(, )], and the other is around the first harmonics [(, )], and 0 outside of the two frequency windows. As shown in Fig. 7, the average SNR of all the subjects calculated from a* rPPG is 12, which is 10 times higher than that calculated from g* rPPG. Results of two-tailed student’s test () show that the difference between the SNRs for the rPPG signals from CIELab and RGB color space is statistically significant. It indicates that the rPPG signal from CIELab color space is much better than that from RGB color space.3.4.Peak-to-Peak Interval EvaluationP-P interval is another metric to evaluate the performance of the CIELab color space method. It detects the time interval between two peaks, which is widely used to evaluate HR variability.7 In principle, one could also analyze the foot of each rPPG cycle. We used the peak instead of the foot to evaluate the quality of rPPG because of the following considerations. First, the P-P interval measures the temporal duration of each heart beat cycle similar to R wave-to-R wave (R-R) interval in ECG. Second, the peak is better defined than the foot, which can thus be more accurately detected. The P-P interval sequence was aligned with the simultaneously recorded R-R interval sequence in ECG. Figure 8 shows a typical example of P-P interval sequence calculated from g* rPPG and a* rPPG, and comparison of them with that from the simultaneously recorded ECG. Compared with g* rPPG, the P-P interval sequence from a* rPPG matches that from ECG much better. The average error between a* rPPG and ECG for all the subjects is 41.4 ms, while the average error between g* rPPG and ECG is 95.9 ms. Based on the results of the two-tailed student’s test (), the observed difference in the errors is statistically significant. It indicates that the rPPG signal from CIELab color space can reflect the heartbeat interval more accurately than that from RGB color space. 4.DiscussionAlthough both a* and b* channels are chromatic channels, a* channel performs better than b* channel for rPPG extraction, as shown in Fig. 4. A possible explanation of the observation is that blue in b* has a small skin penetration depth, which makes it less sensitive for rPPG detection.34 b* also contains yellow, which can penetrate human skin deeper than blue, but not as deep as red in a*. Also, an RGB color camera cannot directly detect yellow, and it represents yellow using a combination of red and green.35 For these reasons, b* channel is not as good as a* channel for optimal rPPG detection. We presented a CIELab-based method to remove subject movement-induced artifacts, and validated the findings with a pilot study, including 17 subjects under ambient conditions (with a regular fluorescent lamp). When converting the image to CIELab color space, CIE standard illuminant D65 was assumed. Although D65 is designed to simulate average daylight, which is expected to be a good approximation of ambient light in most cases, use of other less popular light sources (e.g., different colors) may change the conclusion, which requires further studies. Finally, we point out that the CIELab color space-based method may be combined with other signal denoising methods, e.g., the wavelet denoising method36 and adaptive filter,19 to further improve its performance. Further studies should also include more subjects under various illumination conditions. 5.ConclusionsWe have developed a method to achieve robust tracking of rPPG under realistic conditions, which allows the subject to work naturally on a computer with minimal restrictions to his/her movement. We have studied how the body movements affected the optical images, and found that they mainly affected the image intensity (rather than color). This finding leads us to propose a new rPPG method in CIELab color space, which separates the intensity (L* channel) from the chromaticity (a* and b* channels). Our method further included automatic selection of an optimal ROI on the subject face, and pruning of frames in which the ROI is not clearly captured. We have validated the method with 17 subjects, compared the results with the RGB color space analysis, and evaluated the performance using HR correlation with the gold standard ECG, SNR, and error of P-P interval. The pilot study shows that rPPG signals obtained with the present method are less prone to body movements, and thus provide more robust cardiac and breathing pattern measurements. ReferencesA. B. Hertzman,
“Photoelectric plethysmography of the fingers and toes in man,”
Exp. Biol. Med., 37
(3), 529
–534
(1937). http://dx.doi.org/10.3181/00379727-37-9630 EXBMAA 0071-3384 Google Scholar
J. E. Sinex,
“Pulse oximetry: principles and limitations,”
Am. J. Emerg. Med., 17
(1), 59
–66
(1999). http://dx.doi.org/10.1016/S0735-6757(99)90019-0 AJEMEN 0735-6757 Google Scholar
Y. Sun et al.,
“Noncontact imaging photoplethysmography to effectively access pulse rate variability,”
J. Biomed. Opt., 18
(6), 061205
(2012). http://dx.doi.org/10.1117/1.JBO.18.6.061205 JBOPFO 1083-3668 Google Scholar
M. A. Haque et al.,
“Heartbeat rate measurement from facial video,”
IEEE Intell. Syst., 31
(3), 40
–48
(2016). http://dx.doi.org/10.1109/MIS.2016.20 Google Scholar
D. Shao et al.,
“Noncontact monitoring breathing pattern, exhalation flow rate and pulse transit time,”
IEEE Trans. Biomed. Eng., 61
(11), 2760
–2767
(2014). http://dx.doi.org/10.1109/TBME.2014.2327024 IEBEAX 0018-9294 Google Scholar
M. Z. Poh, D. McDuff and R. Picard,
“Advancements in noncontact, multiparameter physiological measurements using a webcam,”
IEEE Trans. Biomed. Eng., 58
(1), 7
–11
(2011). http://dx.doi.org/10.1109/TBME.2010.2086456 IEBEAX 0018-9294 Google Scholar
D. Shao et al.,
“Noncontact monitoring of blood oxygen saturation using camera and dual-wavelength imaging system,”
IEEE Trans. Biomed. Eng., 63
(6), 1091
–1098
(2016). http://dx.doi.org/10.1109/TBME.2015.2481896 IEBEAX 0018-9294 Google Scholar
D. McDuff, S. Gontarek and R. W. Picard,
“Improvements in remote cardiopulmonary measurement using a five band digital camera,”
IEEE Trans. Biomed. Eng., 61
(10), 2593
–2601
(2014). http://dx.doi.org/10.1109/TBME.2014.2323695 IEBEAX 0018-9294 Google Scholar
Y. Sun et al.,
“Motion-compensated noncontact imaging photoplethysmography to monitor cardiorespiratory status during exercise,”
J. Biomed. Opt., 16
(7), 077010
(2011). http://dx.doi.org/10.1117/1.3602852 JBOPFO 1083-3668 Google Scholar
M.-Z. Poh, D. J. McDuff and R. W. Picard,
“Non-contact, automated cardiac pulse measurements using video imaging and blind source separation,”
Opt. Express, 18
(10), 10762
–10774
(2010). http://dx.doi.org/10.1364/OE.18.010762 OPEXFF 1094-4087 Google Scholar
R. H. Enríquez et al.,
“Analysis of the photoplethysmographic signal by means of the decomposition in principal components,”
Physiol. Meas., 23
(3), N17
(2002). http://dx.doi.org/10.1088/0967-3334/23/3/402 PMEAE3 0967-3334 Google Scholar
M. Kumar, A. Veeraraghavan and A. Sabharwal,
“DistancePPG: robust non-contact vital signs monitoring using a camera,”
Biomed. Opt. Express, 6
(5), 1565
–1588
(2015). http://dx.doi.org/10.1364/BOE.6.001565 BOEICL 2156-7085 Google Scholar
M. Hulsbusch and B. Rembold, Ein Bildgestütztes, Funktionelles Verfahren zur Optoelektronischen Erfassung der Hautperfusion, 70 RWTH Aachen University, Aachen, Germany
(2008). Google Scholar
W. Verkruysse, L. O. Svaasand and J. S. Nelson,
“Remote plethysmographic imaging using ambient light,”
Opt. Express, 16
(26), 21434
–21445
(2008). http://dx.doi.org/10.1364/OE.16.021434 OPEXFF 1094-4087 Google Scholar
L. Feng et al.,
“Motion-resistant remote imaging photoplethysmography based on the optical properties of skin,”
IEEE Trans. Circuits Syst. Video Technol., 25
(5), 879
–891
(2015). http://dx.doi.org/10.1109/TCSVT.2014.2364415 ITCTEM 1051-8215 Google Scholar
G. de Haan and V. Jeanne,
“Robust pulse rate from chrominance-based rPPG,”
IEEE Trans. Biomed. Eng., 60
(10), 2878
–2886
(2013). http://dx.doi.org/10.1109/TBME.2013.2266196 IEBEAX 0018-9294 Google Scholar
W. Wenjin, S. Stuijk and G. de Haan,
“Exploiting spatial redundancy of image sensor for motion robust rPPG,”
IEEE Trans. Biomed. Eng., 62
(2), 415
–425
(2015). http://dx.doi.org/10.1109/TBME.2014.2356291 IEBEAX 0018-9294 Google Scholar
H. Nisar, Z. Y. Lim, K. H. Yeap,
“A simple non-invasive automated heart rate monitoring system using facial images,”
Biomedical Image Analysis and Mining Techniques for Improved Health Outcomes, 100
–122 IGI Global, Hershey, Pennsylvania
(2016). Google Scholar
C. Lueangwattana, T. Kondo and H. Haneishi,
“A comparative study of video signals for non-contact heart rate measurement,”
in 12th Int. Conf. on Electrical Engineering/Electronics, Computer, Telecommunications and Information Technology,
(2015). http://dx.doi.org/10.1109/ECTICon.2015.7206971 Google Scholar
G. Bogdan et al.,
“Remote assessment of heart rate by skin color processing,”
in IEEE Int. Black Sea Conf. on Communications and Networking (BlackSeaCom),
(2015). http://dx.doi.org/10.1109/BlackSeaCom.2015.7185097 Google Scholar
M. Tkalcic and J. F. Tasic,
“Colour spaces: perceptual, historical and applicational background,”
in Computer as a Tool. The IEEE Region 8, EUROCON 2003,
(2003). http://dx.doi.org/10.1109/EURCON.2003.1248032 Google Scholar
W. Wang, S. Stuijk and G. de Haan,
“A novel algorithm for remote photoplethysmography: spatial subspace rotation,”
IEEE Trans. Biomed. Eng., 63
(9), 1974
–1984
(2016). http://dx.doi.org/10.1109/TBME.2015.2508602 IEBEAX 0018-9294 Google Scholar
C. Tomasi and T. Kanade, Detection and Tracking of Point Features, School of Computer Science, Carnegie Mellon University, Pittsburgh
(1991). Google Scholar
P. Viola and M. Jones,
“Rapid object detection using a boosted cascade of simple features,”
in IEEE Computer Society Conf. on Computer Vision and Pattern Recognition,
(2001). http://dx.doi.org/10.1109/CVPR.2001.990517 Google Scholar
B. D. Lucas and T. Kanade,
“An iterative image registration technique with an application to stereo vision,”
in Int. Joint Conf. on Artificial Intelligence,
(1981). Google Scholar
S. Jianbo and C. Tomasi,
“Good features to track,”
in IEEE Computer Society Conf. on Computer Vision and Pattern Recognition,
(1994). http://dx.doi.org/10.1109/CVPR.1994.323794 Google Scholar
K. L. Yam and S. E. Papadakis,
“A simple digital imaging method for measuring and analyzing color of food surfaces,”
J. Food Eng., 61
(1), 137
–142
(2004). http://dx.doi.org/10.1016/S0260-8774(03)00195-X JFOEDH 0260-8774 Google Scholar
S.-J. Wang et al.,
“Micro-expression recognition using color spaces,”
IEEE Trans. Image Process., 24
(12), 6034
–6047
(2015). http://dx.doi.org/10.1109/TIP.2015.2496314 IIPRE4 1057-7149 Google Scholar
H. Palus,
“Representations of colour images in different colour spaces,”
The Colour Image Processing Handbook, 67
–90 Springer, New York
(1998). Google Scholar
A. N. Bashkatov et al.,
“Optical properties of human skin, subcutaneous and mucous tissues in the wavelength range from 400 to 2000 nm,”
J. Phys. D: Appl. Phys., 38
(15), 2543
–2555
(2005). http://dx.doi.org/10.1088/0022-3727/38/15/004 JPAPBE 0022-3727 Google Scholar
Allied Vision Technologies, “Pike F-032 Fast VGA camera,”
https://www.alliedvision.com/en/products/cameras/detail/Pike/F-032.html Google Scholar
T.-H. Fu, S.-H. Liu and K.-T. Tang,
“Heart rate extraction from photoplethysmogram waveform using wavelet multi-resolution analysis,”
J. Med. Biol. Eng., 28
(4), 229
–232
(2008). Google Scholar
|