
|
|
1.IntroductionCryotherapy, also referred to as cryoablation or cryosurgery, is an established minimally invasive clinical technique for treatment of various external and internal lesions.1–4 Cryotherapy has gained acceptance as a clinical tool for the treatment of internal malignancies, including carcinomas of the prostate.5–9 This method of tissue ablation belongs to a larger category of thermal therapies and causes cancer cells to undergo coagulative necrosis as a result of deep freezing. A modern cryosurgical procedure employs thin cryoprobes (needles) of about 1.5 to 3 mm in diameter, which are precisely positioned near the cancerous tissue guided by ultrasound (US) imaging. Argon gas circulated inside the cryoprobes is cooled down to via Joule–Thomson effect freezing the surrounding cancer cells within seconds.10–12 Cancer treatment with cryotherapy is effective for high-grade cancers and benefits from a fast recovery, low toxicity profile, minimal anesthesia, and low cost as compared to conventional eradicative surgical procedures or radiation therapy.1,13,14 However, clinical efficacy of cryotherapy is undermined by frequent overtreatment of neighboring healthy tissues and organs during alternating cycles of deep freezing and thawing.15,16 Improved clinical outcomes of cryotherapy could be achieved by employing an adequate temperature mapping technology capable of monitoring the entire affected region in real time. The clinical procedure for cryoablation of prostate cancer involves the following steps. First, the surgeon positions a transrectal US probe, measures dimensions of the prostate, and captures key reference images in transverse and sagittal sections of the prostate. Next, according to the prostate geometry and suspected or known location of the lesion, the surgeon inserts transperineally five to seven cryoprobes, while monitoring cryoprobe positioning with the US. The cryoprobes are located at a safe distance (not less than 5 mm) from the vulnerable structures of the urethra and rectal wall. Two to three thermal sensors are inserted near the lesion, urethra, and rectal wall. The surgeon confirms with cystoscopy the absence of perforation in the urethra and the bladder and inserts the urethral warming catheter. The first freezing cycle is activated until the thermal sensor positioned near the lesion starts showing targeted lethal temperatures below . Simultaneously, the US image is carefully monitored to assure that the expanding ice ball does not reach the rectal wall. When the targeted low temperatures are achieved, the cryosystem is switched into the active thawing cycle by circulating helium inside the cryoprobes. The active thawing cycle continues until all the thermal sensors display temperatures above 0°C. Then the freezing cycle is repeated followed by passive thawing. Temperature levels of , , and 0°C are of particular importance during cryoablation, since they are associated with intra- and extracellular crystallization, vascular damage, and apoptosis, respectively.17,18 Mapping those isotherms over the US image of the prostate in real time would provide an extremely valuable feedback for the surgeon. The temperature accuracy of is considered sufficient by many urologists to warrant effective destruction of malignancies, while preventing damage to important healthy tissues.2 Current routine clinical practice of cryoablation relies on a few discrete temperature readouts provided by thermal needle sensors, which are inserted directly into the treated prostate and nearby tissues. Additional control is provided by continuous monitoring of the leading edge of the forming ice ball using transrectal US imaging.5 To establish a higher level of procedural control, some experimental cryotherapy systems were upgraded to work with computed tomography or magnetic resonance imaging modalities, which enhanced monitoring of the ice ball and provided noninvasive temperature readouts.16,19–21 However, those methods required injection of an exogenous contrast agent, which could cause residual toxicity or allergic reactions. Moreover, the proposed imaging upgrades were extremely expensive, cumbersome, slow, and required development of special metal-free cryoprobes to avoid critical imaging artifacts. US imaging adapted for temperature-dependent spatial variations of speed of sound was also considered as a potential method for noninvasive temperature monitoring. However, development of that technique encountered significant difficulties associated with low sensitivity and the tissue-dependent nature of the speed of sound–temperature relationship; the behavior of the calibration function was found opposite for fat- and water-rich tissues.22,23 Optoacoustic tomography (OAT) is proposed here for real-time high-contrast temperature mapping of live vascularized tissue. OAT is a method that combines optical excitation and US detection to achieve deep in vivo imaging based on optical contrast of tissue. OAT images provide submillimeter spatial resolution, which is not degraded by light scattering.24–26 Strong near-infrared (NIR) optical absorption of hemoglobin is responsible for superior optical contrast of blood-rich tissues.27 In vivo penetration of NIR light allows optoacoustic (OA) imaging to interrogate tissues up to 4- to 6-cm deep.24,25 It was previously established that OA signals significantly change in magnitude when biological tissues are heated or cooled. The effect is explained by the temperature dependence of the thermodynamic parameters, contributing to the OA effect.28–32 OA thermometry was attempted on single cells in microscopy mode,33,34 as well as in tissue samples.35,36 Here, we present an approach for OA construction of temperature maps during cryoablation of vascularized tissues. To validate the approach, we (a) evaluate accuracy of OA thermometry for the adequate range of temperatures using phantoms mimicking vascularized tissues, (b) confirm intracellular compartmentalization of hemoglobin as a required condition for in vivo applicability of the technique, and (c) use the proposed method to demonstrate real-time temperature mapping during spatially heterogeneous cooling and cryoablation of tissue-mimicking phantoms. We hypothesize that OA thermometry can be performed in vascularized tissue due to exclusive compartmentalization of optically absorbing molecules of hemoglobin inside red blood cells (RBCs).37,38 Such spatial segregation of the dominant optical absorber inside stable cytoplasmic environment enables the universal temperature-dependent optoacoustic response (ThOR) of blood, which is manifested identically in all types of vascularized tissues regardless of the bulk tissue composition. The OA experiments, previously performed on homogeneous solutions of ionic compounds and hemoglobin, revealed the concentration-dependent character of ThOR.37 Additionally, the ThOR of hemoglobin solutions obtained while irradiating samples at an 805-nm laser wavelength was found independent of hemoglobin’s oxygenation. An 805-nm wavelength corresponds to the isosbestic point of hemoglobin, where its oxygenated and deoxygenated forms have equal optical absorptivities. Temperature-invariant optical absorbance of hemoglobin was another important aspect in selecting 805 nm for OA temperature monitoring of hemoglobin samples.39 In contrast to homogeneous hemoglobin solutions, the temperature of zero OA response in blood samples was found invariant with respect to hematocrit, or the concentration of RBCs, and was interpreted through the unique intracellular compartmentalization of hemoglobin.37 This finding was consistent with direct OA measurements of the Grüneisen parameter in suspensions of erythrocytes,40 which demonstrated negligibly small dependence on hemoglobin concentration: . The objective of the present studies is to establish a procedure providing accurate conversion of OA images of vascularized tissues to corresponding temperature maps and to validate the procedure for the clinically relevant range of temperatures, spatial temperature gradients, and time frames typical for cryoablation. A well-defined calibration curve for blood’s ThOR is crucial for accurate noninvasive OA thermometry of vascularized tissues. In the reported studies, we evaluate variation of ThOR for multiple blood samples. Using the established temperature calibration, spatially resolved real-time OA thermometry is demonstrated in tissue-mimicking phantoms subjected to slow and fast heterogeneous freezing. 2.Materials and MethodsThe samples of porcine blood were obtained from a local slaughterhouse on the day of experiments and aliquoted in 4-mL anticoagulating blood collection tubes containing sodium heparin 75 units of the United States Pharmacopeia (USP) (BD Vacutaine, Franklin Lakes, New Jersey). An additional 0.1 mL of 2000 USP sodium heparin (Alfa Aesar, Ward Hill, Massachusetts) solution in phosphate-buffered saline stabilized at pH 7.4 (Sigma-Aldrich, St. Louis, Missouri) was added to each tube to keep anticoagulant distributed on tube walls. The light microscope EVOS Cell Imaging System (Life Technologies Thermo Fisher Scientific Inc., Grand Island, New York) with objective was employed to observe the morphology of individual RBCs in diluted blood samples. During the studies of sample-to-sample variations in OA thermometry of blood, the experimental setup incorporated a thermostat tank cooled down from 40°C to at cooling rate using a chest freezer (CF-1510, Avanti, Miami, Florida). An aqueous solution of NaCl 23 wt. % was employed as an acoustic coupling medium to prevent freezing at low temperatures. Blood samples were hermetically sealed in ultrathin-wall () polytetrafluoroethylene (PTFE) tubes (Sub-Lite-Wall Tubing, Zeus, Orangeburg, South Carolina) of 0.635-mm inner diameter (ID). For spatially resolved temperature monitoring, we employed two types of tissue-mimicking phantoms with matrices fabricated from either polyvinyl chloride-plastisol (PVCP) or gelatin. The PVCP phantom matrix was prepared according to Ref. 41 with embedded PTFE tubes, which were later filled with blood samples. Gelatin from porcine skin (Sigma-Aldrich, St. Louis, Missouri) was used in preparation of gelatin 15-wt. % phantoms with of methylparaben added as a preservative.42 The gelatin phantom matrix was enriched with scattering and absorbing properties produced by titanium dioxide powder (KAI Tech Labs) and a suspension of gold nanorods (GNRs) made in our laboratory. At the laser wavelength of 805 nm, GNRs, homogeneously distributed in the phantoms, provided optical absorbance . Optical scattering in the phantoms was tuned to match tissue properties with the reduced optical scattering coefficient 42,43 by adding of . In the PVCP phantoms, spatial temperature distribution was induced by a silicone tube (ID 1.5 mm) embedded into the plastisol matrix parallel to the blood samples. The silicone tube served as a conduit for a refrigerated solution of sodium chloride, which was continuously circulated to maintain its low temperature creating a cylindrical heat sink inside the phantom. The 23 wt. % NaCl solution was precooled to at the inlet of the cooling tube and the temperature passively increased to at the outlet of the cooling tube on the other side of the phantom, when the peristaltic pump (Perista pump SJ-1211 Chromatograph ATTO, Sanyo Electronic Industries Co, Ltd, Japan) was set to rate. This experimental setup established cylindrically distributed temperature profiles inside PVCP phantoms with individual blood samples experiencing local temperatures between 30°C and 10°C. The maximum spatial temperature gradient in the field of view did not exceed due to low thermal conductivity of PVCP.44 The experiments with gelatin phantoms allowed spatial temperature gradients up to . Using a clinical cryoablation system (CryoCare®, HealthTronics, Austin, Texas), we were able to form ice balls in the gelatin phantoms. Fast local freezing was induced in the gelatin matrix by a single cryoneedle oriented parallel to the blood samples. The cooling rate at a distance of 1 to 3 mm from the cryoneedle was measured to be about . The ice ball expanded inside the phantom to a diameter of 2 to 3 cm within 5 to 6 min following the initiation of cryoablation procedure. OA imaging was performed using the laser OA imaging system (LOIS, TomoWave Laboratories, Inc., Houston, Texas). The setup allowed 128-channel real-time parallel data acquisition with , 40-MHz sampling rate, and up to . During ThOR studies on multiple blood samples, we used a 55-mm-long linear US probe with a central frequency of 5 MHz. Two rectangular fiberoptic bundles were attached on the sides of the probe forming a reflection-mode OA configuration. A pulsed Ti-sapphire laser (Spectra Wave, TomoWave Laboratories, Houston, Texas) was tuned to the isosbestic point of hemoglobin at 805 nm and produced 6 ns, 16 mJ per pulse laser radiation with a pulse repetition rate of 10 Hz. Blood samples were sealed inside 0.635-mm ID PTFE tubes and placed orthogonally to the imaging plane in two rows at 20 and 24 mm from a linear array of US detectors. The samples were illuminated by two optical fiber bundles with a cumulative laser fluence of . The schematic of the experimental unit was presented and described in detail in our previous publications.45,46 Two major sources of error—random noise of electronics and the systematic decrease of temperature provided by the cooling of interrogated samples—diminished the precision and accuracy of ThOR measurements and imposed limitations on the frame rate of OA thermometry. OA images could be acquired with a maximum frame rate of 10 Hz. Imaging phantoms at low cooling rates allowed implementation of averaging for reduction of OA data acquisition noise. For example, during calibration studies of blood’s ThOR, the cooling rate was . Setting the number of averaged OA frames () to 64 allowed temperature estimation with accuracy . On the other hand, temperature mapping during cryotherapy was performed in real time at 1 fps, which is equivalent to . In those studies, maximum cooling rates within the interrogated areas of a treated phantom could reach . Averaging OA frames in 1s intervals allowed temperature mapping with an accuracy of at least , which is adequate for clinical applications of cryoablation. In experiments designed to evaluate sample-to-sample variation of the proposed OA thermometry, OA images were acquired every 30 s while the temperature was slowly decreased. Reconstructed OA frames were . The ThOR was evaluated using median image intensity in a manually selected region of interest (ROI) containing only a cross section of the selected blood sample. Previously, we demonstrated that such a method of image analysis enables high-precision quantification of OA response.45 Prior to cooling, several frames were acquired at the initial temperature, and a reference subimage containing the ROI was reconstructed. The speed of sound at the initial temperature was approximately known. But it was further optimized to assure absence of visible distortions of the sample on the reference subimage. During the experiment, each image frame was reconstructed multiple times using the allowable range of speed of sound values. For each reconstruction, a digital two-dimensional cross-correlation of the image frame with the reference subimage was calculated. The speed of sound providing maximum cross-correlation coefficient across all the reconstructions was selected as a true speed of sound in the coupling medium for that particular frame. The reference subimage and the corresponding ROI were then repositioned to match the location of the cross-correlation maximum. The new position of the reference subimage was recalculated and used iteratively in all subsequent frames, allowing accurate recognition of the image pattern representing each particular sample even in the case of accidental sample displacement in the middle of the experiment. 3.Results3.1.Temperature-Dependent Optoacoustic Response of BloodWe evaluated the accuracy of the OA temperature monitoring technique by analyzing deviations of ThOR produced by blood samples from different animal subjects as compared to the calibration curve. We tested blood samples from five male and five female animals. ThOR of each blood sample was measured three times, and the average response was used in subsequent statistical analysis. To account for potential spatial variations of ThOR within the reconstructed field of view, three tubes were filled with the same blood sample and placed at different locations with respect to the OA probe. The samples were initially preheated to 40°C and then slowly cooled down to with simultaneous recording of OA images. The obtained ThOR curves were processed with a median filter with the kernel of and averaged three independent measurements to get a single ThOR for each animal subject. All 10 ThORs acquired from individual animal subjects were normalized at 37°C and plotted on the same graph [Fig. 1(a)] as a function of temperature. The data were fit to Eq. (1) to obtain the calibration constants37 where is the normalized optoacoustic intensity, is the temperature (°C), is the normalization temperature, []. In biological applications, it is prudent to select as the normal physiological temperature, for humans ; is the temperature of zero OA response and is the maximum thermal nonlinearity of ThOR in the temperature range . The parameters of the calibration curve were found to be and .Fig. 1(a) Sample-to-sample variation for the ThOR of blood measured for 10 animal subjects. The yellow dashed line is the calibration curve. Red dash-dotted line indicates zero OA image intensity. (b) Accuracy of a single temperature measurement using the OA technique represented by temperature residuals as a function of normalized OA image intensity. The red dashed lines indicate the 95% prediction interval for a single measurement.  Figure 1(b) shows temperature residuals representing the accuracy of individual temperature measurements achievable by the OA thermometry technique. The accuracy of individual temperature measurements is estimated using a 95% prediction interval. It is strongly dependent on a temperature range and improves from at normal physiologic temperatures to at temperatures below 10°C, which are the most important for monitoring during cryoablation. 3.2.Impact of Optoacoustic Thermometry and the Test Procedures on Morphology of the Red Blood CellsAccording to the proposed hypothesis, the universal thermal OA behavior of blood is based on compartmentalization of hemoglobin in RBCs;37,38 therefore, the integrity of RBCs must remain intact during the freezing procedure in order to maintain the validity of the calibration curve. The first symptoms of cellular damage appear as swelling or crenation of RBCs, which is caused by the thermally induced variation of transmembrane osmotic pressure.47,48 To evaluate the integrity of the erythrocytes constituting the interrogated blood samples, we performed three types of tests: (a) control incubation of samples at room temperature for the time duration equivalent to that of the longest OA thermometry experiment, (b) only deep cooling of blood samples, and (c) deep cooling of blood samples with laser illumination, providing the most accurate representation of the environmental conditions during OA thermometry. The cooling was performed at the same rate as in the experiments on evaluation of the blood’s ThOR. Microscopic examination of erythrocytes before and after cooling accompanied by the pulsed laser excitation produced evidence that RBCs retained their morphology under conditions associated with ThOR measurements; erythrocytes had no visible changes after cooling down to about [Figs. 2(a)–2(c)]. Fig. 2Light microscopy photographs () of porcine RBCs: (a) before the OA thermometry procedure, (b) following the deep cooling (down to ) only, and (c) after deep cooling accompanied by the pulsed laser irradiation at 805 nm. (d) Absorbance spectra of the blood plasma demonstrating absence of extracellular hemoglobin after the deep cooling and OA thermometry of blood samples. The utilized laser wavelength is indicated by the arrow. (e) and (f) Illustration of RBCs damaged by fast cooling () and heating, respectively.  If the membranes of erythrocytes had been injured, hemoglobin would be released into the plasma and would change its optical absorbance spectrum.38,47 We measured the optical absorbance spectra of supernatant blood plasma samples before and after ThOR measurements [Fig. 2(d)]. The absence of hemoglobin release from the erythrocytes into the blood plasma was demonstrated confirming the integrity of erythrocytes in the interrogated blood samples. To demonstrate the destructive effects of thermal ablation on RBC morphology, we performed the following manipulations: (i) a sealed thin-walled vial with a sample of RBCs was exposed for a period of 20 s to the sodium chloride solution refrigerated down to ; the sample vial was removed from the refrigerated solution and set on a lab bench until it reached room temperature; (ii) fast heating of erythrocytes deposited on a microscope glass slide was performed by exposing the slide to a stream of hot air (60°C). Both manipulations simulated severe and abrupt thermal damage of erythrocytes. The induced thermal shock caused RBC’s transition through contraction and star shaping toward final crenation during cooling [Fig. 2(e)] or through swelling toward membrane rapture and hemolysis during heating [Fig. 2(f)]. In summary, the performed experiments simulating various thermal conditions of RBCs followed by microscopy studies provided sufficient evidence that the measurements of blood ThOR were performed under adequate physiological conditions with all hemoglobin tightly packed inside the erythrocytes. 3.3.Optoacoustic Temperature Mapping in Phantoms Representing Vascularized TissueIn vitro validation of the proposed technique for noninvasive OA temperature mapping was performed in tissue-mimicking phantoms containing tubes filled with blood samples. We used both PVCP and gelatin phantoms. PVCP phantoms were developed to model slow cooling. Gelatin phantoms were used to test OA thermometry at high cooling rates produced by the clinical cryotherapy system Cryocare®. The PVCP phantom matrix allowed to create spatial temperature distribution with maximum temperature variations in the field of view. The control temperature readouts were acquired with thermocouples embedded inside the sample tubes. To create a heat sink, sodium chloride solution was refrigerated down to and pumped through a silicone tube inserted into the PVCP matrix parallel to the blood samples [Fig. 3(a)]. Fig. 3(a) A tissue-mimicking PVCP phantom contains ultrathin-wall PTFE tubes with blood samples and a silicone tube with circulated NaCl solution refrigerated down to . (b) Temperature inside the sample tubes as a function of cooling time estimated using OA thermometry with the blood’s ThOR (open symbols) and measured directly by fine gauge thermocouples placed inside the sample tubes (solid symbols). (c–e) Video 1 represented by sample OA frames acquired at the indicated time after the beginning of slow cooling; the temperatures of seven blood samples (circled cross-sections) are graphically illustrated using the “rainbow” color palette, which is scaled linearly from 8°C to 32°C. The blue square marks show the location of the heat sink. The big arrow in (c) marks direction of laser illumination (Video 1, MPEG, 644 KB) [URL: http://dx.doi.org/10.1117/1.JBO.21.11.116007.1]. 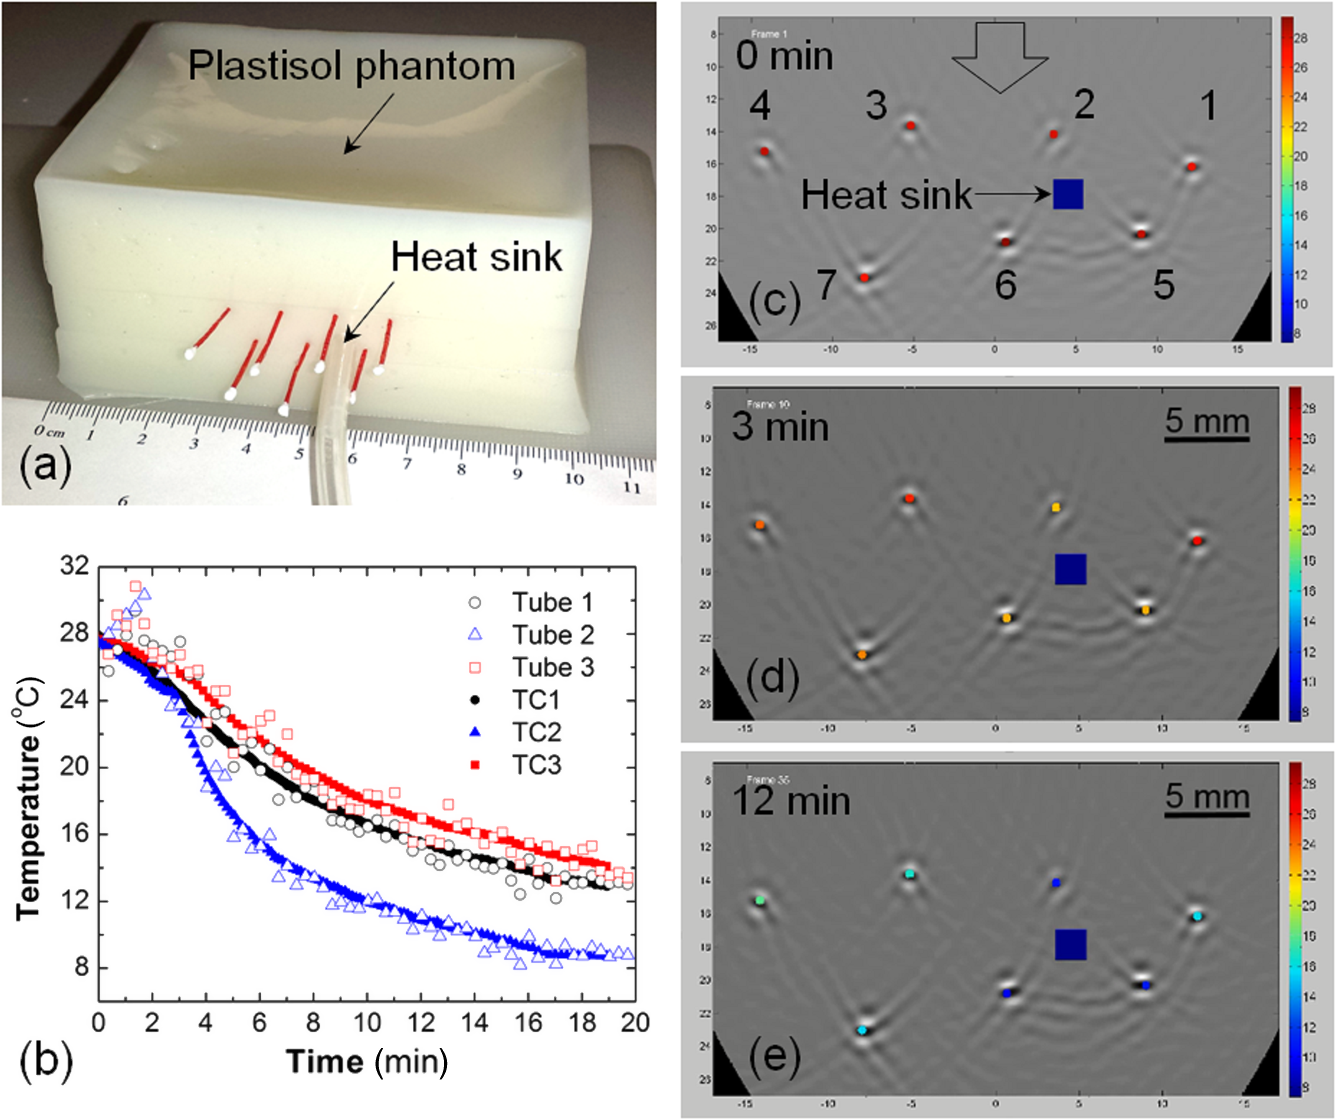 The experimental setup was modified for transmission mode of OA imaging. Normalized OA image intensity was estimated inside the sample tubes and converted to temperature using the found ThOR of blood. The temperature was mapped linearly over the standard “rainbow” color palette with blue color representing 8°C, red color representing 30°C, and intermediate temperatures represented by a green-yellow-orange triplet. Figures 3(c)–3(e) show optoacoustically measured temperatures of blood samples embedded in the PVCP phantom at the depths of 15 to 25 mm. Temperature maps are overlaid on top of the reconstructed OA images of the phantom and shown at different times after the initiation of cooling. OA temperature monitoring at a high cooling rate was performed on blood samples embedded in gelatin phantom matrices. A clinical transrectal US probe modified for OA imaging delivered laser light via two optical fiber bundles terminated in rectangular apertures, which were arranged on both sides of the linear array of transducers forming a reflection OA imaging mode [Fig. 4(a)]. The gelatin phantom [Fig. 4(b)] was prepared as a bulk matrix of 15 wt. % gelatin with finely dispersed powder reproducing scattering properties of live tissue.49 The ice ball [Fig. 4(c)] was generated in gelatin phantom by a standard clinical cryoneedle with a diameter of 3 mm. The argon gas was circulated inside the hollow interior of cryoneedle cooling its exposed terminal down to . OA data were acquired at the frequency of 10 Hz, and the averaging of 10 data frames generated a single image at 1-fps frame rate. The gelatin phantom incorporated five tubes with blood samples; their cross-sections were reconstructed with negative contrast in Figs. 4(d) and 4(e). Fine-gauged thermocouples were inserted inside each tube near the imaging plane of the OA probe to characterize temperatures of each sample directly and to provide reference readouts for the OA thermometry. Fig. 4(a) Transrectal US probe upgraded with fiberoptic bundles shaped as two output apertures for reflection-mode OA imaging; the linear US detection array is in use. (b) Optically scattering gelatin phantom with an inserted cryoneedle; OA probe irradiates the phantom and registers OA signals from below. (c) The terminal four-cm-long tip of the cryoneedle freezes and generates an ice ball with volumetric profile and growth rate that can be observed in transparent 15 wt. % gelatin; when CryoCare system is set to 100% cooling power, the ice ball grows radially at an average rate of . The temperature of the ice ball’s surface is about , and the maximum temperature gradient reaches . (d) OA image showing cross-sections of five blood-filled tubes; arrow indicates the direction of laser illumination; cross-section of the cryoneedle is also visible. (e) OA image showing the blood-filled tubes while the ice ball propagated beyond the central tube. Time interval between the frames shown in (d) and (e) is 100 s. (f) The graph showing temperature-time profiles for the selected sample tubes: open marks represent OA image intensity converted to temperature through the blood’s ThOR calibration and solid marks represent thermocouple measurements inside the selected tubes. 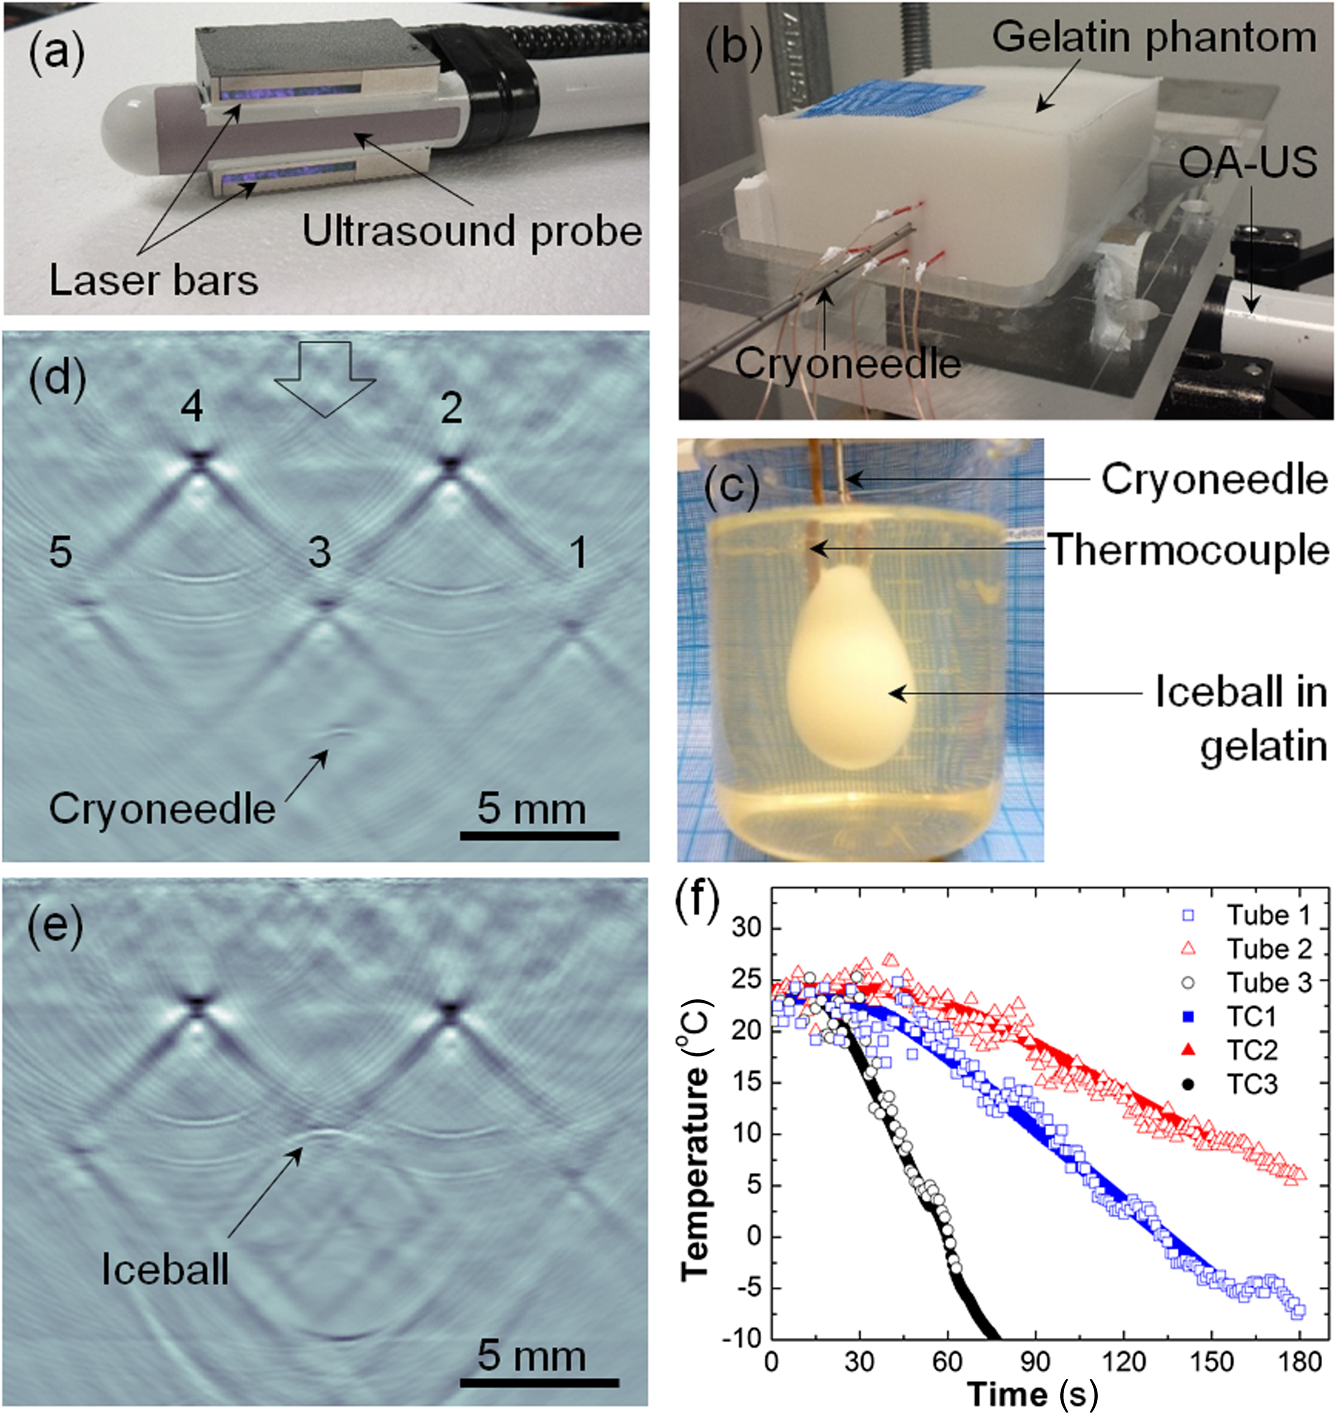 The results of real-time temperature monitoring obtained in the gelatin phantom during the first 3 min of cryoablation are shown in Fig. 4(f). Figure 4(e) also provides evidence that an ice ball can be clearly visualized using OA imaging. In summary, the OA thermometry in phantoms-mimicking vascularized tissue demonstrated excellent correlation as compared to direct thermocouple readouts for both slow and fast (cryotherapy) cooling rates. 4.DiscussionAccuracy of OA thermometry estimated for any single temperature map is a key quality characteristic justifying the feasibility of the technique for clinical applications. Previous studies on opto/photoacoustic temperature monitoring evaluated minimal temperature resolution or precision of temperature measurements, which primarily characterizes random noise of the used instrumentation.33,36,50 Precision of OA thermometry is defined by variations in temperature readings observed from a single spatial location on the same studied subject. It can be improved by increasing the number of data averages but cannot be employed to characterize accuracy of the technique. In our calibration experiments, we used 64 averages for each data frame. The precision of calibration data was on the order of , which is comparable to other reports33 and direct thermocouple readouts employed in clinical cryoablation. Using individual statistical fits for each dataset yields different functions describing the relationship between measured OA response and temperature. It is the variation of those individual functions estimated for multiple subjects that describes how accurately a technique can predict and map spatial distribution of temperature in each studied case. Both precision and accuracy of OA thermometry are affected by contrast-to-noise ratio of the OA images constructed for the interrogated region. Therefore, it is imperative that the studied live tissue is sufficiently vascularized and provides detectable OA images. In addition to the vascularization requirement, a sufficient amount of light must be delivered to the studied tissue to assure a strong OA response. In the case of prostate cancer cryoablation, OA thermometry could be integrated with US and administered transrectally. The technique is expected to be most effective for mapping temperature within the highly vascularized rectal wall and its immediately adjacent structures, enabling a physician with a new high-level procedural control aimed to prevent collateral damage to the healthy tissues.2 To the best of our knowledge, there are no reports disclosing the accuracy of a single temperature measurement obtained via an OA imaging technique. In these studies, we performed calibration of normalized OA image intensity versus local temperature using porcine blood samples acquired from 10 different animals. The 95% prediction interval is used as a metric of the technique’s accuracy for a single measurement in a random blood sample. In Fig. 1(b), the 95% prediction interval is shown bounded by the dashed lines for the entire range of normalized OA image intensities corresponding to the temperature range between and 37°C. Separately estimating the ThOR calibration curves for male and female porcine blood samples did not reveal statistically significant differences. Therefore, the obtained ThOR calibration curve can be universally applied for in vivo OA temperature monitoring in both male and female subjects. Figure 1(b) shows that the accuracy of temperature readings via the normalized OA image intensity significantly depends on the temperature range. It is known that for pure water the temperature relationship of the Grüneisen parameter can be approximated as a piece-wise linear function, with a higher slope (sensitivity of Grüneisen parameter to temperature) within the range from 0°C to 20°C than within the range from 20°C to 100°C.51 Specifically, the slope in the range from 0°C to 20°C is 1.48 times the slope in the range from 20°C to 100°C 50 and is in agreement with OA experiments. According to Ref. 50, a two-piece linear relationship of OA signals versus temperature was obtained for aqueous samples. The slope of the linear fragment constructed in the temperature range from 13°C to 22°C was 1.44 times the slope of the other linear fragment constructed in the range from 24°C to 46°C. Another study by Ke et al.36 showed that the normalized OA amplitude in water could be fitted into the equation in the range from 22°C to 34°C. The blood’s ThOR estimated in this work can be also approximated by a three-piece linear fit if divided as: , , and . The linear equations for normalized OA images, which represent OA pressure maps generated by vascularized tissue, can be expressed for each of the temperature ranges as following: The slope of the linear fragment of blood’s ThOR constructed in the temperature range from 0°C to 20°C is 2.59 times the slope of the linear fragment constructed in the range from 20°C to 40°C. The slope of the linear fragment of blood’s ThOR constructed in the temperature range from to 0°C is 4.41 times the slope of the linear fragment constructed in the range from 20°C to 40°C. The inverse function of local temperature versus normalized OA image intensity established for blood and blood containing tissue could be also approximated as a piece-wise linear function, but with the highest slope (sensitivity of temperature measurements to normalized OA intensities) within the range from 20°C to 40°C. Higher sensitivity of the OA temperature monitoring technique in that temperature range results in reduced precision and accuracy as seen in Fig. 1(b). Due to higher sensitivity, the same random noise and systematic errors of measured normalized OA image intensity would translate to higher noise and systematic errors in the estimated temperature. The residuals for the estimated calibration curve [Fig. 1(b)] reach 5°C in the temperature range 20°C to 40°C. In the proposed method of OA thermometry, that temperature range is important for accurate acquisition of the reference frame, which should be established with high averaging prior to initiation of a thermal therapy. Also, in clinical applications would be the temperature in the organ of interest (e.g., prostate) prior to the treatment. Since at normal physiological conditions, tissue temperature is tightly controlled by the regulatory mechanism, which is a part of broader homeostasis, no significant temperature gradients are present. The temperature is expected to be spatially homogeneous. If higher accuracy for is required, an additional control temperature needle sensor could be used to get initial measurement in a selected spatial location. The highest accuracy of the OA thermometry technique is associated with the temperatures below 0°C, which are in the range of particular interest during clinical cryoablation. The determined calibration function of the universal temperature-dependent OA response in blood is valid only while hemoglobin remains at a constant concentration as can be found in such natural capsules as RBCs. This means that the erythrocytes must remain intact for the entire period of cooling from 40°C to in order to assure accurate OA thermometry. Swelling or shrinking of RBCs with subsequent loss of the membrane integrity can happen due to thermally induced alteration of osmotic pressure.52 Low osmolarity produces a hypotonic extracellular environment facilitating swelling and eventual hemolysis of erythrocytes; high osmolarity creates hypertonic extracellular conditions, with erythrocytes undergoing shrinking and crenation. RBCs exposed to laser radiation in the course of deep cooling were examined before and after ThOR measurements (Fig. 2); integrity of RBCs was confirmed in that experiment. Quantitative validation of erythrocytes’ integrity after the cooling was carried out through measurements of optical absorption spectra in supernatant plasma collected before and after the procedure [Fig. 2(d)]; lack of induced hemolysis was demonstrated. The exemplary demonstration of erythrocytes destructed by fast heating or freezing is presented on the two last panels [Figs. 2(e) and 2(f)]. Note, that destruction of RBCs is expected to take place inside the ice ball forming in the course of cryoablation procedure. Therefore, the described OA thermometry could be performed only in nonfrozen vascularized tissue. Temperature dependence of normalized OA response in aqueous solutions and blood is fully described by the temperature dependence of the corresponding Grüneisen parameter. The proposed OA thermometry technique provides an insight only to relative changes of the Grüneisen parameter with temperature. The absolute value of the Grüneisen parameter was never estimated for the whole blood in a wide range of temperatures. The published data only report the Grüneisen parameter of whole and diluted blood measured at room temperatures and vary significantly: 0.124,40 0.140,53 and 0.166.54 The absence of variation of ThORs measured for the whole and diluted samples of blood indicates that the Grüneisen parameter of erythrocyte suspension is not affected by the concentration of hemoglobin, as long as hemoglobin molecules are compartmentalized inside RBC capsules.37 The proposed procedure of noninvasive temperature mapping was evaluated in tissue-mimicking phantoms of two types—one with a PVCP matrix and the other with a gelatin matrix. In terms of thermoacoustic properties, plastisol material is similar to fat,44,55 while the gelatin phantom is similar to vascularized tissue with higher water content.55 Both types of phantom matrices were acoustically transparent and had reduced optical scattering coefficients of about consistent with the properties of live tissue.56 The effect of optical scattering on the ThOR was previously studied in the temperature range from 30°C to 5°C using blood samples submerged in optically transparent and scattering media.38 Those studies validated that the ThOR curve is independent from optical scattering characteristics of the interrogated tissue. However, the precision of measurements in transparent media was about four times higher than in the scattering environment, showing there is a large room to improve the technique for future in vivo applications. Some factors that cause decreased performance of the OA temperature mapping in scattering medium include light attenuation resulting in reduced levels of optical fluence inside the tissue and an inability to focus the illuminating laser pulses within the imaging plane of the probe. Both of those factors diminish the signal-to-noise ratio of the OA images. The proposed two-step method of OA temperature mapping in vascularized live tissues consists of: (1) acquiring a reference OA frame at a well-known temperature prior to thermal therapy and (2) using the reference frame and the universal calibration curve of blood’s ThOR to convert each subsequent OA frame into a temperature map. The method was demonstrated by monitoring spatially heterogeneous cooling of a tissue-mimicking PVCP phantom, which contained a number of blood samples imitating individual blood vessels. Cooling was initiated immediately after the capture of the reference OA frame (step 1). During cooling, OA image intensity was continuously decreasing. To enable conversion of OA image data to temperature, OA image intensity was normalized to the reference frame data. Finally, using the calibration curve for blood’s ThOR, the normalized OA image intensity was converted to temperature maps (step 2) and visually represented using linearly scaled color palette (Fig. 3). Comparison of OA data to direct coregistered temperature measurements performed by thermocouples asserted the correctness of the temperature maps acquired with the noninvasive OA thermometry technique. We also validated OA thermometry by mapping temperature during cryoablation of a vascularized tissue phantom made of gelatin (Fig. 4). An ice ball was formed in the gelatin phantom [Figs. 4(c)–4(e)], and the temperatures were evaluated optoacoustically in nonfrozen neighborhood areas. Temporal temperature profiles estimated with OA thermography matched well to those measured by directly inserted thermocouples [Fig. 4(f)]. The speed of sound was individually optimized for each tube containing a blood sample only to quantify local temperature profiles using the OA technique and to validate those profiles versus direct temperature readings with thermocouples [graphs shown in Figs. 3(b) and 4(f)]. For the OA images shown in Figs. 3(c)–3(e) and 4(d)–4(e), a single sample subimage was selected and used with the optimization algorithm described in Sec. 2. Such an approach does not create an imaging problem in the case of spatially homogeneous cooling, like the one during the calibration of ThOR. However, it is not perfect in the case of heterogeneous cooling, like that performed on the PVCP and gelatin phantoms. The distortions of some tube samples, particularly those located closer to the heat sink may be seen in Fig. 3 (compare tubes 5 and 6 in panels c and e). That, of course, would reduce the accuracy of OA thermometry in heterogeneously cooled tissues. A more sophisticated image reconstruction algorithm accounting for thermally induced spatial variations of the speed of sound must be developed to maintain the image quality within the entire field of view at any temperature distribution. The presented in vitro results showed that OA thermometry applied via a two-step procedure is a promising noninvasive technique for accurate real-time mapping of tissue temperature during cryotherapy. However, enabling in vivo application of OA thermometry still requires some additional studies evaluating the effects of thermally triggered physiologic mechanisms that could impact the accuracy of the technique. Specifically, our next experimental efforts will be aimed at investigation of the role that is played by local and systemic thermal regulation in the process of maintaining tissue homeostasis during cryotherapy, and its causality with respect to the reference distributions of optical fluence and absorption within the interrogated areas of the treated tissue. For example, vasoconstriction would lead to reduced volumetric blood content of the affected tissue and, consequently, optical absorption coefficient interfering with the calibrated data of ThOR. Another critical study will be aimed at the role of thermally induced hemolysis and its magnitude during cryoablation, identifying the regions with minimally damaged blood vessels and erythrocytes, and enabling in vivo application of the universally calibrated ThOR of blood. Finally, susceptibility of the technique to motion artifacts will be also investigated, and registration algorithms will be developed using anatomical information provided by coregistered US imaging. 5.ConclusionIn this work, we studied the ThOR of blood with emphasis on sample-to-sample variation in porcine subjects. We estimated the parameters of the calibration curve using 30 independent measurements collected from 10 male/female blood samples. Gender-related trends were not observed in the behavior of the ThOR. Individual erythrocytes from the studied blood samples maintained their integrity and, therefore, intracellular compartmentalization of hemoglobin in the course of deep cooling during ThOR evaluation, which justified adequacy of the measurements and the proposed OA thermometry technique. We demonstrated that the accuracy of OA thermometry based on blood’s ThOR could be as high as for temperatures below 0°C. The average accuracy for a single temperature readout estimated for the entire interrogated range of temperatures (40°C to ) was . The proposed OA temperature monitoring procedure included two steps: (1) obtain the OA reference frame including the ROI at a certain known temperature and (2) normalize any subsequent OA frame to the reference frame and use the calibration equation to convert the normalized frame to the temperature map. Validation of the proposed methodology developed for temperature imaging with high spatio-temporal resolution was performed in tissue-mimicking phantoms. As a result, both water-based gelatin and fat-like PVCP phantoms demonstrated good agreement of OA temperature imaging with direct thermocouple readings. The presented results provide an important step toward future noninvasive temperature monitoring in live tissues. AcknowledgmentsThe authors would like to acknowledge the loan of the Cryocare® system from HealthTronics, Inc., Austin, Texas. Dr. Ermilov reports Grant No. 1R43CA177148 from the National Institutes of Health (National Cancer Institute), during the conduct of the study; nonfinancial support from HealthTronics, Inc., Austin, Texas, outside the submitted work. Dr. Ermilov has a financial interest in PhotoSound Technologies, Inc., which, however, did not support this work. In addition, Dr. Petrova and Dr. Ermilov have a patent WO 2015117070 A1 pending. Dr. Liopo and Dr. Nadvoretskiy disclose no financial or other conflicts. ReferencesA. C. S., “American Cancer Society. Learn about cancer. Prostate cancer,”
(2016) http://www.cancer.org/cancer/prostatecancer July 2016). Google Scholar
A. Mohammed et al.,
“Cryotherapy and its applications in the management of urologic malignancies: a review of its use in prostate and renal cancers,”
Urol. Oncol.: Semin. Orig. Invest., 32 39.e19
–39.e27
(2014). http://dx.doi.org/10.1016/j.urolonc.2013.04.004 Google Scholar
B. D. Fornage and K. K. Hunt,
“Image-guided percutaneous ablation of small breast cancer: which technique is leading the pack?,”
Technol. Cancer Res. Treat., 14
(2), 209
–211
(2015). http://dx.doi.org/10.7785/tcrt.2012.500395 Google Scholar
E. Liapi and J. F. Geschwind,
“Transcatheter and ablative therapeutic approaches for solid malignancies,”
J. Clin. Oncol., 25
(8), 978
–986
(2007). http://dx.doi.org/10.1200/JCO.2006.09.8657 JCONDN 0732-183X Google Scholar
D. Rukstalis and A. E. Katz, Handbook of Urologic Cryoablation, Informa Healthcare, New York
(2007). Google Scholar
V. Mouraviev, P. E. Spiess and J. S. Jones,
“Salvage cryoablation for locally recurrent prostate cancer following primary radiotherapy,”
Eur. Urol., 61 1204
–1211
(2012). http://dx.doi.org/10.1016/j.eururo.2012.02.051 EUURAV 0302-2838 Google Scholar
P. Cheetham et al.,
“Long-term cancer-specific and overall survival for men followed more than 10 years after primary and salvage cryoablation of the prostate,”
J. Endourol., 24
(7), 1123
–1129
(2010). http://dx.doi.org/10.1089/end.2010.0130 JENDE3 0892-7790 Google Scholar
S. Wenske, S. Quarrier and A. Katz,
“Salvage cryosurgery of the prostate for failure after primary radiotherapy or cryosurgery: long-term clinical, functional, and oncological outcomes in a large cohort at a tertiary referral centre,”
Eur. Urol., 64 1
–7
(2013). http://dx.doi.org/10.1016/j.eururo.2012.07.008 EUURAV 0302-2838 Google Scholar
D. A. Levy et al.,
“Definition of biochemical success following primary whole gland prostate cryoablation,”
J. Urol., 192 1380
–1384
(2014). http://dx.doi.org/10.1016/j.juro.2014.05.003 JOURAA 0022-5347 Google Scholar
B.-Z. Maytal,
“Advances in cryogenic engineering: fast Joule–Thomson cryocycling device for cryosurgical applications,”
Advances in Cryogenic Engineering, 911
–917 Springer Science & Business Media, Berlin, Heidelberg, Germany
(1998). Google Scholar
B. N. Roy, Fundamentals of Classical and Statistical Thermodynamics, John Wiley & Sons, Hoboken, New Jersey
(2002). Google Scholar
N. Doll et al.,
“Intraoperative cryoablation with a new argon probe,”
Ann. Thorac. Surg., 77 1460
–1462
(2004). http://dx.doi.org/10.1016/S0003-4975(03)01389-4 Google Scholar
C. B. Roberts et al.,
“Treatment profile and complications associated with cryotherapy for localized prostate cancer: a population-based study,”
Prostate Cancer Prostatic Dis., 14 313
–319
(2011). http://dx.doi.org/10.1038/pcan.2011.17 Google Scholar
J. B. Malcolm et al.,
“Quality of life after open or robotic prostatectomy, cryoablation or brachytherapy for localized prostate cancer,”
J. Urol., 183 1822
–1829
(2010). http://dx.doi.org/10.1016/j.juro.2009.12.102 JOURAA 0022-5347 Google Scholar
K. F. Chu and D. E. Dupuy,
“Thermal ablation of tumours: biological mechanisms and advances in therapy,”
Nat. Rev. Cancer, 14 199
–208
(2014). http://dx.doi.org/10.1038/nrc3672 NRCAC4 1474-175X Google Scholar
S. Sankineni et al.,
“Image-guided focal therapy for prostate cancer,”
Diagn. Interventional Radiol., 20 492
–497
(2014). http://dx.doi.org/10.5152/dir Google Scholar
D. Theodorescu,
“Cancer cryotherapy: evolution and biology,”
Rev. Urol., 6
(Suppl 4), S9
–S19
(2004). Google Scholar
A. T. Robilotto et al.,
“Temperature-dependent activation of differential apoptotic pathways during cryoablation in a human prostate cancer model,”
Prostate Cancer Prostatic Dis., 16 41
–49
(2013). http://dx.doi.org/10.1038/pcan.2012.48 Google Scholar
G. Onik,
“Image-guided prostate cryosurgery: state of the art,”
Cancer Control, 8
(6), 522
–531
(2001). Google Scholar
K. H. Zou et al.,
“Three-dimensional assessment of MR imaging-guided percutaneous cryotherapy using multi-performer repeated segmentations: the value of supervised learning,”
Acad. Radiol., 12 444
–450
(2005). http://dx.doi.org/10.1016/j.acra.2004.11.029 Google Scholar
J. Wei et al.,
“X-ray CT high-density artifact suppression in cryosurgery,”
Phys. Med. Biol., 47
(24), N319
–N326
(2002). http://dx.doi.org/10.1088/0031-9155/47/24/403 Google Scholar
N. R. Miller, J. C. Bamber and P. M. Meaney,
“Fundamental limitations of noninvasive temperature imaging by means of ultrasound echo strain estimation,”
Ultrasound Med. Biol., 28 1319
–1333
(2002). http://dx.doi.org/10.1016/S0301-5629(02)00608-7 USMBA3 0301-5629 Google Scholar
Y.-S. Hsiao and C. X. Deng,
“Calibration and evaluation of ultrasound thermography using infrared imaging,”
Ultrasound Med. Biol., 42
(2), 503
–517
(2016). http://dx.doi.org/10.1016/j.ultrasmedbio.2015.09.021 USMBA3 0301-5629 Google Scholar
A. Oraevsky,
“Optoacoustic tomography of the breast,”
Photoacoustic Imaging and Spectroscopy, Taylor and Francis Group, New York
(2009). Google Scholar
L. V. Wang, Photoacoustic Imaging and Spectroscopy, CRC Press, Taylor and Francis Group, Boca Raton, Florida
(2009). Google Scholar
L. V. Wang and S. Hu,
“Photoacoustic tomography: in vivo imaging from organelles to organs,”
Science, 335
(6075), 1458
–1462
(2012). http://dx.doi.org/10.1126/science.1216210 SCIEAS 0036-8075 Google Scholar
A. Roggan et al.,
“Optical properties of circulating human blood in the wavelength range 400–2500,”
J. Biomed. Opt., 4
(1), 36
–46
(1999). http://dx.doi.org/10.1117/1.429919 JBOPFO 1083-3668 Google Scholar
R. O. Esenaliev et al.,
“Real-time optoacoustic monitoring of photothermal laser-tissue interactions,”
Proc. SPIE, 3601 268
–274
(1999). http://dx.doi.org/10.1117/12.350008 Google Scholar
B. Soroushian, W. M. Whelan and M. C. Kolios,
“Study of laser-induced thermoelastic deformation of native and coagulated ex-vivo bovine liver tissues for estimating their optical and thermomechanical properties,”
J. Biomed. Opt., 15
(6), 065002
(2010). http://dx.doi.org/10.1117/1.3517455 JBOPFO 1083-3668 Google Scholar
B. Wang and S. Emelianov,
“Thermal intravascular photoacoustic imaging,”
Biomed. Opt. Express, 2
(11), 3072
–3078
(2011). http://dx.doi.org/10.1364/BOE.2.003072 BOEICL 2156-7085 Google Scholar
S. M. Nikitin et al.,
“Temperature dependence of the optoacoustic transformation efficiency in ex vivo tissues for application in monitoring thermal therapies,”
J. Biomed. Opt., 17
(6), 061214
(2012). http://dx.doi.org/10.1117/1.JBO.17.6.061214 Google Scholar
Y. S. Chen et al.,
“Environment-dependent generation of photoacoustic waves from plasmonic nanoparticles,”
Small, 8
(1), 47
–52
(2012). http://dx.doi.org/10.1002/smll.201101140 SMALBC 1613-6810 Google Scholar
L. Gao et al.,
“Single-cell photoacoustic thermometry,”
J. Biomed. Opt., 18
(2), 026003
(2013). http://dx.doi.org/10.1117/1.JBO.18.2.026003 JBOPFO 1083-3668 Google Scholar
L. Gao et al.,
“Intracellular temperature mapping with fluorescence-assisted photoacoustic-thermometry,”
Appl. Phys. Lett., 102 193705
(2013). http://dx.doi.org/10.1063/1.4807140 APPLAB 0003-6951 Google Scholar
Y. S. Chen et al.,
“Sensitivity enhanced nanothermal sensors for photoacoustic temperature mapping,”
J. Biophotonics, 6 534
–542
(2013). http://dx.doi.org/10.1002/jbio.v6.6/7 Google Scholar
H. Ke, S. Tai and L. V. Wang,
“Photoacoustic thermography of tissue,”
J. Biomed. Opt., 19 026003
(2014). http://dx.doi.org/10.1117/1.JBO.19.2.026003 JBOPFO 1083-3668 Google Scholar
E. V. Petrova, A. A. Oraevsky and S. A. Ermilov,
“Red blood cell as a universal optoacoustic sensor for non-invasive temperature monitoring,”
Appl. Phys. Lett., 105 094103
(2014). http://dx.doi.org/10.1063/1.4894635 APPLAB 0003-6951 Google Scholar
E. V. Petrova et al.,
“Universal temperature-dependent normalized optoacoustic response of blood,”
Proc. SPIE, 9323 93231Y
(2015). http://dx.doi.org/10.1117/12.2083594 Google Scholar
L. Cordone et al.,
“Optical absorption spectra of deoxy- and oxyhemoglobin in the temperature rance 300–20 K,”
Biophys. Chem., 24 259
–275
(1986). http://dx.doi.org/10.1016/0301-4622(86)85031-1 BICIAZ 0301-4622 Google Scholar
D.-K. Yao et al.,
“Photoacoustic measurement of the Grüneisen parameter of tissue,”
J. Biomed. Opt., 19
(1), 017007
(2014). http://dx.doi.org/10.1117/1.JBO.19.1.017007 JBOPFO 1083-3668 Google Scholar
G. M. Spirou et al.,
“Optical and acoustic properties at 1064 nm of polyvinyl chloride-plastisol for use as a tissue phantom in biomedical optoacoustics,”
Phys. Med. Biol., 50
(14), N141
–N153
(2005). http://dx.doi.org/10.1088/0031-9155/50/14/N01 Google Scholar
M. Jaeger et al.,
“Improved contrast deep optoacoustic imaging using displacement-compensated averaging: breast tumour phantom studies,”
Phys. Med. Biol., 56
(18), 5889
–5901
(2011). http://dx.doi.org/10.1088/0031-9155/56/18/008 Google Scholar
Q. Zhu et al.,
“Benign versus malignant breast masses: optical differentiation with US-guided optical imaging reconstruction,”
Radiology, 237
(1), 57
–66
(2005). http://dx.doi.org/10.1148/radiol.2371041236 RADLAX 0033-8419 Google Scholar
L. Maggi et al.,
“Ultrasonic attenuation and speed in phantoms made of PVCP and evaluation of acoustic and thermal properties of ultrasonic phantoms made of polyvinyl chlorideplastisol (PVCP),”
in Proc. IWBBIO 2013,
233
–241
(2013). Google Scholar
E. Petrova et al.,
“Using optoacoustic imaging for measuring the temperature dependence of Gruneisen parameter in optically absorbing solutions,”
Opt. Express, 21 25077
–25090
(2013). http://dx.doi.org/10.1364/OE.21.025077 OPEXFF 1094-4087 Google Scholar
E. V. Petrova et al.,
“Temperature dependence of Grüneisen parameter in optically absorbing solutions measured by 2D optoacoustic imaging,”
Proc. SPIE, 8943 89430S
(2014). http://dx.doi.org/10.1117/12.2039949 PSISDG 0277-786X Google Scholar
N. L. Gershfeld and M. Murayama,
“Thermal instability of red blood cell membrane bilayers: temperature dependence of hemolysis,”
J. Membr. Biol., 101 67
–72
(1988). http://dx.doi.org/10.1007/BF01872821 JMBBBO 0022-2631 Google Scholar
A. I. Zhmakin, Fundamentals of Cryobiology: Physical Phenomena and Mathematical Models, Springer, New York
(2010). Google Scholar
J. Mobley, T. Vo-Dinh,
“Optical properties of tissue,”
Biomedical Photonics Handbook, 2/1
–2/72 CRC Press, Boca Raton, Florida
(2003). Google Scholar
M. Pramanik and L. V. Wang,
“Thermoacoustic and photoacoustic sensing of temperature,”
J. Biomed. Opt., 14
(5), 054024
(2009). http://dx.doi.org/10.1117/1.3247155 JBOPFO 1083-3668 Google Scholar
CRC Handbook of Chemistry and Physics, 93rd ed.CRC Press, Boca Raton, Florida
(2004). Google Scholar
A. Pribush, D. Meyerstein and N. Meyerstein,
“Kinetics of erythrocyte swelling and membrane hole formation in hypotonic media,”
Biochim. Biophys. Acta Biomembr., 1558 119
–132
(2002). http://dx.doi.org/10.1016/S0005-2736(01)00418-7 Google Scholar
E. A. Savateeva et al.,
“Optical properties of blood at various levels of oxygenation and sedimentation rate studied by time-resolved detection of laser induced thermoelastic stress,”
Proc. SPIE, 4618 63
–75
(2002). http://dx.doi.org/10.1117/12.469849 PSISDG 0277-786X Google Scholar
Y. Villanueva et al.,
“Integrating sphere-based photoacoustic setup for simultaneous absorption coefficient and Grüneisen parameter measurements of biomedical liquids,”
Proc. SPIE, 9323 93232L
(2015). http://dx.doi.org/10.1117/12.2078942 PSISDG 0277-786X Google Scholar
T. Oruganti et al.,
“Speed of sound and acoustic attenuation of compounds affected during optoacoustic monitoring of thermal therapies measured in the temperature range from 5°C to 60°C,”
Proc. SPIE, 9323 932331
(2015). http://dx.doi.org/10.1117/12.2083375 PSISDG 0277-786X Google Scholar
J. R. Cook, R. R. Bouchard and S. Y. Emelianov,
“Tissue-mimicking phantoms for photoacoustic and ultrasonic imaging,”
Biomed. Opt. Express, 2
(11), 3193
–3206
(2011). http://dx.doi.org/10.1364/BOE.2.003193 BOEICL 2156-7085 Google Scholar
BiographyElena Petrova received her PhD from Lomonosov Moscow State University with a major in physics. Her scientific interests include the development of biomedical imaging techniques, functional optoacoustics, physicochemical properties of solutions, crystallization, and phase transitions. Anton Liopo worked as a senior and lead scientist at TomoWave Laboratories. His scientific expertise includes applications of nanobiotechnology for opto/photo acoustic imaging and sensing, toxicology, and investigation of the structural and functional changes of cells membranes. Currently, he holds a position of visiting scientist at Rice University and a principal scientist at the Pinami LLC, Houston, Texas. He has more than 75 publications, including a book and two book chapters. Vyacheslav Nadvoretskiy received his PhD in mathematics and physics from Moscow Technical University of Electronics and Computer Science. His scientific expertise includes computer modeling, algorithm development, processing and analysis of biomedical ultrasound and optoacoustic data. Sergey Ermilov received his PhD in bioengineering from Rice University, Houston, Texas. His scientific interests are focused on development of biomedical optical and optoacoustic imaging technologies. His specific areas of expertise include theoretical aspects, computer modeling, signal and image processing, and image reconstruction. |


