|
|
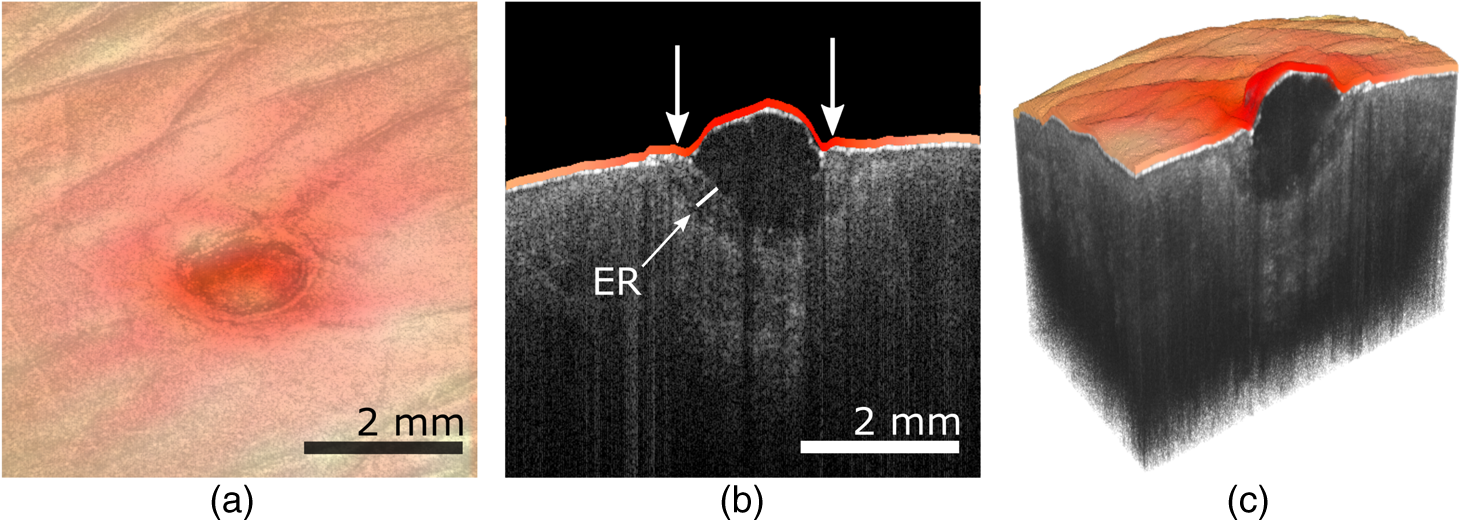
1.IntroductionOver the last decade, optical coherence tomography (OCT) has developed into a significant clinical imaging modality. For example, it has become a primary technique to investigate the eye1 and blood vessels,2and many applications are emerging in laryngology,3 gastroenterology,4,5 dentistry,6 and many other fields of medicine. OCT has the ability to image organs in three-dimensions (3-D), with a resolution of a few micrometers, and a penetration depth of several millimeters at video rate acquisition speeds.7 However, while OCT is a very powerful technique to assess sample morphology, it gives access to little molecular information. In contrast, hyperspectral imaging (HSI) is an imaging method that provides two-dimensional images of a sample in multiple wavelength bands.8 A reflectance (or fluorescence) spectrum is associated with each pixel and conveys information on molecules present locally, but without depth discrimination. The technique has been successfully applied in cancer detection,9–11 diagnosis of circulatory and12–14 retinal15–17diseases, and surgical guidance.18–20 As OCT and HSI give access to complementary information, their combination could improve their prowess in a clinical context. Spectroscopic OCT is one way to combine both techniques and consists of using the same laser and detectors for OCT and spectroscopy.21–24 Such implementation requires different signal processing of the same original data to obtain depth-resolved hyperspectral images and OCT images.25 However, few sources suitable for OCT have the large bandwidth required for meaningful spectral analysis. The use of such sources is also challenging due to the dispersion management required in OCT. Furthermore, to allow millimeter-long penetration depth, the central wavelength of the OCT source must be in the near-infrared region (NIR). However, many biological absorbers show fewer spectral variations in the NIR than in the visible range, and would therefore not be identifiable using this spectral band. In this paper, we describe an alternative strategy to implement HSI and OCT using two different sets of light sources and detectors with both channels combined into a single imaging probe. This allows choosing the spectral bands for OCT and HSI independently. While other groups have reported combining OCT and HSI in free-space systems,26,27 we present an all-fiber implementation based on a double-clad fiber (DCF). DCFs support two communication channels: a single-mode channel in the core and a multimode channel in the inner-cladding. Using a double-clad fiber coupler (DCFC), it is possible to address both channels efficiently.28–30 The viability of dual-modality systems based on DCFCs was already demonstrated in systems coupling OCT and fluorescence,31,32 or OCT and laser marking.33 The robustness and compactness of these all-fiber systems facilitate their integration into standard clinical instruments.28 We herein present the first combination of HSI and OCT in a single-optical fiber component using a DCFC. OCT acquisition is realized with a swept-source system and uses the DCF core for illumination and collection of the backscattered photons. For HSI acquisition, an external white light source is used to illuminate the sample. The reflected light is collected by the DCF inner-cladding, extracted by the DCFC into a multimode (MM) fiber and sent to a spectrometer for detection. The performance of the system is demonstrated by imaging healing epithelial tissue on the hand of a volunteer. 2.Methods2.1.Imaging SetupThe imaging setup is shown in Fig. 1. It is based on a commercial OCT system (OCM1300SS, Thorlabs, New Jersey) and uses a wavelength-swept laser centered at 1325 nm with a bandwidth of 100 nm, a coherence length of 6 mm, and an axial scanning (A-line) rate of 16 kHz. This system was modified to enable HSI by inserting a DCFC in the sample arm. The DCFC (DC1300LEB, Thorlabs, New Jersey) is made by fusing and tapering a DCF and an MM fiber.29 The diameters of the DCF core, inner-cladding, and outer-cladding are 9, 105, and , respectively. The MM fiber has a core diameter of . The cladding mode extraction efficiency of the DCFC (cladding mode transmission from port S to port B) is higher than 60% while the injection loss of the core signal (core mode losses from port A to port S) is lower than 0.5 dB. Fig. 1Optical setup: Ref, reference arm port; Smp, sample arm port; SM, single-mode fiber; MM, multimode fiber; DCF, double-clad fiber; DCFC, double-clad fiber coupler; C1 and C2, collimation lenses; G, dual-axis galvanometers; L, focalization lens; R, retroreflector prism; LF, light guide fiber.  The output of the wavelength-swept laser is sent to an external Michelson type interferometer module (INT-MSI-1300, Thorlabs, New Jersey) that splits the light into the sample and reference arms and also includes a 15-MHz balanced detector. An SMF-28 fiber is connected to the sample arm output of the interferometer module using an FC-APC connector and fusion-spliced at the other end to the DCF input of the DCFC (port A). The DCF output (port S) of the DCFC is then collimated with a 16-mm focal length fiber collimation lens (C2: FC260APC-C, Thorlabs, New Jersey). A dual-axis galvanometer is used to steer the beam (G: GVS002, Thorlabs, New Jersey). An uncoated, 50-mm focal length planoconvex lens (L: LA1131, Thorlabs, New Jersey), placed at one focal length of the galvanometer, is used to focus the beam on the sample for a telecentric scan. The light backscattered by the sample is collected by the fiber core and cladding, but only the signal collected in the core can travel back to the OCT interferometer. Light in the cladding is either transferred to the MM branch of the DCFC or lost at the splice between the DCF and the SMF-28 fiber. The reference arm is composed of an SMF-28 fiber that matches the sample arm dispersion. Since the double-clad and SMF-28 fibers have the same dispersion characteristics, the length of the SMF-28 fiber in the reference arm is simply the sum of all SMF-28 and DCF segments in the sample arm. No dispersion compensation method was used. The interference from the two arms is detected by a dual-balanced detector. The commercial OCT engine performs acquisition, processing, and display. HSI acquisition is performed using an external white light source (MKII fiber optic light, Nikon Inc., New York). The broad illuminated area is sampled by imaging the face of the DCF (port S) onto the sample using two galvanometer-mounted mirrors. Light reflected from each point is collected primarily by the inner-cladding of the DCF due to the high area ratio between the inner-cladding and the core. Light from the inner-cladding is rerouted to an MM fiber by the DCFC and sent to a spectrometer (Maya2000, Ocean Optics, California). This spectrometer performs continuous 2064-point spectral measurements at a rate of 125 Hz. Despite the spectrometer’s bandwidth spanning from 200 to 1100 nm, the useful bandwidth of the system spans from 450 to 800 nm due to the system’s spectral response and the lamp’s spectrum. In the current implementation, HSI and OCT acquisitions are performed sequentially and the sample is immobilized to reduce potential motion artifacts throughout the acquisitions. Both OCT and HSI use the same scanning mechanism and share a field of view of . Both the OCT source and the external halogen lamp are active during the acquisition to assess possible cross-talk between modalities. The built-in software of the commercial system is used to acquire the OCT data. HSI acquisition is realized with custom software (LabVIEW, National Instruments, Texas). The OCT volumes are and the acquisition is performed in less than 20 s. The hyperspectral images are in size over the same field of view and were acquired in 45 s. Additionally, 10 adjacent spectral pixels are binned together to increase signal-to-noise ratio and decrease the total size of the HSI data set, resulting in a spectral resolution of 4.3 nm. The number of pixels acquired in HSI was limited to to reduce acquisition time and potential motion artifacts. 2.2.Image ProcessingThe acquired reflectance spectra were corrected for background noise and for the spectral response of the system, using Eq. (1) where , , , and are the corrected reflectance, the sample reflected intensity, the recorded intensity when no sample is placed in front of the objective, and the reflected intensity of a sample with a flat spectral response (Spectralon, Labsphere, New Hampshire). From the reflectance spectrum, it is possible to simulate the reflected spectral power distribution for any illumination condition and determine the color the sampled region would appear to the human eye. This conversion was achieved by transforming each HSI spectrum into standard Red Green Blue (sRGB) color coordinates34 using standard CIE1931 (CIE: International Commission on Illumination) spectrum-to-color coordinate transformation.Beyond the simple appearance of the sample under a certain illumination, the HSI data can be used to perform molecular analysis of the sample. Dawson et al.35 showed, using a simplified skin model, that the logarithm of the inverse reflectance (LIR) is roughly proportional to the sum of the absorbance of the skin constituents [see Eq. (2)]. The same idea was used to highlight molecular constituents in the sample by producing images at wavelengths corresponding to absorption peaks of the target molecule. 2.3.Combined Optical Coherence Tomography and Hyperspectral Imaging Volumetric DataThe OCT and hyperspectral datasets were combined by overlaying the spectral information in sRGB format onto the surface of OCT slices. To obtain the surface topography from the OCT data, we implemented a custom surface detection algorithm based on the intensity and the first-order derivative of the signal as well as the relative position of the surface pixels to their closest neighbors. Surface detection was performed on the average of three adjacent B-scans further processed using a median filter in the axial direction. For each A-line, the OCT signal above the surface was set to zero. Processing all A-lines in this manner resulted in a topographic map of the sample. As the HSI and OCT acquisitions shared the same scanning mechanism and field of view and the sample was tightly immobilized throughout the sequential acquisition, the output of both methods were coregistered. After resizing the RGB image produced from HSI data using bilinear interpolation, each individual color pixel was assigned to the corresponding A-line, then 7 pixels just above the surface axial position were colored using the assigned value from the RGB image. The number of pixels overlaid over the surface was chosen to improve visibility while minimizing the loss of topographic information. All algorithmic steps were performed using MATLAB®. 3.Results3.1.System Performance AnalysisIn OCT, the numerical aperture of the beam in the sample space is . This numerical aperture results in a theoretical lateral resolution of (defined as the 10% to 90% distance of the edge response for a Gaussian point spread function). The theoretical axial resolution of the OCT system remains unchanged with respect to the commercial system with a theoretical value of in air. Using the 10% to 90% distance of an edge response, the measured experimental lateral resolution in OCT is . The experimental axial resolution in OCT is , measured as the full width at half maximum of an A-line for a perfect reflector. The slight loss in axial resolution could be explained by a small dispersion mismatch between the sample and reference arm induced by the addition of the DCFC. Assuming a uniform illumination distribution on a flat sample, the theoretical lateral resolution in HSI is given by the diameter of the image of the DCF inner-cladding on the sample and is . The measured experimental lateral resolution for HSI is . This resolution was measured using the 10% to 90% distance of an edge response on a sharp interface of a hyperspectral image. 3.2.Combined Optical Coherence Tomography and Spectral ImagingA healing epithelial wound on the hand was imaged to evaluate the performance of the system. The subject rested his hand on a microscope slide to help reduce movement artifacts throughout both OCT and HSI acquisitions. The reference arm delay was adjusted to position the objective focal plane just passed the zero-delay plane of OCT. The microscope slide was then placed at the focus by positioning the hand surface a few hundred microns below the zero-delay plane. The two white-light illumination fibers were placed at an angle on each side of the sample to avoid the collection of specular reflection and provide a uniform illumination over the imaged area. A 3-D acquisition was then performed using the OCT engine, rapidly followed by HSI acquisition. OCT and HSI acquisitions could not currently be realized simultaneously due to differences in integration times associated with each modality, a challenge that would be lifted with custom-built systems. Figure 2(a) shows an image of the healing wound taken with a CCD camera under ambient light conditions. Figure 2(b) displays a typical B-scan of the hand acquired with OCT. A maximum intensity projection was realized to produce en-face images from the OCT C-scan [Fig. 2(c)]. En-face true-color reconstruction was extracted from the HSI data [Fig. 2(d)]. Figure 2(e) plots the LIR representation as a function of wavelength in two regions of interest (ROIs) of the HSI image [shown in Fig. 2(d)] and a typical absorption spectrum of oxygen-saturated hemoglobin.36 Figure 2(e) shows that LIR representation is an adequate approximation to recover the absorption spectrum of the imaged tissue, which is, in this case, mostly composed of hemoglobin. From the absorption spectrum, one could retrieve the relative proportion of the main tissue constituents using spectral unmixing.37 Using the LIR representation, it is possible to detect specific absorption peaks in the sample and assess the presence of a specific absorber. For example, Fig. 2(f) shows the LIR image obtained at 575 nm [vertical line in Fig. 2(e)] which corresponds to an absorption peak in the hemoglobin absorption spectrum and gives insight on the distribution of hemoglobin in the sample. However, one should be careful interpreting Fig. 2(f) as it does not decouple the effect of the sample’s topology on the absorption spectrum and some of the small features observed in Fig. 2(f) could be caused by shadows induced by the irregular surface of the sample. Fig. 2OCT and HSI images from a healing epithelial wound: (a) ambient CCD image, (b) typical OCT B-scan, (c) en-face OCT reconstruction, (d) en-face RGB image reconstructed from HSI data, (e) LIR representation as a function of wavelength for two ROIs identified in (d), (f) en-face LIR image at 575 nm, identified as the dashed line in (e). Scale bars are 2 mm. (b) Corresponds to the section-plane represented by the blue line in (c). 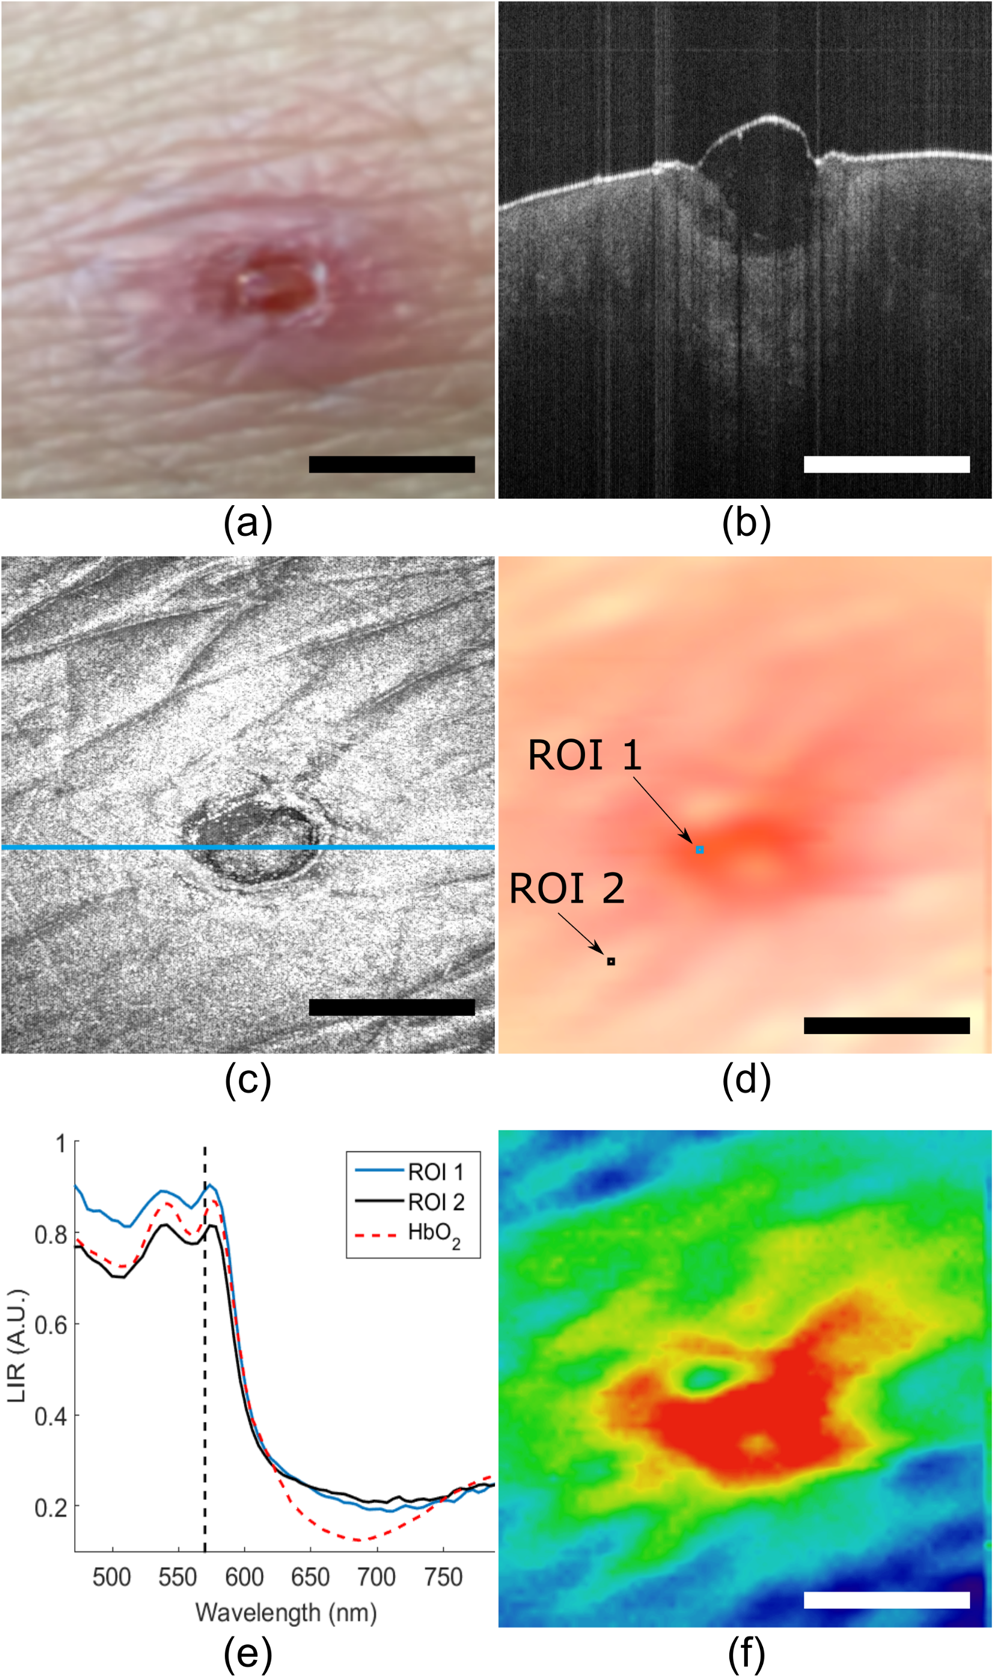 Figure 3 shows the combination of OCT and HSI. Figure 3(a) was obtained by overlaying the RGB image [Fig. 2(d)] and the OCT en-face projection [Fig. 2(c)] and adjusting the transparency of both layers. A 7-pixel-wide region just above the surface of an OCT B-scan was colored using the true-color information obtained with HSI [Fig. 3(b)]. The same overlay can be applied in 3-D, as shown in Fig. 3(c). 4.DiscussionOCT is a powerful tool to describe the 3-D structure of a sample with high resolution. In the case of the healing epithelial wound, OCT provides the surface sample topology and the quantitative dimensions of the lesion. The OCT cross-sections enable the detection of what appears to be an epithelial regrowth just underneath the wound [indicated by ER on Fig. 3(b)]. Except for the general position and dimension of the wound, this information is not present in the HSI image. However, HSI enables the detection of what might be inflammation in the area surrounding the wound that is otherwise invisible in OCT, as indicated by the arrows above the surface of the tissue in Fig. 3(b). In future work, HSI data could be correlated to the sample’s absorption, fluorescence, and scattering properties, thus giving access to quantitative diagnostic information about a given tissue’s pathology38–41 and enabling molecular imaging of biological absorbers of interest such as hemoglobin, melanin, or other contrast agents (exogenous or endogenous). The acquisition of a complete set of volumetric data requires about 65 s. In order to be used in a clinical trial, the system should be able to acquire both the HSI and OCT data under a few seconds. A first improvement toward this goal would be to acquire both modalities simultaneously. This should be easy to address, as this only a software issue: no image degradation was observed due to cross-talk between the OCT and HSI channels since the working spectral bandwidths of HSI and OCT are more than 400 nm apart. Furthermore, the current HSI acquisition speed was limited by the spectrometer refresh rate (125 Hz). Line scan cameras with line rates higher than 100 kHz are commercially available (Piranha4, Teledyne DALSA, Ontario, Canada) and would allow synchronous HSI and OCT acquisitions. Because computational complexity of HSI is small compared to the OCT signal processing, OCT images overlaid with HSI data could be displayed in real-time, and provide clinicians with valuable molecular information coregistered to the OCT structural data. Moreover, simultaneous acquisition would eliminate any potential motion-induced discrepancies between both modalities, making them naturally coregistered. The imaging setup presented in this paper used an external light source. The proposed method could readily be applied in clinical endoscopic procedures that already employ white light to illuminate the sample.42–44 Alternatively, one could replace the external source with a white-light laser (e.g., a supercontinuum laser) injected in the DCF core for HSI illumination. This would ensure a localized illumination and would help avoid the creation of shadows from the endoscope or the sample. Light throughput would also be improved as the illumination would be restricted to the RIO. Furthermore, illumination through the DCF core would eliminate the need for the external light source and enable the fabrication of sub-1-mm-diameter endoscopes combining OCT and HSI, as proven by other multimodal endoscope based on DCF fibers.31,32 The experimental lateral resolution of HSI is , which is quite coarse compared to the lateral resolution in OCT. The HSI lateral resolution could be improved by decreasing the size of the HSI collection spot (clad image on sample), but that would require increasing the OCT numerical aperture and consequently decreasing the OCT depth of field. Illuminating the sample using the fiber core, as proposed earlier, would reduce the size of the volume probed by the white-light, hence increasing the HSI resolution. In this case, the resolution would now be limited by size of the illumination spot on the sample while still enabling the collection of the scattered photons in the cladding. 5.ConclusionIn this work, we demonstrated the first combined OCT and HSI images collected via a single-optical fiber using a DCFC. The proposed method could be miniaturized into an endoscope with a diameter as small as 1 mm.45 The clinical potential of the combination of OCT and HSI arises from both modalities bringing complementary views of the sample: the first one giving access to sample morphology and the second to sample molecular composition. Their combination in a clinical setting could improve current diagnostic practice. For example, the information about remodeling due to a pathology (observed in OCT) could be merged with the change in molecular composition (observed in HSI), in order to allow earlier detection or more accurate diagnostics. HSI could also be used to infer the oxy/deoxyhemoglobin ratio in combination with the ability of OCT to observe vessels and quantify blood flow26 for a complete characterization of tissue perfusion. While future work using an improved simultaneous and real-time system is needed to demonstrate the usefulness of the technique in a clinical context, the encouraging preliminary results presented in this paper illustrates the potential of the combination of OCT and HSI using a DCFC for biomedical applications. AcknowledgmentsThis work was funded by the Canada Foundation for Innovation (CFI), the Natural Sciences and Engineering Research Council of Canada (NSERC), the Research Group in Biomedical Sciences and Technologies (GRSTB), and by the National Science Foundation Graduate Research Fellowship (NSFGRF). This work is an expanded and refined version of a proceeding published for a poster session at Photonics West 2016.46 Imaging of the finger of a healthy volunteer was approved by Ecole Polytechnique’s Ethics Committee under project #BIO-08/09-01. ReferencesP. Hrynchak and T. Simpson,
“Optical coherence tomography: an introduction to the technique and its use,”
Optom. Vis. Sci., 77 347
–356
(2000). http://dx.doi.org/10.1097/00006324-200007000-00009 JBOPFOOVSCET 1083-36681040-5488 Google Scholar
E. Regar et al.,
“Optical coherence tomography,”
Cardiovasc. Radiat. Med., 4 198
–204
(2003). http://dx.doi.org/10.1016/j.carrad.2003.12.003 Google Scholar
J. A. Burns,
“Optical coherence tomography: imaging the larynx,”
Curr. Opin. Otolaryngol. Head Neck Surg., 20 477
–481
(2012). http://dx.doi.org/10.1097/MOO.0b013e3283582d7d 1068-9508 Google Scholar
M. J. Gora et al.,
“Tethered capsule endomicroscopy enables less invasive imaging of gastrointestinal tract microstructure,”
Nat. Med., 19 238
–240
(2013). http://dx.doi.org/10.1038/nm.3052 1078-8956 Google Scholar
T.-H. Tsai, J. Fujimoto and H. Mashimo,
“Endoscopic optical coherence tomography for clinical gastroenterology,”
Diagnostics, 4 57
–93
(2014). http://dx.doi.org/10.3390/diagnostics4020057 Google Scholar
H. Nakagawa et al.,
“Validation of swept source optical coherence tomography (SS-OCT) for the diagnosis of smooth surface caries in vitro,”
J. Dent., 41 80
–89
(2013). http://dx.doi.org/10.1016/j.jdent.2012.10.007 Google Scholar
W. Wieser et al.,
“High definition live 3D-OCT in vivo: design and evaluation of a 4D OCT engine with ,”
Biomed. Opt. Express, 5 2963
(2014). http://dx.doi.org/10.1364/BOE.5.002963 BOEICL 2156-7085 Google Scholar
G. Lu and B. Fei,
“Medical hyperspectral imaging: a review,”
J. Biomed. Opt., 19 010901
(2014). http://dx.doi.org/10.1117/1.JBO.19.1.010901 JBOPFO 1083-3668 Google Scholar
M. E. Martin et al.,
“Development of an advanced hyperspectral imaging (HSI) system with applications for cancer detection,”
Ann. Biomed. Eng., 34 1061
–1068
(2006). http://dx.doi.org/10.1007/s10439-006-9121-9 ABMECF 0090-6964 Google Scholar
H. Akbari et al.,
“Hyperspectral imaging and quantitative analysis for prostate cancer detection,”
J. Biomed. Opt., 17 076005
(2012). http://dx.doi.org/10.1117/1.JBO.17.7.076005 Google Scholar
S. Kiyotoki et al.,
“New method for detection of gastric cancer by hyperspectral imaging: a pilot study,”
J. Biomed. Opt., 18 026010
(2013). http://dx.doi.org/10.1117/1.JBO.18.2.026010 JBOPFO 1083-3668 Google Scholar
D. Yudovsky, A. Nouvong and L. Pilon,
“Hyperspectral imaging in diabetic foot wound care,”
J. Diabetes Sci. Technol., 4 1099
–1113
(2010). http://dx.doi.org/10.1177/193229681000400508 Google Scholar
H. Akbari et al.,
“Detection and analysis of the intestinal ischemia using visible and invisible hyperspectral imaging,”
IEEE Trans. Biomed. Eng., 57 2011
–2017
(2010). http://dx.doi.org/10.1109/TBME.2010.2049110 IEBEAX 0018-9294 Google Scholar
M. S. Holzer et al.,
“Assessment of renal oxygenation during partial nephrectomy using hyperspectral imaging,”
J. Urol., 186 400
–404
(2011). http://dx.doi.org/10.1016/j.juro.2011.03.162 Google Scholar
W. R. Johnson et al.,
“Snapshot hyperspectral imaging in ophthalmology,”
J. Biomed. Opt., 12 014036
(2007). http://dx.doi.org/10.1117/1.2434950 JBOPFO 1083-3668 Google Scholar
D. Cohen et al.,
“The use of spectral imaging for the diagnosis of retinal disease,”
in 1999 IEEE LEOS Annual Meeting Conf. Proc. (LEOS 1999). 12th Annual Meeting. IEEE Lasers and Electro-Optics Society 1999 Annual Meeting (Cat. No. 99CH37009),
220
–221
(1999). Google Scholar
J. Schweizer et al.,
“Hyperspectral imaging—a new modality for eye diagnostics,”
Biomed. Eng., 57 293
–296
(2012). http://dx.doi.org/10.1515/bmt-2012-4375 Google Scholar
S. T. Monteiro et al.,
“Towards applying hyperspectral imagery as an intraoperative visual aid tool,”
in Proc. 4th IASTED Int. Conf. on Visualization, Imaging and Image Processing (VIIP),
483
–488
(2004). Google Scholar
S. V. Panasyuk et al.,
“Medical hyperspectral imaging to facilitate residual tumor identification during surgery,”
Cancer Biol. Ther., 6 439
–446
(2007). http://dx.doi.org/10.4161/cbt.6.3.4018 Google Scholar
K. J. Zuzak et al.,
“Active DLP hyperspectral illumination: a noninvasive, in vivo, system characterization visualizing tissue oxygenation at near video rates,”
Anal. Chem., 83 7424
–7430
(2011). http://dx.doi.org/10.1021/ac201467v ANCHAM 0003-2700 Google Scholar
U. Morgner et al.,
“Spectroscopic optical coherence tomography,”
Opt. Lett., 25 111
(2000). http://dx.doi.org/10.1364/OL.25.000111 OPLEDP 0146-9592 Google Scholar
C. P. Fleming et al.,
“Depth resolved detection of lipid using spectroscopic optical coherence tomography,”
Biomed. Opt. Express, 4 1269
(2013). http://dx.doi.org/10.1364/BOE.4.001269 BOEICL 2156-7085 Google Scholar
F. E. Robles et al.,
“Molecular imaging true-colour spectroscopic optical coherence tomography,”
Nat. Photonics, 5 744
–747
(2011). http://dx.doi.org/10.1038/nphoton.2011.257 NPAHBY 1749-4885 Google Scholar
D. J. Faber et al.,
“Light absorption of hemoglobin assessed by spectroscopic optical coherence tomography,”
Opt. Lett., 28 1436
–1438
(2003). http://dx.doi.org/10.1364/OL.28.001436 OPLEDP 0146-9592 Google Scholar
N. Bosschaart et al.,
“Quantitative comparison of analysis methods for spectroscopic optical coherence tomography,”
Biomed. Opt. Express, 4 2570
(2013). http://dx.doi.org/10.1364/BOE.4.002570 BOEICL 2156-7085 Google Scholar
M. C. Skala et al.,
“Combined hyperspectral and spectral domain optical coherence tomography microscope for noninvasive hemodynamic imaging,”
Opt. Lett., 34 289
–291
(2009). http://dx.doi.org/10.1364/OL.34.000289 OPLEDP 0146-9592 Google Scholar
P. Zhang et al.,
“In vivo wide-field multispectral scanning laser ophthalmoscopy-optical coherence tomography mouse retinal imager: longitudinal imaging of ganglion cells, microglia, and Müller glia, and mapping of the mouse retinal and choroidal vasculature,”
J. Biomed. Opt., 20 126005
(2015). http://dx.doi.org/10.1117/1.JBO.20.12.126005 JBOPFO 1083-3668 Google Scholar
S. Lemire-Renaud et al.,
“Double-clad fiber coupler for endoscopy,”
Opt. Express, 18 9755
(2010). http://dx.doi.org/10.1364/OE.18.009755 OPEXFF 1094-4087 Google Scholar
W.-J. Madore et al.,
“Asymmetric double-clad fiber couplers for endoscopy,”
Opt. Lett., 38 4514
(2013). http://dx.doi.org/10.1364/OL.38.004514 OPLEDP 0146-9592 Google Scholar
E. De Montigny et al.,
“Double-clad fiber coupler for partially coherent detection,”
Opt. Express, 23 9040
–9051
(2015). http://dx.doi.org/10.1364/OE.23.009040 OPEXFF 1094-4087 Google Scholar
D. Lorenser et al.,
“Dual-modality needle probe for combined fluorescence imaging and three-dimensional optical coherence tomography,”
Opt. Lett., 38 266
(2013). http://dx.doi.org/10.1364/OL.38.000266 OPLEDP 0146-9592 Google Scholar
L. Scolaro et al.,
“Molecular imaging needles: dual-modality optical coherence tomography and fluorescence imaging of labeled antibodies deep in tissue,”
Biomed. Opt. Express, 6 1767
–1781
(2015). http://dx.doi.org/10.1364/BOE.6.001767 BOEICL 2156-7085 Google Scholar
K. Beaudette et al.,
“Laser tissue coagulation and concurrent optical coherence tomography through a double-clad fiber coupler,”
Biomed. Opt. Express, 6 1293
–1303
(2015). http://dx.doi.org/10.1364/BOE.6.001293 BOEICL 2156-7085 Google Scholar
R. W. G. Hunt, W. G. Robert and M. Pointer, Measuring Colour, Wiley, Hoboken, New Jersey
(2011). Google Scholar
J. B. Dawson et al.,
“A theoretical and experimental study of light absorption and scattering by in vivo skin,”
Phys. Med. Biol., 25 695
–709
(1980). http://dx.doi.org/10.1088/0031-9155/25/4/008 PHMBA7 0031-9155 Google Scholar
S. Prahl,
“Optical absorption of hemoglobin,”
(1999) http://omlc.org/spectra/hemoglobin/ May 2016). Google Scholar
N. Keshava and J. F. Mustard,
“Spectral unmixing,”
IEEE Signal Process. Mag., 19 44
–57
(2002). http://dx.doi.org/10.1109/79.974727 ISPRE6 1053-5888 Google Scholar
C. Balas, C. Pappas and G. Epitropou, Handbook of Biomedical Optics, 131
–164 CRC Press, Boca Raton, Florida
(2011). http://dx.doi.org/10.1201/b10951-10 Google Scholar
V. Tuchin, Tissue Optics, SPIE, Bellingham, Washington
(2007). http://dx.doi.org/10.1117/3.684093 Google Scholar
D. G. Ferris et al.,
“Multimodal hyperspectral imaging for the noninvasive diagnosis of cervical neoplasia,”
J. Low. Genit. Tract Dis., 5 65
–72
(2001). http://dx.doi.org/10.1046/j.1526-0976.2001.005002065.x Google Scholar
M. C. Pierce et al.,
“Accuracy of in vivo multimodal optical imaging for detection of oral neoplasia,”
Cancer Prev. Res., 5 801
–809
(2012). http://dx.doi.org/10.1158/1940-6207.CAPR-11-0555 Google Scholar
M. Tsuboi et al.,
“Optical coherence tomography in the diagnosis of bronchial lesions,”
Lung Cancer, 49 387
–394
(2005). http://dx.doi.org/10.1016/j.lungcan.2005.04.007 Google Scholar
Y. Fradet et al.,
“A comparison of hexaminolevulinate fluorescence cystoscopy and white light cystoscopy for the detection of carcinoma in situ in patients with bladder cancer: a phase III, multicenter study,”
J. Urol., 178 68
–73
(2007). http://dx.doi.org/10.1016/j.juro.2007.03.028 Google Scholar
G. Tao et al.,
“Enhanced magnifying endoscopy for differential diagnosis of superficial gastric lesions identified with white-light endoscopy,”
Gastric Cancer, 17 122
–129
(2014). http://dx.doi.org/10.1007/s10120-013-0250-1 Google Scholar
K. L. Lurie et al.,
“Rapid scanning catheterscope for expanded forward-view volumetric imaging with optical coherence tomography,”
Opt. Lett., 40 3165
(2015). http://dx.doi.org/10.1364/OL.40.003165 OPLEDP 0146-9592 Google Scholar
G.-L. Robin et al.,
“Combined optical coherence tomography and hyper-spectral imaging using a double clad fiber coupler,”
Proc. SPIE, 9701 97010X
(2016). http://dx.doi.org/10.1117/12.2211758 Google Scholar
|