

|
|
1.IntroductionMedical imaging is continuously advancing along with newer technologies. The advances in medical imaging tools [x-ray computed tomography (x-ray CT), ultrasound (US), magnetic resonance imaging (MRI), positron emission tomography (PET), and single-photon emission computed tomography etc.] have led to better diagnosis and patient care.1–4 In the last decade, a new imaging technology called photoacoustic imaging (PAI) has evolved and is moving rapidly from the laboratory to preclinical and clinical phases.5–7 PAI is a three-dimensional (3-D) hybrid imaging modality that combines the advantage of optical and acoustic imaging. In PAI, a nanosecond laser illuminates the target sample (tissue/body parts). Due to absorption of incident light by the tissue chromophores (such as melanin, red blood cells, and water), there is a local temperature rise, which in turn produces pressure waves emitted in the form of acoustics waves [also known as photoacoustic (PA) waves]. By acquiring the generated PA waves at the tissue surface, images can be formed, revealing the internal structures and function. PAI provides anatomical, functional, metabolic, molecular, and genetic contrasts of vasculature, hemodynamics, oxygen metabolism, biomarkers, and gene expression.7,8 These unique advantages made PAI a potential tool for many applications in vascular biology, oncology, neurology, ophthalmology, dermatology, gastroenterology, and cardiology.7 The merits of PAI compared with pure optical and pure ultrasonic imaging modalities are: (i) it has high intrinsic optical absorption contrast, hence no labeling is required, (ii) it can provide better penetration depth (0.1 to 12 cm)9 compared to optical methods, such as optical microscopy, fluorescence microscopy,10 Raman microscopy,11,12 multiphoton microscopy,13 optical coherence tomography,14,15 and diffuse optical tomography,16 (iii) unlike US imaging, PAI is free from speckle artifacts, (iv) it is compact, faster, and less expensive compared with MRI, PET, and x-ray CT, (vi) it can provide both structural and functional information using multiwavelengths, (vii) it directly images optical absorption with 100% relative sensitivity and the sensitivity is two orders of magnitude greater than those of confocal microscopy and optical coherence tomography,7 and (viii) it can provide multiscale multicontrast images of biological structures, ranging from organelles to organs. Several comprehensive reviews on PAI can be found in the literature.6,7,17–22 Three types of PAI systems have been reported: (i) photoacoustic microscopy (PAM),23–39 (ii) photoacoustic endoscopy (PAE),40–45 (iii) photoacoustic tomography (PAT) or photoacoustic computed tomography (PACT).46–54 In PAM, both the laser excitation and acoustic detection are focused (tightly or loosely depending on the configuration), and the dual foci are configured confocally to enhance measurement sensitivity. Depending on whether the acoustic focus or optical focus is finer, PAM is categorized into acoustic-resolution PAM32,37–39 or optical-resolution PAM.24,30,34 Subwavelength PAM was also demonstrated to achieve nanometric resolution in PAM systems.55–58 Like PAM, PAE is used to image internal organs, such as, the esophagus and colon. Unlike optical endoscopy, PAE can provide much deeper imaging. A 7-mm deep PAE imaging was demonstrated in the dorsal region of a rat colon ex vivo.44 Both PAM and PAE are still limited to shallower imaging depth (with higher spatial resolution). For deep tissue, imaging PAT/PACT will be more suitable and hence holds a better chance to find a clinical application. This review will focus on the progress of the PAT system in recent years for translating into preclinical and clinical applications. In PAT, typically an expanded nanosecond laser beam illuminates the tissue surface homogeneously. PA waves are acquired around the tissue boundary using a wideband ultrasound transducer (UST). Generally, circular scanning geometry in orthogonal excitation mode is preferred for deep-tissue imaging. The acquired PA signals are used to reconstruct the initial pressure rise within the tissue. Usually, a single-element UST with circular scanning or a multielement UST array is used for PA signal detection. The progress in excitation laser technology (from Nd:YAG to LED), UST technology (from single-element to volumetric array), high-performance reconstruction algorithms made the PAT a low-cost, high-speed, portable device for biomedical applications. High-pulse energy (PE) Q-switched Nd:YAG lasers were commonly used as excitation sources for PAT. However, these lasers are expensive, bulky, and have low-repetition rate () which limits imaging speed. Pulsed laser diode (PLD)29,47,59–61 or light-emitting diode (LED)62 can be used as an alternative to Nd:YAG laser because they are less expensive, more compact, and have high-repetition rate for fast imaging. In standard PAT, single-element UST scanning in a circular geometry was used to collect PA signals from the sample. Later nonscanning PAT systems based on linear,63 semicircular,64 circular,65 and spherical array66 of USTs have been developed to avoid scanning for high speed imaging. PAT was also successfully integrated with clinical US imaging systems for clinical applications including but not limited to breast cancer imaging,64,67 brain imaging,68 and sentinel lymph node mapping etc.6,69,70 Recent reviews on various aspects of PAT can be found in the literature. In the last couple of years, several review articles on PAT applications, such as multiscale functional and molecular imaging,71 advanced PAT multimodal imaging,72 PAT for biomedicine,73 PAT principles and advances,74 PAT for small animal whole body imaging,75 PAT with imaging constant agents and recent applications,5 PAT for life sciences,76 PAT for real-time multispectral imaging,77 and clinical PAT for cancer78 were reported. To avoid overlapping with recent review articles on PAT, in this review we focus on the progress in preclinical and clinical PAT systems from the hardware point of view, along with their applications in the last couple of years. The review is organized in the following order: Sec. 2 discusses single-element UST-based preclinical PAT systems; in Sec. 3 we discuss US array-based preclinical PAT systems; Sec. 4 is dedicated to a translational clinical US system integrated with PAI and their applications; in Sec. 5, we will brifly discuss the commercially available PAT systems; and in Sec. 6, we conclude the review and discuss the future directions of PAT for clinical translation. 2.Single-Element Transducer-Based Preclinical PAT Systems2.1.SET-Based PAT System Using Nd:YAG LaserIt is a widely used configuration for laboratory and preclinical studies. Here the expanded laser beam irradiates the test sample, and the SET circularly rotates around the sample to collect PA signals at different angles. SETs have been widely used in PAT owing to low-cost, wide availability, and high sensitivity. In SET-based systems, A-lines PA signal can be acquired in two different ways: (i) stop-and-go scan:79,80 A stepper motor moves the UST to a predefined position, collects multiple PA signals for averaging, saves the A-lines, and moves the UST to the next position, (ii) continuous scan:81 the stepper motor rotates the UST continuously at predefined speed, collects PA signals while the UST is moving, and saves the A-lines once the rotation is complete. Signal averaging can also be done later if needed. Continuous scan is faster than the stop-and-go scan. However, care should be taken while choosing the scan speed in continuous scanning to minimize the blur due to the UST motion or due to averaging. The blur should be negligible compared to the imaging resolution or object size to be imaged. Because the SET has a large active area (to increase sensitivity), it impacts the tangential resolution, especially when the sample is far from the scanning center (or closer to the UST surface). To increase the signal acceptance angle (and improve the tangential resolution), a negative lens can be added to the transducer surface.82,83 More recently, a modified delay-and-sum reconstruction algorithm was proposed to improve the tangential resolution without using any negative lens or virtual US detector.84,85 Recently, a circular scanning-based PAT system [Fig. 1(a)] was demonstrated for the assessment of early dental lesion.86 A Q-switched Nd:YAG laser [, , , ] was used as an excitation source. The laser energy density on the surface of the sample was maintained at ( safety limit )87 to provide an effective penetration depth of no less than 9 mm. This is deep enough to cover the crown of a tooth, where the early lesions often happen. The PA signals were collected by a UST [central frequency () , bandwidth (BW) at , V310/Panametrics] while scanning around the tooth. The UST was moved around the tooth with 120 steps in a circle for one complete scan. The signals were amplified (SA-230F5, NF), and recorded by a data-acquisition (DAQ) card (PCI-5105, National Instruments) with sampling frequency of 60 MHz. The signals were averaged 40 times to reduce noise at each UST position. A linear stage was employed to control the position of the scanning plane of the tooth in the vertical direction. Fig. 1(a) Schematic diagram of the single-element UST-based PAT system. The PAT images of (b, c) a healthy and (d, e) a lesion tooth. (b, d) Mode-1 and (c, e) mode-2 PAT images. Reproduced with permission from Ref. 86.  The mode-1 and mode-2 images of a healthy tooth are shown in Figs. 1(b) and 1(c). The mode-1 contrast comes from the diversity of optical absorption; the mode-2 contrast is related to the microstructure and mechanical properties of the tooth. The tooth crown consists of two layers: (i) enamel is the white, protective external surface of the anatomic crown and has weaker optical absorption and (ii) dentin is the yellowish tissue underlying the enamel making up the major bulk of the inner portion, and has stronger optical absorption than the enamel. The mode-1 image clearly shows the enamel (outer dark region) and dentin (inner bright region). The mode-2 image of the same cross-section shows two-layer concentric structure with clear boundary. Figures 1(d) and 1(e) show the images of a lesion. Here, the mode-1 contrast clearly shows the shape, size, and macrostructure of the tooth cross-section, but, it fails to show significant contrast on the dental lesions. However, the mode-2 contrast clearly shows the lesions in the tooth. 2.2.Multitransducer-Based PAT with Nd:YAG LaserIn this system, an electrical slip ring was used to rotate multiple SETs around the sample. Figures 2(a) and 2(b) show the schematic and photograph of the system.88 A slip ring is a device for transmitting electrical power through rotators, which can avoid the cable intertwist problem of the rotating UST. This is the first time a slip ring was used in a PAI setup. A Ti:Sapphire laser (, , , LT-2211A, LOTIS TII, Minsk, Belarus) was used as an excitation source. The diverging ring-shaped beam from the conical lens was reflected by an acoustically penetrable optical reflector (APOR) to irradiate the sample surface at a horizontal plane. The laser fluence at the surface was (less than ANSI safety limit). The signals of each transducer were preamplified 28 dB (ZFL500LN, Mini-Circuit, New York) before passing through the slip ring, and then amplified another 32 dB (5072PR, Olympus NDT, Massachusetts) before being digitized. The amplified signals were recorded by a DAQ card with a sampling rate of 100 MHz (CSE4327, DynamicSignals, LLC, Illinois). For each cross-sectional scanning, 1800 signals were acquired and then reconstructed by the simple delay-and-sum algorithm. Two identical cylindrically focused transducers with a central frequency of 5 MHz (V307, Olympus NDT, Massachusetts) were used to collect the PA signals. Fig. 2(a) Schematic and (b) photograph of the slip-ring-based PAT system: UST, ultrasonic transducer; Amp, amplifier; APOR, acoustically penetrable optical reflector; US, US. In vivo animal imaging results by two cylindrically focused transducers with a 5-MHz central frequency: (a–f) cross-sectional PAT images of a nude mouse, (g) photograph of the nude mouse. Reproduced with permission from Ref. 88. 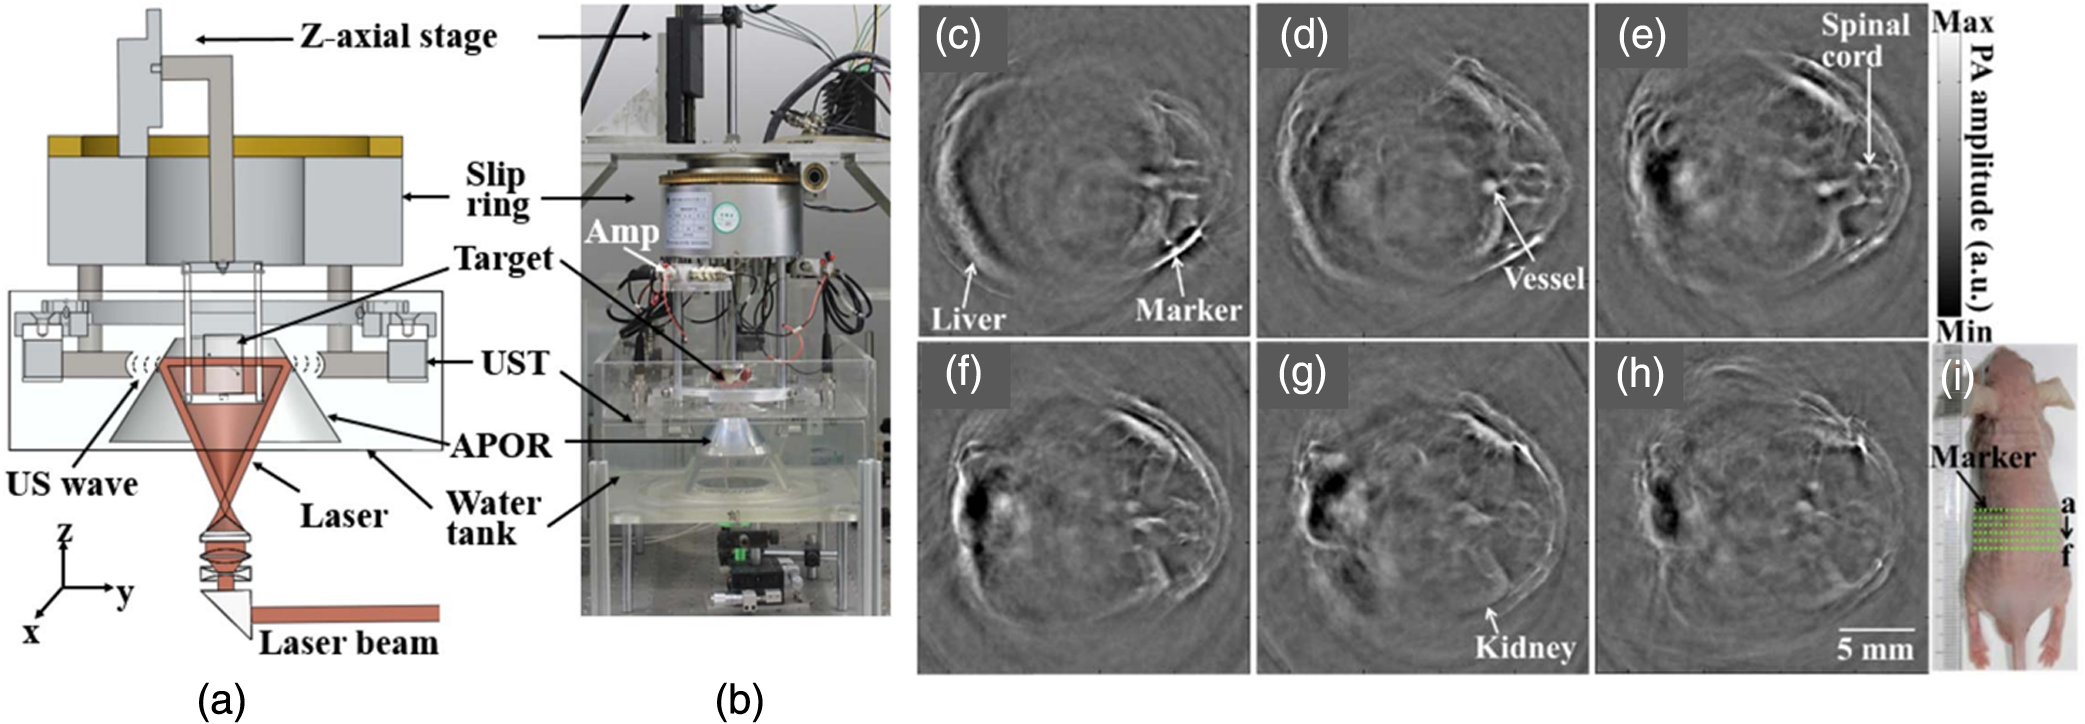 The system was tested on in vivo animal study on a BALB/c male nude mouse. During imaging, the mouse was anesthetized by an isoflurane machine (0.8% to 1.0% vaporized isoflurane with an oxygen airflow rate of ). Cross-sectional images showing the spinal cord, kidneys, liver, and one major vessel are shown in Figs. 2(c)–2(h). Figure 2(i) shows the area of the animal where PA cross-sectional images were recorded. The signal-to-noise ratio (SNR) of in vivo images was . The total imaging time was 9 min. These results promise that the system could provide in vivo animal whole-body imaging. Although Nd:YAG/ OPO or dye-based lasers could provide high energy pulses for deep-tissue PAT imaging, these are expensive, bulky (even require optical table to house them), and are not suitable for high-speed imaging with SET due to the low laser pulse RR. Typically, it takes several minutes to obtain one cross-sectional image. Portable OPO lasers are commercially available but are even more expensive.89–91 Alternatively, PLD and LED can be promising light excitation sources which could make PAT a low-cost, high-speed, and portable system. 2.3.SET-Based PAT with Pulsed Laser DiodeThe PLD-PAT system is shown in Figs. 3(a) and 3(b).47,59 Here, the laser was integrated inside the scanner. The PLD (, , , , Quantel, France) was the excitation source. The PLD was controlled by the laser driver unit (LDU) which consists of a temperature controller (LaridTech, MTTC1410), a 12-V power supply (Voltcraft, PPS-11810), a variable power supply (to change the laser output power), and a function generator (to control the laser RR). The PE and RR can be controlled independently with variable power supply (BASETech, BT-153), and function generator (FG250D, Funktionsgenerator), respectively. The function generator provides a transistor–transistor logic) signal to synchronize the DAQ with the laser excitation. A flat UST (V323/SU, , , Olympus NDT) was driven by a step motor (M) (Lin Engineering, Silverpak 23C) to scan circularly around the sample. The UST detected signals were subsequently amplified, and band pass filtered by the US signal receiver (R/A/F) unit (Olympus-NDT, 5072PR), and then digitized and recorded by the PC with DAQ card (GaGe, compuscope 4227). The DAQ was done at . Fig. 3(a) Schematic and (b) photograph of the PLD-PAT system: PLD, pulsed laser diode; LDU, laser driver unit; CSP, circular scanning plate; S, sample; MPS, motor pulley system; M, motor; DAQ, data acquisition card, R/A/F, US signal receiver, amplifier, and filter; UST, ultrasound transducer. PAT reconstructed images of horse-hair phantom acquired using 2.25-MHz UST at scan times (c) 5 s and (d) 3 s. Deep-tissue images of blood and ICG at (e,f) 1-cm depth and (g, h) 2-cm depth inside the chicken breast tissue. Reproduced with permission from Ref. 47. In vivo PAT imaging of rat brain in lateral plane at different scanning speeds acquired using a 2.25-MHz UST: (i) 30 s, (j) 10 s, (k) 3 s. SS, superior sagittal sinus; TS, transverse sinus; (l) SNR as a function of scan time.  High-speed PAT images obtained on a horse hair phantom are shown in Figs. 3(c) and 3(d).59 These images were obtained in 5 s, and 3 s scan time using 2.25-MHz UST. The hair has a side-length of and a diameter of . Deep-tissue imaging experiments were carried out on a chicken breast tissue in which two low-density polyethylene (LDPE) tubes ( long and inner diameter) were filled with mouse blood and indocyanine green (ICG). The radiation density on the tissue surface was . PAT images were acquired using 2.25 MHz for 5 s, 3 s scan time at 1 cm, and 2 cm depth, respectively, as shown in Figs. 3(e)–3(h). The SNR values of blood, ICG measured at 1 cm are , and that measured at 2 cm are , . The performance of PLD-PAT was compared against the Nd:YAG/OPO-PAT system and the results were summarized in Table 1.47 From Table 1, it is clear that the PLD-PAT can provide 2-cm imaging depth and acceptable images in 3 s. The low PE was slightly compensated by the higher RR of PLD. Since the PLD was integrated inside the scanner, it makes the overall system compact and portable. Table 1Comparison of various parameters between PLD-PAT and OPO-PAT. Reproduced with permission from Ref. 47.
The PLD-PAT system was demonstrated for in vivo small animal brain imaging.92 Figures 3(i)–3(k) show the in vivo brain images of a healthy rat. The superior sagittal sinus (SS) and transverse sinuses (TS) of the rat brain are clearly visible. The plot in Fig. 3(l) shows the image SNR as a function of scan time. These results promise that the PLD-PAT system could provide high-speed in vivo imaging for preclinical applications. 2.4.SET-Based PAT with Light-Emitting DiodeThe PLDs suitable for PAT are typically available at wavelengths greater than 750 nm. The LEDs are readily available at wavelengths below 650 nm where hemoglobin absorption is significantly higher, offering high contrast for superficial vascular imaging applications. The use of LEDs for PA imaging has been explored. Figure 4(a) shows the schematic of the LED-PAT system.62 A high power SST-90 LED (, , , ) from Luminus was used as an excitation source. It was driven by a driver (PCO-7120, Directed Energy, Inc.), which provided a peak current of 50 A. The LED was operated at low duty cycle 0.01% for its safety. Figures 4(b) and 4(c) show the PA images of the phantom. The phantom was comprised of three 1.4-mm-diameter poly methyl methacrylate tubes filled with human blood (35% hematocrit) immersed in 1% intralipid (). The three tubes were fixed in a mount that was rotated by 360 deg in steps of 0.9 deg using a stepper motor. The phantom was illuminated by LED with energy density at 623 nm. The signals were collected by a cylindrically focused UST (, V383/Panametric). The signals were amplified using a low noise voltage amplifier (60 dB, Analog Modules Inc.), averaged 5000 times and saved in a computer. Figure 4(b) shows the detected time resolved PA signals as a function of scan angle. It can be seen that PA signals corresponding to a penetration depth of up to 15 mm are clearly visible. Figure 4(c) shows the reconstructed PA image of the phantom with SNR . Fig. 4(a) Schematic of LED-PAT system, (b) time-resolved PA signals of three 1.4-mm tubes, and (c) reconstructed PA image of the three phantoms. Reproduced with permission from Ref. 62.  This study has explored the use of low-cost visible LEDs () as a PA excitation source. At 500-Hz RR, LED-PAT could image blood tubes immersed to a depth of 15 mm in Intralipid. This suggests that in vivo imaging of the vasculature to depths of a few mm should be possible with LED-PAT. A four-wavelength LED was also demonstrated for spectroscopic applications. This study presents a step toward the development of compact, inexpensive visible, and near-infrared multiwavelength excitation sources for PAT.62 In spite of single-element large detector area transducers providing the low-cost PAT imaging system with high sensitivity, it is challenging to achieve real-time imaging. The time required to collect multiple A-lines data for a cross-sectional PAT image reconstruction is too slow, since a motor driven mechanism is required to move the detector around the sample. The fastest imaging speed demonstrated so far using a single-element US transducer is 3 s per cross-sectional imaging.47 Therefore, for faster real-time imaging a US array transducer is required. In Sec. 3, we will discuss array transducer-based PAT imaging systems. 3.Ultrasound Array Transducer-Based Preclinical PAT SystemsIn traditional pulse echo US imaging, array transducers (linear array, phased array, and curved array) have replaced single-element transducers decades back. It helped US imaging devices to become real-time, portable, and handheld. Similarly, the PA community has also adopted array transducers (linear, semicircular, circular, and spherical array) to develop high-speed/real-time PA imaging.48,63,64–66,93–95 In the following sections, we will discuss the recent progress in PAT systems with array-based USTs that could translate the PAT from bench to bedside. 3.1.Circular Planar Array-Based PAT System for Breast ImagingPAT is fundamentally a 3-D imaging method. Light illuminating the tissue surface creates a diffusive pattern within tissue and generates PA signals from the illuminated volume. Imaging systems must then record PA signals around the boundary of that volume so that the initial pressure distribution can be reconstructed. Several array-based PAT systems including semicylindical cup,64 ring-shaped transducer array,96,97 circular planar array,98 semispherical array-based99,100 PAT systems have been developed for breast imaging. A laser optoacoustic imaging system (LOIS) based on semicylindrical array of transducers was reported for breast cancer detection.64 The system was designed to image a single breast slice in craniocaudal or mediolateral projection with an arc-shaped array of 64 ultrawide-band acoustic transducers. The LOIS system was clinically tested on 27 patients, and the system could provide high contrast PAIs of breast tumors, taking advantage of the blood optical absorption in the angiogenesis-related microvasculature. A functional photoacoustic tomography (fPAT) system was developed for functional imaging of breast lesions with high resolution.96,97 The system consists of a tunable pulsed Ti:sapphire laser pumped with a Q-switched Nd:YAG laser (Symphotic Tii, Camarillo, California) and a ring-shaped array of 64 acoustic transducers having maximum frequency response up to 2 MHz. Functional images of breast tissue including absolute total hemoglobin concentration (HbT) and oxygen saturation () were obtained by fPAT. and maps from pathology-confirmed cancer cases showed clear detection of tumors. A circular planar array-based PAT, named as Twente photoacoustic mammoscope, was reported for breast imaging.98 The schematic of the system is shown in Fig. 5(a). A Q-switched Nd:YAG laser (, , , ) from Continuum Surelite, California, was used for PA excitation. The beam was maintained at a fixed position on the breast surface, with a beam area of and an energy density of (less than ANSI limit) on the skin.101,102 The US array consists of 588 elements (, ) in a circular layout with diameter of 85 mm. The elements are grouped into 10 sectors; each sector is elements serviced by an application-specific IC (ASIC), which buffers and amplifies the signals. Each ASIC has a single output that leads to a 10 input summing amplifier. In the upgraded mammoscope, the outputs of the 10 ASICs are made to bypass the buffers, amplifiers, and summing amplifier. An independent interface unit was developed with 10 channel buffer-amplification based on the AD797AR (Analog Devices) ultralow noise op-amp. The 10 outputs are acquired at a time using two eight-channel digitizers (National Instruments PXI 5105, , 12-bit) controlled by a Labview program. With averages over 10 signals per acquisition, an imaging time of 10 min was required for the complete detector area covering an field-of-view of on the breast. Fig. 5(a) Schematic of the imager of the Twente photoacoustic mammoscope, (b, d) MR, and (c, e) PA CC images of the breast for two cases. (b, c) Patient P38, having an infiltrating ductal carcinoma (IDC), grade 3 of 19 mm, (d, e) patient P55, having an IDC, grade 2 of 34 mm. The dashed box in the MR image indicates the area from which the PA image is acquired. Reproduced with permission from Ref. 98.  Figures 5(b)–5(e) show images in the craniocaudal (CC) direction of MRI and PAT for two cases with increasing histopathological size. The two cases (P38 and P55) are representative for lesion sizes up to 35 mm in x-ray mammography. The results show that there is good correspondence in lesion colocalization, appearance, and shape in the PAT and MRI images. The study proved that PA imaging has potential in visualization of breast cancer. For the first time, mass-like, nonmass, and ring appearances were observed in PA image intensities. However, the system needs to be tested on a large number of patients before going for clinical practice. 3.2.Semispherical Array-Based PAT SystemsA PAT system was reported for 3-D visualization of vasculature in human breast.100,103 The device consists of an array of 128 elements with 5-MHz central frequency and 3 mm diameter laid out in a spiral pattern on a semispherical surface with a 100-mm radius of curvature. The system could provide maximum depth of 40 mm, and its spatial resolution was uniform over a field of view. A PAT system with advanced semispherical array was demonstrated for volumetric imaging.104 The imaging system is based on simultaneous acquisition of PA signals by means of a custom-made matrix ultrasonic array (, , Imasonic SaS, Voray, France) consisting of 256 elements densely distributed on a spherical surface [Fig. 6(a)]. The radius of the array is 40 mm and its outer diameter is 64 mm. Acoustic coupling of the PA signals to the detectors was done by means of a transparent impermeable membrane containing water. Acoustic gel is used to guarantee coupling between the membrane and surface of the imaged region. The detection array further includes a central cylindrical cavity with a diameter of 8 mm through which optical illumination was delivered. The output of an OPO laser (680 to 900 nm, , , Phocus, Opotek, California) was guided through a custom-made silica fused-end fiber bundle (CeramOptics GmbH, Bonn, Germany) consisting of 480 fibers. The illumination spot at a distance of 3 cm from the surface of the detection array has diameter. PA signals are acquired with sampling frequency of using a custom-made DAQ system consisting of 16 multichannel analog-to-digital converters (FalkensteinMikrosysteme, Taufkirchen, Germany), which were triggered by the Q-switch output of the laser. Using a graphic processing unit (GPU), the system allows imaging at a frame rate up to 50 frames per second. The volumetric imaging rate is limited by pulse RR of the laser and processing speed of the image reconstruction method. The system was demonstrated for several applications, and the recent ones are discussed below. Fig. 6(a) Projection view of the shape of the individual transducer elements. (b) Handheld volumetric PAT probe, (c) real-time PA imaging of the common carotid artery (cca) in a human volunteer, real-time multispectral PA imaging of OHb in the human hallux; (d) overlay OHb image (unmixed from 18 wavelengths acquired within 400 ms) on the PA imaging (at 700 nm) of the tip of the hallux in a healthy volunteer. Reproduced with permission from Ref. 77.  3.2.1.In vivo imaging of the carotid arteries in humansThe ability to image hemoglobin makes the PAT a potential tool for imaging vascular diseases. Using the system, imaging of the carotid arteries (cca) in healthy human volunteers was demonstrated.105 Figure 6(b) depicts a device that is similar in operation to medical US imaging.77 Figures 6(c) and 6(d) show the real-time two-dimensional (2-D) multispectral optical tomography (MSOT) images of oxyhemoglobin (OHb) in human hallux. The MSOT imaging was done at a video-rate of 50 frames per second, with the ability to select a different wavelength for each frame. Such a high frame rate was enabled by a fast-tuning OPO and GPU. 3.2.2.In vivo imaging of tissue chromophores on human forearmThe system design is shown in Fig. 7(a); here high RR OPO laser (, , ) from Innolas Laser GmbH, Germany, was used.106 The spectral dependence of the optical absorption of the three main tissue chromophores (melanin, Hb, and ) is shown in Fig. 7(b). The 2-D volumetric PA images collected at different wavelengths and at different time points are shown in Fig. 7(c). Fig. 7(a) Schematic and the clinical handheld PA imaging scanner. Demonstration of 5-D PA imaging in a healthy volunteer in vivo using: (b) photograph of the human forearm, the colored frames correspond to the region of interest, (c) 2-D matrix of reconstructed volumetric PA images. Each image corresponds to data taken at a different wavelength and a different time point, thus, effectively rendering 5-D data set. (d) For each time point, the wavelength-dependent data are unmixed in order to render, in real time, distribution maps of three different intrinsic tissue chromophores. Reproduced with permission from Ref. 106.  Fig. 8(a) Layout of the handheld breast imaging approach, (b-c) functional optoacoustic breast angiography using multiwavelength DAQ simultaneously resolves the concentration of major tissue chromophores in the breast of a 40-year-old volunteer in 3-D and in real time. The breast surface is located in the upper part of the cubes. Reproduced with permission from Ref. 99.  3.2.3.In vivo imaging of human breastThe system design and representative volumetric frames of breast are shown in Figs. 8(a)–8(c).99 The breast is illuminated using the fast tuning OPO laser and volumetric data were acquired at multiple wavelengths in order to recover functional blood oxygenation parameters of the breast vasculature in real time. Here, concentration of the different tissue chromophores, as resolved by the spectral unmixing procedure, is pseudocolored with red, blue, and yellow for , HbR, and melanin, respectively. The yellow spots correspond to melanin-rich skin pigmentations in the skin. Since it only takes 30 ms to acquire multispectral data at three different wavelengths, this approach is equally capable of rendering functional blood oxygenation and total hemoglobin profiles in real time. This is an especially important aspect as elevated levels of hemoglobin and hypoxic behavior were found to strongly correlate with tumor angiogenesis and breast malignancies. 3.2.4.In vivo imaging of lymph node micrometastases and in-transit metastases from melanomaRecently, the MSOT system was demonstrated for detection of melanoma lymph node micrometastases and in-transit metastases undetectable with fluorine 18 fluorodeoxyglucose (FDG) PET/computed tomography (CT).107 The MSOT could differentiate even small melanoma metastasis from the other lymphadenopathies in vivo. The study was performed on a mouse B16F10 melanoma limb lymph node metastasis model. 3.3.Ring-Array-Based Wearable PAT SystemPAT allows in vivo brain imaging at micrometer spatial and millisecond temporal resolution. A 3-D wearable PAT system with spatial and 170 ms temporal resolutions is demonstrated for brain imaging in a rat while it is walking.108 This is the first time a wearable PAI device was demonstrated for brain imaging. This could open up a lot of opportunity in neurostudies, cognitive science, and behavioral studies. The photograph of the 3-D-wPAT probe and schematic of the system are shown in Figs. 9(a) and 9(b), respectively. The pulsed laser (680 to 2550 nm, , , Surelite OPO Plus, Continuum) was split into two beams by a beam splitter. The reflected beam was recorded by a photodiode for light energy monitoring, and the transmitted beam was coupled into the proximal end of a liquid light guide-LLG (, , LLG77631, Newport). The system contained 192 signal amplifying channels that were three-to-one multiplexed into 64 DAQ channels. Therefore, three laser pulses are required to collect the data from all the channels. With the rotatable design of the LLG interface, the animal can walk around during imaging, as shown in Fig. 9(c). Fig. 9(a) Photographs of the fabricated 3-D-wPAT probe. (b) Schematic diagram shows the light illumination, light energy monitoring, and data amplification and acquisition system. (c) Photographs show the behaving ability of a rat while wearing 3-D-wPAT. Functional imaging using multiwavelength light excitation (710 and 840 nm). (d) Total cerebral hemoglobin wPAT images. (e) Calculated in-plane oxygen saturation map. Oxygen gas was applied to the experimental chamber at the 100th second. Reproduced with permission from Ref. 108.  The functional imaging capability of 3-D-wPAT was demonstrated by mapping the cerebral oxygen saturation via multiwavelength irradiation in walking hyperoxic rats as shown in Figs. 9(d) and 9(e). The animal was placed in an experimental chamber and pure oxygen was pumped into the chamber 100 s after the start of imaging. The imaging duration was 300 s, and a total of 100 images were acquired. Figures 9(d) and 9(e) present the total cerebral hemoglobin images and maps for each acoustic detection layer, respectively. The ratio increased throughout the brain vasculature after being supplied with oxygen. As shown in Fig. 9(e), the regions marked with white arrows underwent increase in oxygen saturation. The obtained results are consistent with the idea that hemodynamic changes initiate in medial and ventral brain regions, reinforcing the importance and significance of deep-penetration 3-D brain imaging. All the PAT systems discussed in Sec. 3 are based on homemade/custom-made array US transducers. The challenge in building array based transducers is that they require parallel data acqusition (DAQ) systems, which are expensive and most of them are also custom-made. Such systems are also not approved by the Food and Drug Administration (FDA) in the United States at present, and hence they are not preferred in clinical use. Also these systems are not optimized to perform standard US imaging. On the other hand, clinical US imaging systems are FDA-approved devices and they are routinely used in clinics/hospitals by the clinicians. Moreover, PAI and pulse-echo US imaging share the same US-receiving mechanism. Hence, PAT integrated with a clinical US system will be more acceptable to the clinicians as they will be able to provide dual-modal imaging. They can provide traditional US imaging, Doppler blood flow imaging, and so on on top of PAI. In the following section, we will discuss the integrated clinical US systems with PAT. 4.Clinical Ultrasound Imaging Systems Integrated with PAT4.1.Performing Sentinel Lymph Node Biopsy for Breast Cancer PatientsIn staging of cancer, including breast and melanoma cancers, SLN biopsy (SLNB) is a standard procedure.109,110 A positive biopsy result suggests that cancer has spread to the node and probably to distant organs. The identification rate and sensitivity of SLNB technique are less than 95%, even in experienced hands.109–111 Moreover, the complications associated with the SLNB procedure include seroma formation, lymphedema, sensory nerve injury, and limitation in the range of motion.112,113 Several studies have been conducted proposing noninvasive identification of SLN using a dual-modal PAT-US platform in a small animal model.114–116 Recently, a handheld PAT-US system [Fig. 10(a)] was used to identify the SLN in breast cancer patients.117 The system was developed by modifying a clinical US system (iU22, Philips Healthcare). The excitation source was a tunable dye laser (, , PrecisionScan-P, Kaarst, Germany) pumped by a 532-nm Nd:YAG laser (QuantaRay PRO-350-10, Spectra-Physics, Santa Clara, California). Light was delivered to the sample by a fused-end, bifurcated fiber bundle. To improve the PA detection sensitivity and handiness, the fiber bundles and UST array (L12-5 and L8-4, Philips) were integrated into a single probe as shown in Fig. 10(a). The light fluence on the skin was (less than ANSI safety limit). The signals were acquired by a custom-built DAQ card. The DAQ system was synchronized with laser triggering by an FPGA-based card that also performs PAT reconstruction based upon a delay-and-sum beamforming algorithm. The system can provide a frame rate of 5 Hz for PA, US, and coregistered imaging. Fig. 10(a) Schematic of the dual-modality PA and ultrasonography imaging system and photograph of the probe, (b) In vivo coregistered PAT-US image of the SLN and needle. In vivo dual-wavelength PAT imaging: (c) image acquired at 650 nm showing both MB dye in lymphatic vessels and hemoglobin in blood vessels, (d) image acquired at 1064 nm showing primarily hemoglobin in blood vessels while suppressing the signals from MB, (e) subtracted image highlighting the locations of MB. and : PA amplitudes measured at 650 and 1064 nm, respectively. Reproduced with permission from Ref. 117.  For SLNB, the PAT-US system can serve as a real-time modality to first locate the SLN and then guide a fine or core needle for lymph node sampling.115,118 Figure 10(b) shows the coregistered PA-US image, revealing the SLN and the needle used to insert the titanium marking clip. The contrast from the needle in the PAT image is much higher than that in the corresponding US image because the US array receives more emitted PA energy than it does reflected ultrasonic energy. The system is capable of locating lymph nodes via anatomical features in US and to verify the lymph node as sentinel using PAT. In addition, these results illustrate the feasibility of PAT-US to guide needles to the SLN in breast cancer patients. SLN identification can be improved further using multiwavelengths to spectrally resolve methylene blue (MB, a routinely used contrast agent in clinical practice) from blood in nearby vessels. MB absorption is strongest at 665 nm, while its absorption is very weak at wavelengths longer than 750 nm. Figure 10(c) shows an in vivo imaging of MB and the ability of the system to distinguish MB from surrounding blood vessels. Five minutes after MB injection and breast massage, the PAT image acquired at 650 nm [Fig. 10(d)] shows signals from both MB (i.e., lymphatic vessels) and blood vessels, while the PAT image acquired at 1064 nm [Fig. 10(e)] shows signals from blood vessels only. The images in Figs. 10(d) and 10(e) are subtracted to highlight MB only. The results are promising; however, the clinical utility of the dual-wavelength imaging requires further investigation. One of the challenges of integrating the PAT with a clinical US system is to obtain the raw channel radio-frequency (RF) data before beamforming is done. Once these RF data are obtained, PA reconstruction is done and displayed on the monitor. The Philips iU22 clinical US system after integrating with PAT is capable of providing the raw channel RF data before beamforming. However, this feature is not available on the commercially available iU22 US system in the market. Therefore, the researchers will have to collaborate with the Philips research team to use their system specifically modified for that purpose. This limits the accessibility of such a system to many researchers interested in doing integrated US and PA imaging. Recently, there are many other US companies coming up with research US platforms capable of extracting raw channel RF data and these systems are made available for researchers to purchase off the shelves. Below we will discuss such systems and their recent progress. 4.2.High-Frame Rate (7000 Hz) Photoacoustic ImagingUsing a handheld PLD-PAT/US probe, a real-time phantom imaging up to 15 mm depth was done at 20 fps.119 With the OPO-PAT/US system, in vivo real time imaging of blood vessels in a rat was performed at 20 fps.120 Recently, a high-frame rate (7000 Hz) PA imaging system was demonstrated by integrating a high RR PLD (the PLD used here is same as the one used in Sec. 2.3), with a clinical US system (ECUBE 12R, Alpinion, South Korea).121 The PLD output was made narrower using a cylindrical lens to illuminate area with energy density. The PA signals generated were acquired by a linear array transducer (LAT) (L3-12 transducer, Alpinion, South Korea) consisting of 128 array elements. The probe has (95% BW), array element pitch 0.3 mm, and elevation height 4.5 mm. The Ecube system has a 40-MHz sampling frequency and 12-bit ADC to acquire the data and a data transfer speed of . The clinical US system captures and displays the PAI images in real-time. The L3-12 linear array UST can be operated in two different modes, mode-1: using all the 128 arrays elements and mode-2: using 64 channels elements only (element numbers 1-64 or 65-128). PA imaging was done for the different flowrates. Using mode-1 and mode-2, 3500 fps and 7000 fps PA images were recorded. Figures 11(a)–11(h) show the PA images of ink flowing through an LDPE tube with an inner diameter of 1.15 mm when the transducer was operated in mode-2. Here 350 frames are being recorded in 0.05 s when operated at 7000 fps. Figure 11(i) shows the photograph of the experimental setup. Figures 11(a)–11(d) correspond to the flow rate , whereas Figs. 11(e)–11(h) correspond to . It was observed that the ink is flowing through the tube, i.e., a high contrast air–ink interface was moving in the PA B-scan images. A high frame rate of 7000 fps photoacoustic B-scan imaging was feasible with the PLD and Ecube clinical US system, whereas with the 10-Hz Nd:YAG/OPO laser only 10 fps (max) PA imaging was possible. With 7000-fps frame rate, the theoretical flow rate that can be measured is up to . However, future studies need to be conducted to explore the various in vivo applications where high frame rate PA imaging would be beneficial, such as imaging circulating tumor cells, heart valves, and blood vessel. Fig. 11Set of PA images showing the ink flow at various time points with the PLD-PAT system. PA imaging was done at a frame rate of 7000 fps. (a-d) Flow rate was , (e-h) flow rate was . (i) Photograph of the PLD-PAT clinical US system. Reproduced with permission from Ref. 121.  4.3.Slit-Enabled UST Array for High Elevational Resolution PAT ImagingA dual-modality PA-US system is increasingly used in preclinical/clinical imaging. However, the 3-D imaging capability of a linear array is limited due to its poor elevational resolution. To overcome this problem, a metal slit was used at the array focus.122 The imaging system involved a 128-element UST array (, elevation focus , ATL/Philips L7-4) and an Nd:YAG laser (, , , , Surelite SL III-10, Continuum). PA signals received by the L7-4 array were multiplexed and digitalized by a 64-channel DAQ (Vantage, Verasonics, Redmond, Washington). A thin slit [Fig. 12(a)] was formed by two metal blades with thickness. The bottom blade was fixed in position while the top blade was mounted on a translation stage, which allowed easy and precise control of the slit opening. To prevent sound signal transmission directly through the plate, they glued 5-mm foam on the back surface of the blade (facing the transducer) as an acoustic absorber. The slit causes the incoming PA waves to diffract along the elevation direction and, hence, significantly improves the elevation detection aperture and resolution. Figures 12(b)–12(d) show the in situ PAT results on a mouse abdomen without and with slit-enabled PAT. The slit improves the elevation resolution by 10 times without compromising scanning time. Fig. 12In situ experiment of mouse abdomen: (a) 3-D drawing of the in situ slit-PAT setup, (b) depth-encoded image of 2-D-stack PAT, (c) depth-encoded image of 3-D focal-line PAT, (d) depth-encoded image of slit-PAT. Arrows 1 and 2 point to intestine and crossed skin vessels. (b)–(d) Reproduced with permission from Ref. 122.  4.4.Photoacoustic Imaging Using Two Linear Array TransducersATs are widely used in clinical US systems, but their application in PAT is still limited due to the limited-angle of view that affects the image quality. Using two LATs, one can acquire a PAT signal from different orientations. The positions of the two transducers can be adjusted to fit the specific geometry of an imaging site. Figure 13(a) shows the schematic of the experimental setup for PAT imaging with two transducers. The laser source contains a Q-switched 532-nm Nd:YAG/OPO laser (, , tunable to 2550 nm, Surelite OPO Plus, Continuum). The system used two identical commercial LATs controlled by a SonixMDP US system (Ultrasonix Medical Corporation, Richmond). The US imaging system was capable of enabling selected transducer channels for acoustic wave transmitting. The two LATs (L14-5/38 Linear) were positioned in the same plane. Each one has 128 channels with 7.2-MHz center frequency, minimum 70% fractional BW (at ), and 0.3-mm element pitch. The acoustic signal received by the transducer array was sent to a specialized research module, SonixDAQ for DAQ. This module acquires and digitizes prebeamformed radio-frequency signal from all the 128 channels individually at a sampling rate of 40 MHz and 12-bit resolution. Both PA and US images were reconstructed using delay-and-sum beamforming algorithm. The lateral and axial resolutions of the systems are 0.52 and 0.44 mm, respectively. Fig. 13(a) Schematic of a broad-view PAT system based on two LATs, PAT images of a leaf skeleton. (b) Photograph of the leaf skeleton phantom and sketch diagram of the transducers. Reconstructed image from (c) transducer B, (d) transducer A, and (e) both transducers. Reproduced with permission from Ref. 123.  The system was tested on phantoms and a human hand. A leaf skeleton embedded in bovine gelatin, mimicking blood vessel branches in tissue, was imaged. A photograph of the sample and the transducer positions are shown in Fig. 13(b). The relative angle between the two LATs was . In both images [Figs. 13(c) and 13(d)], each linear transducer can only capture part of the leaf skeleton structure which was near parallel to the lateral axis of the transducer. By incorporating the acoustic signals acquired by both linear transducers, a more complete leaf skeleton structure was obtained, as indicated in Fig. 13(e). The system was demonstrated for in vivo imaging of the human hand and the results promise that the two transducer approach has potential to be implemented in clinical applications. 4.5.Full-View Photoacoustic Imaging Using Thermal EncodingPAI of irregular objects may miss important features because PA waves propagate normal to structure boundaries and may miss the UST if it has a limited angle of view. To overcome such problems, an ultrasonic heating encoded approach was demonstrated.124 The experimental setup is illustrated in Fig. 14(a). The output of excitation 532-nm Nd:YAG laser (, , Quantel, France) was expanded by a concave lens to illuminate the sample. A linear UST array with 256 elements (, , MS200, VisualSonics Inc., Canada) was used to detect the PA waves. The probe was connected to an US imaging system (Vevo LAZR, VisualSonics Inc., Canada), which could generate a 2-D PA image using four laser pulses. The system can provide 257 and lateral and axial resolutions, respectively. Fig. 14(a) Schematic of a full-view PAI system based on acoustic thermal tagging, (b) in vivo mouse vascular PA imaging without (green) and with (red) ultrasonic thermal encoding. Reproduced with permission from Ref. 124.  A custom-made ultrasonic heating transducer (, focal diameter , focal depth ) can generate a focal spot size smaller than the lateral resolution of the linear transducer array for isotropic detection. A function generator synthesized a 7.5-MHz sinusoidal signal, whose amplitude was modulated by another sinusoidal wave at a frequency of 0.5 Hz. The 7.5-MHz sinusoidal signal modulated by 0.5-Hz signal was amplified to drive the heating UST. To avoid interference between the acoustic heating and PA detection, the heating US was turned off for 1 ms before and after each PA acquisition. At each heating spot, 50 consecutive 2-D PA images were acquired at a speed of and reconstructed using the filtered backprojection algorithm. As a proof of concept, full-view in vivo mouse vascular imaging was performed with and without thermal encoding as shown in Fig. 14(b). Only horizontal blood vessel segments [features in green in Fig. 14(b)] are visible in the original PA [green signal in Fig. 14(b)] mode and more blood vessels are visible with thermal encoding [red signal in Fig. 14(b)] due to the enlarged angle of view. Since ultrasonic heating can be focused deeply, this technique can be applied to deep-tissue imaging and is promising for full-view imaging of other features of biomedical interest, such as tumor margins. 4.6.Human Finger Joint Photoacoustic ImagingA noninvasive 2-D PAT system based on single-element UST125 and multiple single-element USTs126 were reported for imaging of human peripheral joints toward diagnosis of inflammatory arthritis. Later, a 3-D quantitative PAT (3-DqPAT) system was reported for 3-D visualization of finger joints.127 The 3-DqPAT system consists of a Ti:sapphire laser (, , , LOTIS, Minsk, Belarus), a spherical scanner, a detection array consisting of eight individual 1 MHz single-element flat USTs (Valpey Fisher, Hopkinton, Massachusetts), and DAQ card (PREAMP2-D and PCIAD1650, US Ultratek, Concord, California). The system was demonstrated for in vivo detection of osteoarthritis in the human finger joints. Later, a high-resolution 3-D PA imaging system with lateral and axial resolutions 70 and for a finger joint was demonstrated.128 The cross-sectional PA images of a healthy joint clearly showed major internal structures including phalanx and tendons. The in vivo PAI results obtained were compared with 3.0T MRI images of the finger joint. A PA/US dual-modality system was reported for imaging human peripheral joints.129 The system utilizes a commercial US unit (Z.ONE, ZONARE Inc.) for both US and PA imaging. A linear array (L10-5, ZONARE Inc.), with a working band of 5 to 10 MHz was used to collect signals. The lateral resolution of the PA imaging in the focal plane was at a distance from the probe surface. In vivo results on healthy human volunteers revealed that the system could provide both the structural and functional information of intra- and extra-articular tissues. A handheld US probe smartly integrated with a PLD was reported for dual-modality PA-US imaging [Fig. 15(a)].119,130 The US detection was performed with an US array (Esaote SL3323 probe) composed of 128 elements, each with a length of 5 mm and a pitch of 0.245 mm. The array has a central frequency of 7.5 MHz and a measured BW of around 100%. The array incorporates an acoustic lens to focus the US in the elevation plane at about 20 mm distance. The probe, connected to an US scanner from MyLab_One, ESAOTE Europe B.V, Maastricht, the Netherlands. A PLD (, , , ) from Quantel (Paris, France) was integrated inside the US probe. The PLD output suffers from bad beam quality and large divergence angle. Using a fused silica diffuse optical element (efficiency 80%) composed of diffractive cells and eight discrete phase levels, the beam is homogenized and reshaped in rectangular form onto the skin. The PLD can provide fluence up to on skin area. The PA-US system allows, PA imaging at (after averaging 20 frames per image), and US imaging at (no averaging). Figures 15(b) and 15(c) show combined PA-US images of the sagittal and transverse plane of a human proximal interphalangeal (PIP) joint. Skin, bone, and joint gap are clearly visible in the US images (gray). PA images (yellowish red) depict the skin and blood vessels. The deeper PA signals correspond to the reflection of skin PA signal on bone. This bedside device has a potential to visualize rheumatoid arthritis. Fig. 15(a) Photograph of the portable US scanner and the probe integrating PLD and UST array. The overlaid PA/US images of a human PIP joint in (b) sagittal and (c) transverse planes. Reproduced with permission from Ref. 119.  All the systems described in this section are comprised of clinical US imaging platform modified to incorporate PAI making it a dual-modal imaging system. Although the PA images obtained from LATs suffer from limited view problems and lower sensitivity (compared with large single-element US transducers), this approach holds promise to make PAI into clinical one day. This is validated by interests from several small and large companies venturing into developing a commercial PAI system. In the next section, we will briefly discuss the efforts made by the companies. 5.Commercially Available PAT SystemsWorldwide several companies are developing commercial US/PAT imaging systems: FUJIFILM VisualSonics Inc., Toronto, Canada; iThera Medical GmbH, Munich, Germany; TomoWave Laboratories Inc, Houston; Seno Medical Instruments Inc., Texas; Endra Inc, Ann Arbor, Michigan; Optosonics Inc., Oriental, North Carolina, and so on. Real-time assessment of tissue hypoxia in vivo was demonstrated using Vevo2100 ultrahigh frequency (, imaging resolution ) US and PAI system from VisualSonics.131 Recently, in vivo liver iron quantitation132 and detection of lymph node micrometastases and in-transit metastases from melanoma in a mouse model107 were demonstrated using iThera inVision-128 and inVision 256-TF, respectively. LOIS-3-D from TomoWave was used for demonstrating melanin nanoparticles as a PA contrast agent.133 A tomographic PA scanner (Nexus 128, Endra Inc.) was used for animal imaging and contrast agent studies.134 A dedicated 3-D PAT system from Optosonics was demonstrated for a breast cancer imaging system.135 Among the large radiology companies, Philips Healthcare has put significant effort to integrate PA imaging with its iU22 US system.136 Moreover, General Electric has also shown interest in the past on integrating PAI in its US imaging platform.137 Hopefully, in the future we will see more progress in this domain from these companies as well as other large healthcare companies. 6.Advancement in PAT Reconstruction AlgorithmsThe development of the PAT imaging system will be incomplete without the appropriate reconstruction algorithm development in parallel. PAT reconstruction can be considered as an inverse problem. From the boundary PA data, various reconstruction algorithms can be used for obtaining the initial pressure rise distribution inside the tissue.138–145 Several advancements have happened in the last couple of years in the PAT reconstruction algorithms: (a) a least-square-based algorithm for accurate reconstruction with a fewer number of transducers,146 (b) basis pursuit deconvolution algorithm to retain the structural information accurately,147 (c) filtered-backprojection algorithm,148 (d) single-stage algorithm for high quality (compared to traditional two-stage algorithms) PA imaging,149 (e) pulse decomposition algorithm in the time-domain for weak, noisy PA signal reconstruction,150 (f) an algorithm integrating focal-line-based 3-D image reconstruction with coherent weight to improve the elevation resolution of commercial linear UST array-based PAT,151 (g) a multiview Hilbert transformation method for full-view PAT imaging using linear UST array,63 (h) asymmetric DAQ optimized with compressed sensing method for full-view PAT,152 and (i) improving tangential resolution in PAT with a modified delay-and-sum algorithm.84,85 7.Conclusions and Future DirectionsIn this review, we discussed the state-of-art PAT systems and their applications from laboratory research to clinical patient care. PAT has shown progress in many aspects: from preclinical to clinical, from bench to bedside, from static to dynamic, from 2-D to five-dimensional (5-D) volumetric imaging, from expensive to affordable. However, future undertakings are necessary to further mature the PAT technology for real-time clinical applications. From the laser excitation point of view, the ultrafast laser technology has advanced from bulk Nd:YAG lasers to tiny LEDs. However, PLDs and LEDs demonstrated so far have low PE (less than ) and high energy tunable PLDs, and LEDs are yet to be developed for deep-tissue and PA spectroscopic imaging. Along with laser technology, the US detection technology is also advancing to produce high frequency and broadband USTs. A Fabry–Perot polymer film etalon can sense US from DC to several tens of MHz.19,153 However, it is a contact approach and allows imaging only superficial features located within a few millimeteres inside the tissue surface. The PZT-based USTs have been widely used for US detection. Single-element USTs from 1 MHz to have been used for PAI.31,154 One-dimensional array-based USTs are available up to , 2-D array based are up to 70 MHz.155 Newer technologies for US transducers also have been explored. Capacitive micrimachined ultrasonic trandcuers (CMUTs) have been demonstrated for PAI as well. The ease of making 2-D or 3-D arrays of transducer with this technology, and other advantages like larger bandwidth, easier integration of the CMUTs with other electronics etc. may make this technology suitable for PAI as well.155,156 Further investigations are needed to mature this technology to be used both in traditional US imaging as well as in PAI. From the image reconstruction point of view, recovering the initial pressure distribution alone is also a challenging problem for quantitative PA imaging. In general, a PA signal is a function of optical absorption coefficient and local fluence. To make the PAT a robust quantitative measurement tool, the local fluence must be compensated accurately. A quantitative PAT by stochastic search for direct recovery of the optical absorption field was reported recently.157 The progress toward this study was summarized in the literature.158 Extracting the absolute chromophore concentrations from PA images obtained at multiple wavelengths is a nontrivial aspect of PAT but is essential for accurate functional and molecular imaging. More information on the quantitative PAI and its challenges can be found in the review.159,160 One of the key application areas of PAT is breast cancer imaging. However, penetration depth is a key obstacle. A penetration depth of has been achieved in vivo in the human breast using an excitation wavelength of 800 nm.100 Twente PA mammoscope161,162 and volumetric handheld optoacoustic angiography99 seem to be promising tools for breast cancer studies. However, extensive clinical studies need to be performed on this. A high-pulse-energy wavelength-cycling NIR laser system was designed and developed for 3-D PAT of the breast.90 It could provide 5-cm deep breast imaging. The laser was designed to improve efficacy and ease of use in the clinic. Wavelength-cycling provides a pulse sequence that repeatedly alternates between two wavelengths (756 and 797 nm) that provide differential imaging. This improves coregistration of captured differential images and quantification of blood oxygen saturation. Extending the penetration depth and image contrast can be achieved by using an exogenous contrast agent with strong absorption in the NIR region. Several contrast agents based on metallic, inorganic, organic nanoparticles, quantum dots, and so on were demonstrated for deep PAT imaging.22,163,164–173 Research work is progressing to find a stable, nontoxic, biocompatible, and yet powerful exogenous contrast agent for PAT.163,174,175 Very recently, a 12-cm deep-tissue imaging was demonstrated using phosphorus phthalocyanine as an exogenous contrast agent at 1064 nm.9 Another application of PAT is metabolic rate of oxygen () imaging. quantifies metabolism and thus it is crucial for screening and treatment of metabolic diseases, particularly cancers and cerebral disorders.71 Fortunately, PAT allows complete assessment of on a single imaging modality. The PAT measurement of in humans is expected to have a profound impact on studies of tumor metabolism and neovascularization. Another important aspect in which PAT has shown progressing is multimodal PAT imaging. PAT has been successfully integrated with other complementary imaging techniques, e.g., fluorescence and optical coherent tomography. One may refer to reviews focused on this topic.71,72,176 Overall, PAT has very promising preclinical and clinical applications. Several research groups and companies are also working toward making PAI small, compact, easy-to-use, and low-cost, and, therefore, making it possible for translating into the clinic. Improvement in terms of image quality, penetration depth, imaging speed, cost, and size of the system will further enhance the commercialization and clinical applications of this promising technology. AcknowledgmentsThe authors would like to acknowledge financial support from the Tier 1 research grant funded by the Ministry of Education in Singapore (RG31/14: M4011276, RG41/14: M4011285) and Tier 2 research grant funded by Ministry of Education in Singapore (ARC2/15: M4020238). Authors have no relevant financial interests in the manuscript and no other potential conflicts of interest to disclose. ReferencesG. Lu and B. Fei,
“Medical hyperspectral imaging: a review,”
J. Biomed. Opt., 19
(1), 010901
(2014). http://dx.doi.org/10.1117/1.JBO.19.1.010901 JBOPFO 1083-3668 Google Scholar
M. B. Aldrich et al.,
“Seeing it through: translational validation of new medical imaging modalities,”
Biomed. Opt. Express, 3
(12), 764
–776
(2012). http://dx.doi.org/10.1364/BOE.3.000764 BOEICL 2156-7085 Google Scholar
A. R. Kherlopian et al.,
“A review of imaging techniques for systems biology,”
BMC Syst. Biol., 2
(74), 1
–18
(2008). http://dx.doi.org/10.1186/1752-0509-2-74 1752-0509 Google Scholar
M. Xu and L. V. Wang,
“Time-domain reconstruction for thermoacoustic tomography in a spherical geometry,”
IEEE Trans. Med. Imaging, 21
(7), 814
–822
(2002). http://dx.doi.org/10.1109/TMI.2002.801176 ITMID4 0278-0062 Google Scholar
Y. Zhou, J. Yao and L. V. Wang,
“Tutorial on photoacoustic tomography,”
J. Biomed. Opt., 21
(6), 061007
(2016). http://dx.doi.org/10.1117/1.JBO.21.6.061007 JBOPFO 1083-3668 Google Scholar
L. V. Wang and L. Gao,
“Photoacoustic microscopy and computed tomography: from bench to bedside,”
Annu. Rev. Biomed. Eng., 16 155
–185
(2014). http://dx.doi.org/10.1146/annurev-bioeng-071813-104553 Google Scholar
L. V. Wang and S. Hu,
“Photoacoustic tomography: in vivo imaging from organelles to organs,”
Science, 335
(6075), 1458
–1462
(2012). http://dx.doi.org/10.1126/science.1216210 SCIEAS 0036-8075 Google Scholar
M. Schwarz et al.,
“Three-dimensional multispectral optoacoustic mesoscopy reveals melanin and blood oxygenation in human skin in vivo,”
J. Biophotonics, 9
(1–2), 55
–60
(2016). http://dx.doi.org/10.1002/jbio.201500247 Google Scholar
Y. Zhou et al.,
“A phosphorus phthalocyanine formulation with intense absorbance at 1000 nm for deep optical imaging,”
Theranostics, 6
(5), 688
–697
(2016). http://dx.doi.org/10.7150/thno.14555 Google Scholar
P. K. Upputuri et al.,
“Recent developments in vascular imaging techniques in tissue engineering and regenerative medicine,”
BioMed Res. Intl., 2015 1
–9
(2015). http://dx.doi.org/10.1155/2015/783983 Google Scholar
P. K. Upputuri et al.,
“Super-resolution coherent anti-Stokes Raman scattering microscopy with photonic nanojets,”
Opt. Express, 22
(11), 12890
–12899
(2014). http://dx.doi.org/10.1364/OE.22.012890 OPEXFF 1094-4087 Google Scholar
P. K. Upputuri et al.,
“Circularly polarized coherent anti-Stokes Raman scattering microscopy,”
Opt. Lett., 38
(8), 1262
–1264
(2013). http://dx.doi.org/10.1364/OL.38.001262 OPLEDP 0146-9592 Google Scholar
P. P. Mondal et al.,
“Developments in single and multi-photon fluorescence microscopy for high resolution imaging,”
J. Indian Inst. Sci., 93
(1), 15
–33
(2013). Google Scholar
R. Raghunathan et al.,
“Optical coherence tomography for embryonic imaging: a review,”
J. Biomed. Opt., 21
(5), 050902
(2016). http://dx.doi.org/10.1117/1.JBO.21.5.050902 JBOPFO 1083-3668 Google Scholar
A. M. Zysk et al.,
“Optical coherence tomography: a review of clinical development from bench to bedside,”
J. Biomed. Opt., 12
(5), 051403
(2007). http://dx.doi.org/10.1117/1.2793736 JBOPFO 1083-3668 Google Scholar
H. Yang et al.,
“Handheld miniature probe integrating diffuse optical tomography with photoacoustic imaging through a MEMS scanning mirror,”
Biomed. Opt. Express, 4
(3), 427
–432
(2013). http://dx.doi.org/10.1364/BOE.4.000427 BOEICL 2156-7085 Google Scholar
J. Yao and L. V. Wang,
“Sensitivity of photoacoustic microscopy,”
Photoacoustics, 2
(2), 87
–101
(2014). http://dx.doi.org/10.1016/j.pacs.2014.04.002 Google Scholar
X. Cai et al.,
“Photoacoustic microscopy in tissue engineering,”
Materials Today, 16
(3), 67
–77
(2013). http://dx.doi.org/10.1016/j.mattod.2013.03.007 MATOBY 1369-7021 Google Scholar
P. Beard,
“Biomedical photoacoustic imaging,”
Interface Focus, 1
(4), 602
–631
(2011). http://dx.doi.org/10.1098/rsfs.2011.0028 Google Scholar
S. Mallidi, G. P. Luke and S. Emelianov,
“Photoacoustic imaging in cancer detection, diagnosis, and treatment guidance,”
Trends Biotechnol., 29
(5), 213
–221
(2011). http://dx.doi.org/10.1016/j.tibtech.2011.01.006 TRBIDM 0167-7799 Google Scholar
V. Ntziachristos,
“Going deeper than microscopy: the optical imaging frontier in biology,”
Nat. Methods, 7
(8), 603
–614
(2010). http://dx.doi.org/10.1038/nmeth.1483 Google Scholar
C. Kim, C. Favazza and L. V. Wang,
“In vivo photoacoustic tomography of chemicals: high-resolution functional and molecular optical imaging at new depths,”
Chem. Rev., 110
(5), 2756
–2782
(2010). http://dx.doi.org/10.1021/cr900266s CHREAY 0009-2665 Google Scholar
J. Y. Kim et al.,
“Fast optical-resolution photoacoustic microscopy using a 2-axis water-proofing MEMS scanner,”
Sci. Rep., 5 07932
(2015). http://dx.doi.org/10.1038/srep07932 SRCEC3 2045-2322 Google Scholar
S.-L. Chen, L. J. Guo and X. Wang,
“All-optical photoacoustic microscopy,”
Photoacoustics, 3
(4), 143
–150
(2015). http://dx.doi.org/10.1016/j.pacs.2015.11.001 Google Scholar
B. Ning et al.,
“Simultaneous photoacoustic microscopy of microvascular anatomy, oxygen saturation, and blood flow,”
Opt. Lett., 40
(6), 910
–913
(2015). http://dx.doi.org/10.1364/OL.40.000910 OPLEDP 0146-9592 Google Scholar
L. Zeng et al.,
“Label-free optical-resolution photoacoustic microscopy of superficial microvasculature using a compact visible laser diode excitation,”
Opt. Express, 23
(24), 31026
–31033
(2015). http://dx.doi.org/10.1364/OE.23.031026 OPEXFF 1094-4087 Google Scholar
B. Dong et al.,
“Isometric multimodal photoacoustic microscopy based on optically transparent micro-ring ultrasonic detection,”
Optica, 2
(2), 169
–176
(2015). http://dx.doi.org/10.1364/OPTICA.2.000169 Google Scholar
W. Song et al.,
“Reflection-mode in vivo photoacoustic microscopy with subwavelength lateral resolution,”
Biomed. Opt. Express, 5
(12), 4235
–4241
(2014). http://dx.doi.org/10.1364/BOE.5.004235 BOEICL 2156-7085 Google Scholar
T. Wang et al.,
“A low-cost photoacoustic microscopy system with a laser diode excitation,”
Biomed. Opt. Express, 5
(9), 3053
–3058
(2014). http://dx.doi.org/10.1364/BOE.5.003053 BOEICL 2156-7085 Google Scholar
M.-L. Li and P.-H. Wang,
“Optical resolution photoacoustic microscopy using a Blu-ray DVD pickup head,”
Proc. SPIE, 8943 894315
(2014). http://dx.doi.org/10.1117/12.2037146 Google Scholar
E. M. Strohm, E. S. Berndl and M. C. Kolios,
“High frequency label-free photoacoustic microscopy of single cells,”
Photoacoustics, 1
(3–4), 49
–53
(2013). http://dx.doi.org/10.1016/j.pacs.2013.08.003 Google Scholar
S. Han et al.,
“In vivo virtual intraoperative surgical photoacoustic microscopy,”
Appl. Phys. Lett., 103
(20), 203702
(2013). http://dx.doi.org/10.1063/1.4830045 Google Scholar
C. Zhang et al.,
“Reflection-mode submicron-resolution in vivo photoacoustic microscopy,”
J. Biomed. Opt., 17
(2), 020501
(2012). http://dx.doi.org/10.1117/1.JBO.17.2.020501 JBOPFO 1083-3668 Google Scholar
G. Ku et al.,
“Photoacoustic microscopy with 2-microm transverse resolution,”
J. Biomed. Opt., 15
(2), 021302
(2010). http://dx.doi.org/10.1117/1.3339912 JBOPFO 1083-3668 Google Scholar
S. Hu, K. Maslov and L. V. Wang,
“Second-generation optical-resolution photoacoustic microscopy with improved sensitivity and speed,”
Opt. Lett., 36
(7), 1134
–1136
(2011). http://dx.doi.org/10.1364/OL.36.001134 OPLEDP 0146-9592 Google Scholar
W. Shi et al.,
“Optical resolution photoacoustic microscopy using novel high-repetition-rate passively Q-switched microchip and fiber lasers,”
J. Biomed. Opt., 15
(5), 056017
(2010). http://dx.doi.org/10.1117/1.3502661 JBOPFO 1083-3668 Google Scholar
L. Song et al.,
“Fast 3-D dark-field reflection-mode photoacoustic microscopy in vivo with a 30-MHz ultrasound linear array,”
J. Biomed. Opt., 13
(5), 054028
(2008). http://dx.doi.org/10.1117/1.2976141 JBOPFO 1083-3668 Google Scholar
H. F. Zhang et al.,
“Functional photoacoustic microscopy for high-resolution and noninvasive in vivo imaging,”
Nat. Biotechnol., 24
(7), 848
–851
(2006). http://dx.doi.org/10.1038/nbt1220 NABIF9 1087-0156 Google Scholar
K. Maslov, G. Stoica and L. V. Wang,
“In vivo dark-field reflection-mode photoacoustic microscopy,”
Opt. Lett., 30
(6), 625
–627
(2005). http://dx.doi.org/10.1364/OL.30.000625 OPLEDP 0146-9592 Google Scholar
J. Xiao et al.,
“Photoacoustic endoscopy with hollow structured lens-focused polyvinylidine fluoride transducer,”
Appl. Opt., 55
(9), 2301
–2305
(2016). http://dx.doi.org/10.1364/AO.55.002301 APOPAI 0003-6935 Google Scholar
C. Chen et al.,
“Mechanical characterization of intraluminal tissue with phase-resolved photoacoustic viscoelasticity endoscopy,”
Biomed. Opt. Express, 6
(12), 4975
–4980
(2015). http://dx.doi.org/10.1364/BOE.6.004975 BOEICL 2156-7085 Google Scholar
J.-M. Yang et al.,
“Simultaneous functional photoacoustic and ultrasonic endoscopy of internal organs in vivo,”
Nat. Med., 18
(8), 1297
–1302
(2012). http://dx.doi.org/10.1038/nm.2823 1078-8956 Google Scholar
J.-M. Yang et al.,
“A 2.5-mm diameter probe for photoacoustic and ultrasonic endoscopy,”
Opt. Express, 20
(21), 23944
–23953
(2012). http://dx.doi.org/10.1364/OE.20.023944 OPEXFF 1094-4087 Google Scholar
J.-M. Yang et al.,
“Volumetric photoacoustic endoscopy of internal organs: a phantom and in situ study,”
Proc. SPIE, 7564 75640D
(2010). http://dx.doi.org/10.1117/12.842503 Google Scholar
J. M. Yang et al.,
“Photoacoustic endoscopy,”
Opt. Lett., 34
(10), 1591
–1593
(2009). http://dx.doi.org/10.1364/OL.34.001591 OPLEDP 0146-9592 Google Scholar
R. Li et al.,
“Assessing breast tumor margin by multispectral photoacoustic tomography,”
Biomed. Opt. Express, 6
(4), 1273
–1281
(2015). http://dx.doi.org/10.1364/BOE.6.001273 BOEICL 2156-7085 Google Scholar
P. K. Upputuri and M. Pramanik,
“Performance characterization of low-cost, high-speed, portable pulsed laser diode photoacoustic tomography (PLD-PAT) system,”
Biomed. Opt. Express, 6
(10), 4118
–4129
(2015). http://dx.doi.org/10.1364/BOE.6.004118 BOEICL 2156-7085 Google Scholar
X. Yang et al.,
“Photoacoustic tomography of small animal brain with a curved array transducer,”
J. Biomed. Opt., 14
(5), 054007
(2009). http://dx.doi.org/10.1117/1.3227035 JBOPFO 1083-3668 Google Scholar
X. Yang and L. V. Wang,
“Monkey brain cortex imaging by photoacoustic tomography,”
J. Biomed. Opt., 13
(4), 044009
(2008). http://dx.doi.org/10.1117/1.2967907 JBOPFO 1083-3668 Google Scholar
M. Pramanik et al.,
“Design and evaluation of a novel breast cancer detection system combining both thermoacoustic (TA) and photoacoustic (PA) tomography,”
Med. Phys., 35
(6), 2218
–2223
(2008). http://dx.doi.org/10.1118/1.2911157 MPHYA6 0094-2405 Google Scholar
G. Ku et al.,
“Thermoacoustic and photoacoustic tomography of thick biological tissues toward breast imaging,”
Technol. Cancer Res. Treat., 4
(5), 559
–565
(2005). http://dx.doi.org/10.1177/153303460500400509 Google Scholar
G. Ku et al.,
“Imaging of tumor angiogenesis in rat brains in vivo by photoacoustic tomography,”
Appl. Opt., 44
(5), 770
–775
(2005). http://dx.doi.org/10.1364/AO.44.000770 APOPAI 0003-6935 Google Scholar
X. D. Wang et al.,
“Noninvasive laser-induced photoacoustic tomography for structural and functional in vivo imaging of the brain,”
Nat. Biotechnol., 21
(7), 803
–806
(2003). http://dx.doi.org/10.1038/nbt839 NABIF9 1087-0156 Google Scholar
R. A. Kruger et al.,
“Thermoacoustic CT with radiowaves: a medical imaging paradigm,”
Radiology, 211
(1), 275
–278
(1999). http://dx.doi.org/10.1148/radiology.211.1.r99ap05275 RADLAX 0033-8419 Google Scholar
P. K. Upputuri, M. Krishnan and M. Pramanik,
“Microsphere enabled sub-diffraction limited optical resolution photoacoustic microscopy—a simulation study,”
J. Biomed. Opt.,
(2016). Google Scholar
P. K. Upputuri et al.,
“Super-resolution photoacoustic microscopy using photonic nanojets: a simulation study,”
J. Biomed. Opt., 19
(11), 116003
(2014). http://dx.doi.org/10.1117/1.JBO.19.11.116003 JBOPFO 1083-3668 Google Scholar
A. Danielli et al.,
“Label-free photoacoustic nanoscopy,”
J. Biomed. Opt., 19
(8), 086006
(2014). http://dx.doi.org/10.1117/1.JBO.19.8.086006 JBOPFO 1083-3668 Google Scholar
C. Zhang, K. Maslov and L. V. Wang,
“Subwavelength-resolution label-free photoacoustic microscopy of optical absorption in vivo,”
Opt. Lett., 35
(19), 3195
–3197
(2010). http://dx.doi.org/10.1364/OL.35.003195 OPLEDP 0146-9592 Google Scholar
P. K. Upputuri and M. Pramanik,
“Pulsed laser diode based optoacoustic imaging of biological tissues,”
Biomed. Phys. Eng. Express, 1
(4), 045010
–045017
(2015). http://dx.doi.org/10.1088/2057-1976/1/4/045010 Google Scholar
L. Zeng et al.,
“3D-visual laser-diode-based photoacoustic imaging,”
Opt. Express, 20
(2), 1237
–1246
(2012). http://dx.doi.org/10.1364/OE.20.001237 OPEXFF 1094-4087 Google Scholar
J. S. Allen and P. Beard,
“Pulsed near-infrared laser diode excitation system for biomedical photoacoustic imaging,”
Opt. Lett., 31
(23), 3462
–3464
(2006). http://dx.doi.org/10.1364/OL.31.003462 OPLEDP 0146-9592 Google Scholar
J. T. Allen and C. P. Beard,
“High power visible light emitting diodes as pulsed excitation sources for biomedical photoacoustics,”
Biomed. Opt. Express, 7
(3), 1260
–1270
(2016). http://dx.doi.org/10.1364/BOE.7.001260 BOEICL 2156-7085 Google Scholar
G. Li et al.,
“Multiview Hilbert transformation for full-view photoacoustic computed tomography using a linear array,”
J. Biomed. Opt., 20
(6), 066010
(2015). http://dx.doi.org/10.1117/1.JBO.20.6.066010 JBOPFO 1083-3668 Google Scholar
S. A. Ermilov et al.,
“Laser optoacoustic imaging system for detection of breast cancer,”
J. Biomed. Opt., 14
(2), 024007
(2009). http://dx.doi.org/10.1117/1.3086616 JBOPFO 1083-3668 Google Scholar
X. L. Dean-Ben and D. Razansky,
“Portable spherical array probe for volumetric real-time optoacoustic imaging at centimeter-scale depths,”
Opt. Express, 21
(23), 28062
–28071
(2013). http://dx.doi.org/10.1364/OE.21.028062 OPEXFF 1094-4087 Google Scholar
H. Ke et al.,
“Performance characterization of an integrated ultrasound, photoacoustic, and thermoacoustic imaging system,”
J. Biomed. Opt., 17
(5), 056010
(2012). http://dx.doi.org/10.1117/1.JBO.17.5.056010 JBOPFO 1083-3668 Google Scholar
L. Nie et al.,
“Photoacoustic tomography through a whole adult human skull with a photon recycler,”
J. Biomed. Opt., 17
(11), 110506
(2012). http://dx.doi.org/10.1117/1.JBO.17.11.110506 JBOPFO 1083-3668 Google Scholar
X. Cai et al.,
“Photoacoustic tomography of foreign bodies in soft biological tissue,”
J. Biomed. Opt., 16
(4), 046017
(2011). http://dx.doi.org/10.1117/1.3569613 JBOPFO 1083-3668 Google Scholar
M. Pramanik and L. V. Wang,
“Thermoacoustic and photoacoustic sensing of temperature,”
J. Biomed. Opt., 14
(5), 054024
(2009). http://dx.doi.org/10.1117/1.3247155 JBOPFO 1083-3668 Google Scholar
J. Yao, J. Xia and L. V. Wang,
“Multiscale functional and molecular photoacoustic tomography,”
Ultrason. Imaging, 38
(1), 44
–62
(2016). http://dx.doi.org/10.1177/0161734615584312 ULIMD4 0161-7346 Google Scholar
J. Xia, Y. Wang and H. Wan,
“Recent progress in multimodal photoacoustic tomography,”
X-Acoust.: Imaging Sens., 1
(1),
(2015). http://dx.doi.org/10.1515/phto-2015-0008 Google Scholar
J. Yao and L. V. Wang,
“Breakthroughs in photonics 2013: photoacoustic tomography in biomedicine,”
IEEE Photonics J., 6
(2), 1
–6
(2014). http://dx.doi.org/10.1109/JPHOT.2014.2310197 Google Scholar
J. Xia, J. Yao and L. V. Wang,
“Photoacoustic tomography: principles and advances,”
Prog. Electromagn. Res., 147 1
–22
(2014). http://dx.doi.org/10.2528/PIER14032303 Google Scholar
J. Xia and L. V. Wang,
“Small-animal whole-body photoacoustic tomography: a review,”
IEEE Trans. Biomed. Eng., 61
(5), 1380
–1389
(2014). http://dx.doi.org/10.1109/TBME.2013.2283507 IEBEAX 0018-9294 Google Scholar
L. V. Wang and J. Yao,
“A practical guide to photoacoustic tomography in the life sciences,”
Nat. Methods, 13
(8), 627
–638
(2016). http://dx.doi.org/10.1038/nmeth.3925 Google Scholar
A. Taruttis and V. Ntziachristos,
“Advances in real-time multispectral optoacoustic imaging and its applications,”
Nat. Photonics, 9
(4), 219
–227
(2015). http://dx.doi.org/10.1038/nphoton.2015.29 Google Scholar
K. S. Valluru and J. K. Willmann,
“Clinical photoacoustic imaging of cancer,”
Ultrasonography, 35
(4), 267
–280
(2016). http://dx.doi.org/10.14366/usg.16035 Google Scholar
G. Ku et al.,
“Multiple-bandwidth photoacoustic tomography,”
Phys. Med. Biol., 49
(7), 1329
–1338
(2004). http://dx.doi.org/10.1088/0031-9155/49/7/018 PHMBA7 0031-9155 Google Scholar
R. A. Kruger et al.,
“Photoacoustic ultrasound (PAUS)—reconstruction tomography,”
Med. Phys., 22
(10), 1605
–1609
(1995). http://dx.doi.org/10.1118/1.597429 MPHYA6 0094-2405 Google Scholar
R. Ma et al.,
“Multispectral optoacoustic tomography (MSOT) scanner for whole-body small animal imaging,”
Opt. Express, 17
(24), 21414
–21426
(2009). http://dx.doi.org/10.1364/OE.17.021414 OPEXFF 1094-4087 Google Scholar
M. Pramanik, G. Ku and L. V. Wang,
“Tangential resolution improvement in thermoacoustic and photoacoustic tomography using a negative acoustic lens,”
J. Biomed. Opt., 14
(2), 024028
(2009). http://dx.doi.org/10.1117/1.3103778 JBOPFO 1083-3668 Google Scholar
C. Li, G. Ku and L. V. Wang,
“Negative lens concept for photoacoustic tomography,”
Phys. Rev. E, 78
(2), 021901
(2008). http://dx.doi.org/10.1103/PhysRevE.78.021901 Google Scholar
S. K. Kalva and M. Pramanik,
“Experimental validation of tangential resolution improvement in photoacoustic tomography using a modified delay-and-sum reconstruction algorithm,”
J. Biomed. Opt., 21
(8), 086011
(2016). http://dx.doi.org/10.1117/1.JBO.21.8.086011 JBOPFO 1083-3668 Google Scholar
M. Pramanik,
“Improving tangential resolution with a modified delay-and-sum reconstruction algorithm in photoacoustic and thermoacoustic tomography,”
J. Opt. Soc. Am. A, 31
(3), 621
–627
(2014). http://dx.doi.org/10.1364/JOSAA.31.000621 JOAOD6 0740-3232 Google Scholar
R. Cheng et al.,
“Noninvasive assessment of early dental lesion using a dual-contrast photoacoustic tomography,”
Sci. Rep., 6 21798
(2016). http://dx.doi.org/10.1038/srep21798 SRCEC3 2045-2322 Google Scholar
American National Standard for Safe Use of Lasers ANSI Z136.1-2000, American National Standards Institute, Inc., New York, NY
(2000). Google Scholar
Z. Deng, W. Li and C. Li,
“Slip-ring-based multi-transducer photoacoustic tomography system,”
Opt. Lett., 41
(12), 2859
–2862
(2016). http://dx.doi.org/10.1364/OL.41.002859 OPLEDP 0146-9592 Google Scholar
A. A. Oraevsky et al.,
“Advanced laser system for 3D optoacoustic tomography of the breast,”
Proc. SPIE, 9708 97085B
(2016). http://dx.doi.org/10.1117/12.2209398 Google Scholar
A. A. Oraevsky et al.,
“Quantitative assessment of photoacoustic tomography systems integrating clinical ultrasound transducers using novel tissue-simulating phantoms,”
Proc. SPIE, 9323 932333
(2015). http://dx.doi.org/10.1117/12.2080283 Google Scholar
P. K. Upputuri and M. Pramanik,
“High-speed pre-clinical brain imaging using pulsed laser diode based photoacoustic tomography (PLD-PAT) system,”
Proc. SPIE, 9708 97084R
(2016). http://dx.doi.org/10.1117/12.2211891 Google Scholar
C. Li et al.,
“Real-time photoacoustic tomography of cortical hemodynamics in small animals,”
J. Biomed. Opt., 15
(1), 010509
(2010). http://dx.doi.org/10.1117/1.3302807 JBOPFO 1083-3668 Google Scholar
J. Gamelin et al.,
“Curved array photoacoustic tomographic system for small animal imaging,”
J. Biomed. Opt., 13
(2), 024007
(2008). http://dx.doi.org/10.1117/1.2907157 JBOPFO 1083-3668 Google Scholar
Y. Zeng et al.,
“Photoacoustic and ultrasonic coimage with a linear transducer array,”
Opt. Lett., 29
(15), 1760
–1762
(2004). http://dx.doi.org/10.1364/OL.29.001760 OPLEDP 0146-9592 Google Scholar
X. Li et al.,
“High resolution functional photoacoustic tomography of breast cancer,”
Med. Phys., 42
(9), 5321
–5328
(2015). http://dx.doi.org/10.1118/1.4928598 MPHYA6 0094-2405 Google Scholar
L. Xi et al.,
“Design and evaluation of a hybrid photoacoustic tomography and diffuse optical tomography system for breast cancer detection,”
Med. Phys., 39
(5), 2584
–2594
(2012). http://dx.doi.org/10.1118/1.3703598 MPHYA6 0094-2405 Google Scholar
M. Heijblom et al.,
“Photoacoustic image patterns of breast carcinoma and comparisons with magnetic resonance imaging and vascular stained histopathology,”
Sci. Rep., 5 11778
(2015). http://dx.doi.org/10.1038/srep11778 SRCEC3 2045-2322 Google Scholar
X. L. Dean-Ben et al.,
“Volumetric hand-held optoacoustic angiography as a tool for real-time screening of dense breast,”
J. Biophotonics, 9
(3), 253
–259
(2016). http://dx.doi.org/10.1002/jbio.v9.3 Google Scholar
R. A. Kruger et al.,
“Photoacoustic angiography of the breast,”
Med. Phys., 37
(11), 6096
–6100
(2010). http://dx.doi.org/10.1118/1.3497677 MPHYA6 0094-2405 Google Scholar
B. Lashkari and A. Mandelis,
“Comparison between pulsed laser and frequency-domain photoacoustic modalities: signal-to-noise ratio, contrast, resolution, and maximum depth detectivity,”
Rev. Sci. Instrum., 82
(9), 094903
–094914
(2011). http://dx.doi.org/10.1063/1.3632117 RSINAK 0034-6748 Google Scholar
IEC 60825-1:1993+ A1:1997+ A2:2001, in Part 1: Equipment Classification, Requirements and User’s Guide Edition 1:1993 Consolidated with Amendments 1:1997 and 2:2001, International Electrotechnical CommissionGeneva, Switzerland,Google Scholar
D. R. Reinecke et al.,
“Co-registered photoacoustic, thermoacoustic, and ultrasound mouse imaging,”
Proc. SPIE, 7564 756420
(2010). http://dx.doi.org/10.1117/12.841147 Google Scholar
X. L. Dean-Ben, A. Ozbek and D. Razansky,
“Volumetric real-time tracking of peripheral human vasculature with GPU-accelerated three-dimensional optoacoustic tomography,”
IEEE Trans. Med. Imaging, 32
(11), 2050
–2055
(2013). http://dx.doi.org/10.1109/TMI.2013.2272079 Google Scholar
A. Dima and V. Ntziachristos,
“Non-invasive carotid imaging using optoacoustic tomography,”
Opt. Express, 20
(22), 25044
–25057
(2012). http://dx.doi.org/10.1364/OE.20.025044 OPEXFF 1094-4087 Google Scholar
X. L. Deán-Ben and D. Razansky,
“Adding fifth dimension to optoacoustic imaging: volumetric time-resolved spectrally enriched tomography,”
Light: Sci. Appl., 3
(1), e137
(2014). http://dx.doi.org/10.1038/lsa.2014.18 Google Scholar
V. Neuschmelting et al.,
“Lymph node micrometastases and in-transit metastases from melanoma: in vivo detection with multispectral optoacoustic imaging in a mouse model,”
Radiology, 280
(1), 137
–150
(2016). http://dx.doi.org/10.1148/radiol.2016160191 RADLAX 0033-8419 Google Scholar
J. Tang et al.,
“Wearable 3-D photoacoustic tomography for functional brain imaging in behaving rats,”
Sci. Rep., 6 25470
(2016). http://dx.doi.org/10.1038/srep25470 SRCEC3 2045-2322 Google Scholar
K. M. McMasters et al.,
“Sentinel lymph node biopsy for breast cancer: a suitable alternative to routine axillary dissection in multi-institutional practice when optimal technique is used,”
J. Clin. Oncol., 18
(13), 2560
–2566
(2000). JCONDN 0732-183X Google Scholar
D. Krag et al.,
“The sentinel node in breast cancer,”
N. Engl. J. Med., 339
(14), 941
–946
(1998). http://dx.doi.org/10.1056/NEJM199810013391401 NEJMAG 0028-4793 Google Scholar
O. A. Ung et al.,
“Australasian experience and trials in sentinel lymph node biopsy: the RACS SNAC trial,”
Asian J. Surg., 27
(4), 284
–290
(2004). http://dx.doi.org/10.1016/S1015-9584(09)60052-X AJSUEF Google Scholar
A. D. Purushotham et al.,
“Morbidity after sentinel lymph node biopsy in primary breast cancer: results from a randomized controlled trial,”
J. Clin. Oncol., 23
(19), 4312
–4321
(2005). http://dx.doi.org/10.1200/JCO.2005.03.228 JCONDN 0732-183X Google Scholar
K. K. Swenson et al.,
“Comparison of side effects between sentinel lymph node and axillary lymph node dissection for breast cancer,”
Ann. Surg. Oncol., 9
(8), 745
–753
(2002). http://dx.doi.org/10.1007/BF02574496 Google Scholar
G. P. Luke et al.,
“Sentinel lymph node biopsy revisited: ultrasound-guided photoacoustic detection of micrometastases using molecularly targeted plasmonic nanosensors,”
Cancer Res., 74
(19), 5397
–5408
(2014). http://dx.doi.org/10.1158/0008-5472.CAN-14-0796 CNREA8 0008-5472 Google Scholar
C. Kim et al.,
“Handheld array-based photoacoustic probe for guiding needle biopsy of sentinel lymph nodes,”
J. Biomed. Opt., 15
(4), 046010
(2010). http://dx.doi.org/10.1117/1.3469829 JBOPFO 1083-3668 Google Scholar
T. N. Erpelding et al.,
“Sentinel lymph nodes in the rat: noninvasive photoacoustic and US imaging with a clinical US system,”
Radiology, 256
(1), 102
–110
(2010). http://dx.doi.org/10.1148/radiol.10091772 RADLAX 0033-8419 Google Scholar
A. Garcia-Uribe et al.,
“Dual-modality photoacoustic and ultrasound imaging system for noninvasive sentinel lymph node detection in patients with breast cancer,”
Sci. Rep., 5 15748
(2015). http://dx.doi.org/10.1038/srep15748 SRCEC3 2045-2322 Google Scholar
D. Piras et al.,
“Photoacoustic needle: minimally invasive guidance to biopsy,”
J. Biomed. Opt., 18
(7), 070502
(2013). http://dx.doi.org/10.1117/1.JBO.18.7.070502 JBOPFO 1083-3668 Google Scholar
K. Daoudi et al.,
“Handheld probe integrating laser diode and ultrasound transducer array for ultrasound/photoacoustic dual modality imaging,”
Opt. Express, 22
(21), 26365
–26374
(2014). http://dx.doi.org/10.1364/OE.22.026365 OPEXFF 1094-4087 Google Scholar
L. G. Montilla et al.,
“Real-time photoacoustic and ultrasound imaging: a simple solution for clinical ultrasound systems with linear arrays,”
Phys. Med. Biol., 58
(1), N1
–N12
(2013). http://dx.doi.org/10.1088/0031-9155/58/1/N1 PHMBA7 0031-9155 Google Scholar
K. Sivasubramanian and M. Pramanik,
“High frame rate photoacoustic imaging at 7000 frames per second using clinical ultrasound system,”
Biomed. Opt. Express, 7
(2), 312
–323
(2016). http://dx.doi.org/10.1364/BOE.7.000312 BOEICL 2156-7085 Google Scholar
Y. Wang et al.,
“Slit-enabled linear-array photoacoustic tomography with near isotropic spatial resolution in three dimensions,”
Opt. Lett., 41
(1), 127
–130
(2016). http://dx.doi.org/10.1364/OL.41.000127 OPLEDP 0146-9592 Google Scholar
W. Shu et al.,
“Broadening the detection view of 2D photoacoustic tomography using two linear array transducers,”
Opt. Express, 24
(12), 12755
–12768
(2016). http://dx.doi.org/10.1364/OE.24.012755 OPEXFF 1094-4087 Google Scholar
L. Wang et al.,
“Ultrasonic-heating-encoded photoacoustic tomography with virtually augmented detection view,”
Optica, 2
(4), 307
–312
(2015). http://dx.doi.org/10.1364/OPTICA.2.000307 Google Scholar
X. Wang, D. L. Chamberland and D. A. Jamadar,
“Noninvasive photoacoustic tomography of human peripheral joints toward diagnosis of inflammatory arthritis,”
Opt. Lett., 32
(20), 3002
–3005
(2007). http://dx.doi.org/10.1364/OL.32.003002 OPLEDP 0146-9592 Google Scholar
J. Xiao et al.,
“Quantitative two-dimensional photoacoustic tomography of osteoarthritis in the finger joints,”
Opt. Express, 18
(14), 14359
–14365
(2010). http://dx.doi.org/10.1364/OE.18.014359 OPEXFF 1094-4087 Google Scholar
Y. Sun, E. S. Sobel and H. Jiang,
“First assessment of three-dimensional quantitative photoacoustic tomography for in vivo detection of osteoarthritis in the finger joints,”
Med. Phys., 38
(7), 4009
–4017
(2011). http://dx.doi.org/10.1118/1.3598113 MPHYA6 0094-2405 Google Scholar
L. Xi and H. Jiang,
“High resolution three-dimensional photoacoustic imaging of human finger joints in vivo,”
Appl. Phys. Lett., 107
(6), 063701
(2015). http://dx.doi.org/10.1063/1.4926859 Google Scholar
G. Xu et al.,
“Photoacoustic and ultrasound dual-modality imaging of human peripheral joints,”
J. Biomed. Opt., 18
(1), 010502
(2013). http://dx.doi.org/10.1117/1.JBO.18.1.010502 JBOPFO 1083-3668 Google Scholar
K. Daoudi et al.,
“Handheld probe for portable high frame photoacoustic/ultrasound imaging system,”
Proc. SPIE, 8581 85812I
(2013). http://dx.doi.org/10.1117/12.2003655 Google Scholar
M. Gerling et al.,
“Real-time assessment of tissue hypoxia in vivo with combined photoacoustics and high-frequency ultrasound,”
Theranostics, 4
(6), 604
–613
(2014). http://dx.doi.org/10.7150/thno.7996 Google Scholar
F. Maccarinelli et al.,
“Photoacoustic molecular imaging for liver iron quantitation,”
J. Biomed. Opt., 21
(5), 056008
(2016). http://dx.doi.org/10.1117/1.JBO.21.5.056008 JBOPFO 1083-3668 Google Scholar
A. Liopo, R. Su and A. A. Oraevsky,
“Melanin nanoparticles as a novel contrast agent for optoacoustic tomography,”
Photoacoustics, 3
(1), 35
–43
(2015). http://dx.doi.org/10.1016/j.pacs.2015.02.001 Google Scholar
J. V. Jokerst et al.,
“Cellulose nanoparticles are a biodegradable photoacoustic contrast agent for use in living mice,”
Photoacoustics, 2
(3), 119
–127
(2014). http://dx.doi.org/10.1016/j.pacs.2014.07.001 Google Scholar
R. A. Kruger et al.,
“Dedicated 3D photoacoustic breast imaging,”
Med. Phys., 40
(11), 113301
(2013). http://dx.doi.org/10.1118/1.4824317 MPHYA6 0094-2405 Google Scholar
J. Dean et al.,
“Real-time photoacoustic data acquisition with Philips iU22 ultrasound scanner,”
Proc. SPIE, 6856 685622
(2008). http://dx.doi.org/10.1117/12.763658 Google Scholar
K. Zell et al.,
“First practical experiences with the optoacoustic/ultrasound system OPUS,”
Proc. SPIE, 6856 68560S
(2008). http://dx.doi.org/10.1117/12.762948 Google Scholar
C. Lutzweiler, X. L. Dean-Ben and D. Razansky,
“Expediting model-based optoacoustic reconstructions with tomographic symmetries,”
Med. Phys., 41
(1), 013302
(2014). http://dx.doi.org/10.1118/1.4846055 MPHYA6 0094-2405 Google Scholar
C. Huang et al.,
“Full-wave iterative image reconstruction in photoacoustic tomography with acoustically inhomogeneous media,”
IEEE Trans. Med. Imaging, 32
(6), 1097
–1110
(2013). http://dx.doi.org/10.1109/TMI.2013.2254496 Google Scholar
N. A. Rejesh, H. Pullagurla and M. Pramanik,
“Deconvolution-based deblurring of reconstructed images in photoacoustic/thermoacoustic tomography,”
J. Opt. Soc. Am. A, 30
(10), 1994
–2001
(2013). http://dx.doi.org/10.1364/JOSAA.30.001994 JOAOD6 0740-3232 Google Scholar
M. Xu and L. V. Wang,
“Universal back-projection algorithm for photoacoustic computed tomography,”
Phys. Rev. E, 71
(1), 016706
(2005). http://dx.doi.org/10.1103/PhysRevE.71.016706 Google Scholar
K. P. Köstli and P. C. Beard,
“Two-dimensional photoacoustic imaging by use of Fourier-transform image reconstruction and a detector with an anisotropic response,”
Appl. Opt., 42
(10), 1899
–1908
(2003). http://dx.doi.org/10.1364/AO.42.001899 APOPAI 0003-6935 Google Scholar
M. Xu and L. V. Wang,
“Pulsed-microwave-induced thermoacoustic tomography: filtered backprojection in a circular measurement configuration,”
Med. Phys., 29
(8), 1661
–1669
(2002). http://dx.doi.org/10.1118/1.1493778 MPHYA6 0094-2405 Google Scholar
M. Xu and L. V. Wang,
“Time-domain reconstruction for thermoacoustic tomography in a spherical geometry,”
IEEE Trans. Med. Imaging, 21
(7), 814
–822
(2002). http://dx.doi.org/10.1109/TMI.2002.801176 Google Scholar
G. Paltauf et al.,
“Iterative reconstruction algorithm for optoacoustic imaging,”
J. Acoust. Soc. Am., 112
(4), 1536
–1544
(2002). http://dx.doi.org/10.1121/1.1501898 Google Scholar
C. B. Shaw et al.,
“Least squares QR-based decomposition provides an efficient way of computing optimal regularization parameter in photoacoustic tomography,”
J. Biomed. Opt., 18
(8), 080501
(2013). http://dx.doi.org/10.1117/1.JBO.18.8.080501 JBOPFO 1083-3668 Google Scholar
J. Prakash et al.,
“Basis pursuit deconvolution for improving model-based reconstructed images in photoacoustic tomography,”
Biomed. Opt. Express, 5
(5), 1363
–1377
(2014). http://dx.doi.org/10.1364/BOE.5.001363 BOEICL 2156-7085 Google Scholar
H. Huang et al.,
“An adaptive filtered back-projection for photoacoustic image reconstruction,”
Med. Phys., 42
(5), 2169
–2178
(2015). http://dx.doi.org/10.1118/1.4915532 MPHYA6 0094-2405 Google Scholar
M. Haltmeier, L. Neumann and S. Rabanser,
“Single-stage reconstruction algorithm for quantitative photoacoustic tomography,”
Inverse Probl., 31
(6), 065005
(2015). http://dx.doi.org/10.1088/0266-5611/31/6/065005 INPEEY 0266-5611 Google Scholar
L. Liu et al.,
“Photoacoustic tomography from weak and noisy signals by using a pulse decomposition algorithm in the time-domain,”
Opt. Express, 23
(21), 26969
–26977
(2015). http://dx.doi.org/10.1364/OE.23.026969 OPEXFF 1094-4087 Google Scholar
D. Wang et al.,
“Coherent-weighted three-dimensional image reconstruction in linear-array-based photoacoustic tomography,”
Biomed. Opt. Express, 7
(5), 1957
–1965
(2016). http://dx.doi.org/10.1364/BOE.7.001957 BOEICL 2156-7085 Google Scholar
M. Cao et al.,
“Full-view photoacoustic tomography using asymmetric distributed sensors optimized with compressed sensing method,”
Biomed. Signal Process. Control, 21 19
–25
(2015). http://dx.doi.org/10.1016/j.bspc.2015.05.009 Google Scholar
E. Zhang, J. Laufer and P. Beard,
“Backward-mode multiwavelength photoacoustic scanner using a planar Fabry-Perot polymer film ultrasound sensor for high-resolution three-dimensional imaging of biological tissues,”
Appl. Opt., 47
(4), 561
–577
(2008). http://dx.doi.org/10.1364/AO.47.000561 APOPAI 0003-6935 Google Scholar
Y. Hou et al.,
“Thin polymer etalon arrays for high-resolution photoacoustic imaging,”
J. Biomed. Opt., 13
(6), 064033
(2008). http://dx.doi.org/10.1117/1.3042260 JBOPFO 1083-3668 Google Scholar
O. Warshavski et al.,
“Experimental evaluation of cMUT and PZT transducers in receive only mode for photoacoustic imaging,”
Proc. SPIE, 9708 970830
(2016). http://dx.doi.org/10.1117/12.2211799 Google Scholar
S. R. Kothapalli et al.,
“Deep tissue photoacoustic imaging using a miniaturized 2-D capacitive micromachined ultrasonic transducer array,”
IEEE Trans. Biomed. Eng., 59
(5), 1199
–1204
(2012). http://dx.doi.org/10.1109/TBME.2012.2183593 IEBEAX 0018-9294 Google Scholar
M. Venugopal et al.,
“Quantitative photoacoustic tomography by stochastic search: direct recovery of the optical absorption field,”
Opt. Lett., 41
(18), 4202
–4205
(2016). http://dx.doi.org/10.1364/OL.41.004202 OPLEDP 0146-9592 Google Scholar
T. Saratoon et al.,
“A gradient-based method for quantitative photoacoustic tomography using the radiative transfer equation,”
Inverse Probl., 29
(7), 075006
(2013). http://dx.doi.org/10.1088/0266-5611/29/7/075006 INPEEY 0266-5611 Google Scholar
B. Cox et al.,
“Quantitative spectroscopic photoacoustic imaging: a review,”
J. Biomed. Opt., 17
(6), 061202
(2012). http://dx.doi.org/10.1117/1.JBO.17.6.061202 JBOPFO 1083-3668 Google Scholar
B. T. Cox, J. G. Laufer and P. C. Beard,
“The challenges for quantitative photoacoustic imaging,”
Proc. SPIE, 7177 717713
(2009). http://dx.doi.org/10.1117/12.806788 Google Scholar
M. Heijblom et al.,
“Visualizing breast cancer using the Twente photoacoustic mammoscope: what do we learn from twelve new patient measurements?,”
Opt. Express, 20
(11), 11582
–11597
(2012). http://dx.doi.org/10.1364/OE.20.011582 OPEXFF 1094-4087 Google Scholar
D. Piras et al.,
“Photoacoustic imaging of the breast using the Twente photoacoustic mammoscope: present status and future perspectives,”
IEEE J. Sel. Top. Quantum Electron., 16
(4), 730
–739
(2010). http://dx.doi.org/10.1109/JSTQE.2009.2034870 Google Scholar
S. Huang et al.,
“A dual-functional benzobisthiadiazole derivative as an effective theranostic agent for near-infrared photoacoustic imaging and photothermal therapy,”
J. Materi. Chem. B, 4
(9), 1696
–1703
(2016). http://dx.doi.org/10.1039/C5TB02367J Google Scholar
M. Olivo and U. S. Dinish, Frontiers in Biophotonics for Translational Medicine, Springer(2016). Google Scholar
J. M. Yoo, J. H. Kang and B. H. Hong,
“Graphene-based nanomaterials for versatile imaging studies,”
Chem. Soc. Rev., 44
(14), 4835
–4852
(2015). http://dx.doi.org/10.1039/C5CS00072F CSRVBR 0306-0012 Google Scholar
G. Hong et al.,
“Carbon nanomaterials for biological imaging and nanomedicinal therapy,”
Chem. Rev., 115
(19), 10816
–10906
(2015). http://dx.doi.org/10.1021/acs.chemrev.5b00008 CHREAY 0009-2665 Google Scholar
L. Nie and X. Chen,
“Structural and functional photoacoustic molecular tomography aided by emerging contrast agents,”
Chem. Soc. Rev., 43
(20), 7132
–7170
(2014). http://dx.doi.org/10.1039/C4CS00086B CSRVBR 0306-0012 Google Scholar
G. P. Luke et al.,
“Silica-coated gold nanoplates as stable photoacoustic contrast agents for sentinel lymph node imaging,”
Nanotechnology, 24
(45), 455101
(2013). http://dx.doi.org/10.1088/0957-4484/24/45/455101 NNOTER 0957-4484 Google Scholar
Z. Zha et al.,
“Biocompatible polypyrrole nanoparticles as a novel organic photoacoustic contrast agent for deep tissue imaging,”
Nanoscale, 5
(10), 4462
–4467
(2013). http://dx.doi.org/10.1039/c3nr00627a NANOHL 2040-3364 Google Scholar
G. Ku et al.,
“Copper sulfide nanoparticles as a new class of photoacoustic contrast agent for deep tissue imaging at 1064 nm,”
ACS Nano, 6
(8), 7489
–7496
(2012). http://dx.doi.org/10.1021/nn302782y ANCAC3 1936-0851 Google Scholar
D. Pan et al.,
“Recent advances in colloidal gold nanobeacons for molecular photoacoustic imaging,”
Contrast Media Mol. Imaging, 6
(5), 378
–388
(2011). http://dx.doi.org/10.1002/cmmi.449 Google Scholar
K. Homan et al.,
“Silver nanosystems for photoacoustic imaging and image-guided therapy,”
J. Biomed. Opt., 15
(2), 021316
(2010). http://dx.doi.org/10.1117/1.3365937 JBOPFO 1083-3668 Google Scholar
A. De la Zerda et al.,
“Carbon nanotubes as photoacoustic molecular imaging agents in living mice,”
Nat. Nanotechnol., 3
(9), 557
–562
(2008). http://dx.doi.org/10.1038/nnano.2008.231 Google Scholar
Y. Shi et al.,
“Targeted Aucore-Agshell nanorods as a dual-functional contrast agent for photoacoustic imaging and photothermal therapy,”
Biomed. Opt. Express, 7
(5), 1830
–1841
(2016). http://dx.doi.org/10.1364/BOE.7.001830 BOEICL 2156-7085 Google Scholar
J. Xia, C. Kim and J. F. Lovell,
“Opportunities for photoacoustic-guided drug delivery,”
Curr. Drug Targets, 16
(6), 571
–581
(2015). http://dx.doi.org/10.2174/1389450116666150707100328 Google Scholar
J. Kim et al.,
“Photoacoustic imaging platforms for multimodal imaging,”
Ultrasonography, 34
(2), 88
–97
(2015). http://dx.doi.org/10.14366/usg.14062 Google Scholar
BiographyPaul Kumar Upputuri is currently working as a research fellow at Nanyang Technological University. He received his PhD in physics from the Indian Institute of Technology (IIT), Madras, India in 2010. He has published around 65 papers in journals and conference proceedings. His research areas are biomedical imaging, coherent Raman microscopy, ultrafast-lasers, optical metrology, and instrumentation. He is a member of SPIE, OSA, Indian Laser Association (ILA), and Optical Society of Indian (OSI). Manojit Pramanik received his PhD in biomedical engineering from Washington University in St. Louis, Missouri, USA. He is an assistant professor of the School of Chemical and Biomedical Engineering, Nanyang Technological University, Singapore. His research interests include the development of photoacoustic/thermoacoustic imaging systems, image reconstruction methods, clinical application areas such as breast cancer imaging, molecular imaging, contrast agent development, Monte Carlo simulation of light propagation in biological tissue. |
|||||||||||||||||||||||||||||||||||||||||||||||||||||||||||||||||||||||||||||


