
|
|
1.IntroductionBreast cancer is one of the most common malignant diseases in women.1 Early diagnosis and treatment are key factors in increasing the survival rate among breast cancer patients. The number of patients who undergo primary systemic therapy (PST) has increased; thus, efforts have been made to develop a sensitive method for monitoring treatment effects. Conventional diagnostic modalities, such as x-ray mammography (MMG), ultrasonography, and magnetic resonance imaging (MRI), are useful for diagnosis, but each of these has its drawbacks. MMG involves exposure to ionizing radiation and has poor diagnostic capabilities when scanning dense breast tissue, whereas the results of ultrasonography depend largely on instrument performance and the examiner’s skill. Breast MRI requires the use of a contrast medium and is limited by the high cost of testing and restricted access to MR scanners, making MRI unsuitable for mass screening and repeated examinations. The optical imaging of breast cancer using near-infrared radiation has drawn considerable attention because this method can noninvasively measure the hemoglobin (Hb) distribution and oxygenation state inside the tissue.2,3 Angiogenesis is essential for breast cancer growth and correlated with the malignant potential of a precursor lesion.4 The microvessel density in tumor tissue decreases significantly in response to PST, starting early in the treatment period.5 In addition, tumor hypoxia is associated with adverse effects on survival and response to treatment.6 Therefore, optical imaging has the potential to form the basis of diagnostic modalities for breast cancer. Several clinical studies have reported promising results from diffuse optical tomography (DOT) for the differential diagnosis and therapeutic monitoring of breast cancer.7–9 However, the clinical usefulness of DOT is currently limited because of its poor spatial resolution. Photoacoustic (or optoacoustic) tomography (PAT) is another photoacoustic (PA)-based optical imaging technology that has the ability to image the Hb distribution and oxygenation state inside tissues with higher spatial resolution than DOT. There have been many theoretical analyses and imaging studies of mammographic phantoms using PAT, and several preliminary reports have used these approaches for human breast cancer diagnosis.10–16 Kruger et al.10 used a photoacoustic mammography (PAM) system with a hemispherical detector array to obtain breast images from four healthy female volunteers. Although the vascular networks were apparently clearly imaged, no morphological information could be obtained using this system. Four groups have also published reports on the imaging of breast cancer by PAM. Ermilov et al.11 used a PAM system with a hemicylindrical detector array, and Li et al.12 developed a system with a cylindrically shaped array. The PAM system used by Manohar et al.13 consisted of a flat, static detector array and a light delivery system illuminated from the cranial direction. Kitai et al.16 also presented clinical results obtained using a dual-illumination-mode PAM prototype developed by our group that has a flat scanning detector and a light delivery system from both the cranial and caudal directions; hereafter, this is referred to as PAM-01. These four reports demonstrated the ability of a PAM system to detect breast cancer lesions compared with MMG and/or MRI. Although it is important to compare the images obtained by PAM with those obtained by other standard methods, sufficient attention must also be paid to breast shape and position because of differences in the breast setting in each method. There are several reports of multimodality systems used in combination with PAT. Xi et al.17 reported a hybrid PAT and DOT system. However, no anatomical information could be obtained from this combination because both methods are intended for functional imaging. Otto et al.18 reported a handheld PAT system consisting of a conventional ultrasound (US) linear array and an optical fiber that enables the simultaneous acquisition of PA and US images. Garcia-Uribe et al.19 used a similar handheld PAT system with a contrast agent. However, one drawback of these methods is that the handheld system depends on the examiner’s skill, as noted above. Ke et al.20 reported on imaging mammographic phantoms using an integrated US, PA, and thermoacoustic imaging system. This PA system trialed the use of methylene blue as a contrast agent and did not refer to the measurement of Hb saturation and tumor hypoxia. Although the application of a dedicated PAM structure appeared to be feasible, they reported that the system’s performance, in terms of imaging penetration depth and image quality, should be verified in actual clinical applications in the future. In this paper, we report the details and components of the first dedicated breast PAM system capable of simultaneously acquiring PA and US images, and present initial clinical results for the detection of human breast cancer. 2.Materials and Methods2.1.Device ConfigurationThe fundamental design of the present PAM prototype (PAM-02) follows that of PAM-01. Figure 1 shows a photograph of PAM-02. The bed has been widened compared with PAM-01 so that patients are able to move in any direction while in a prone position. This enables the acquisition of images in either the cranio-caudal (CC) or medio-lateral oblique (MLO) direction, similar to MMG. The lower right diagram in Fig. 1 is a schematic of the patients’ position. Figure 2 is a schematic illustration of an actual breast setting in the prone position; Figs. 2(a) and 2(c) show the CC positions of left and right breasts, respectively, whereas Figs. 2(b) and 2(d) show the MLO positions of left and right breasts, respectively. After setting the prone position in an appropriate direction, one of the breasts is inserted into the opening and mildly compressed between two transparent holding plates. In this paper, we refer to the Cartesian plane as that running parallel to the holding plates. The -axis is a horizontal line and the -axis is a vertical line. The holding plates move along the -axis. Fig. 1Photograph of PAM-02 and schematic illustration of the axes of the body according to the measurement direction. The tips of the arrows correspond to the patient’s head. Solid and dashed lines represent the axes of the body for measurements in the CC and MLO positions, respectively. Thick and thin lines (or blue and red lines in color) correspond to the right and left breasts, respectively.  Fig. 2Schematic illustration of breast-holding direction: (a) CC of left breast, (b) MLO of left breast, (c) CC of right breast, and (d) MLO of right breast.  Figure 3 is a schematic illustrating the measurement process. Pulsed laser beams irradiate the breast from both sides, and PA signals are detected on one side by an array transducer. When in the CC position, PA signals are detected on the caudal side. The transparent holding plate on the transducer side is composed of polymethylpentene (PMP) to reduce the attenuation of acoustic wave intensity in comparison with the other polymer solid materials.21 The acoustic attenuation and acoustic wave velocity of PMP are reported as at 4 MHz and , respectively, whereas the acoustic attenuation of the acrylic material is reported as at 5 MHz. The other plate is composed of polymethyl methacrylate (PMMA) with high light transmittance. The PMP and PMMA plate thicknesses are 4 and 23 mm, respectively. Instead of conventional ultrasonic gel, which falls under the force of gravity, a nanocomposite (NC) gel22 was adopted for acoustic coupling between the breast and the PMP plate, effectively filling the gap between the breast surface and the plate. The NC gel remains attached to the PMP plate and is easily deformed, adapting to the shape of the breast under even, mild compression. The NC gel is optically transparent and has acoustic attenuation of . Although the thickness of the NC gel varied from 3 to due to the breast pressure, the acoustic attenuation remained negligible. We used a Ti:Sa laser that is optically pumped using a Q-switched Nd:YAG laser with a tunable wavelength of 700 to 900 nm. Wavelengths of 756 and 797 nm were selected to construct a better image of the Hb saturation distribution.23 In the referred paper, we described the PAM visibility results using data from 41 lesions in 39 patients as a function of four predetermined wavelengths (756, 797, 825, and 1064 nm). As a result, we concluded that the best choice of wavelength for PAM visibility was 797 nm, and the second-best wavelength was 756 nm from the viewpoint of calculating the Hb saturation. There are three light illumination modes corresponding to the illumination direction: a backward laser, a forward laser, or both. The maximum permissible exposure values recommended by the American National Standards Institute for 756 and 797 nm are 26 and , respectively. Each laser energy used in PAM-02 was for a backward laser and for a forward laser, respectively, which were constant for both wavelengths. The light energy density values of the PAM-02 forward and backward lasers were set to a maximum of 15 and , respectively, which were constant for both wavelengths. The beam shape from forward illumination was an oblong with a minor axis of and major axis of . The backward laser illuminated two pathways across the PA detector. Each shape from backward illumination was oblong, with a minor axis of and major axis of . These two backward lasers illuminated the breast without overlapping. An internally manufactured broadband capacitive micromachined ultrasonic transducer (CMUT) was used as a receive-only transducer array to detect the PA signal.24 The array holds 600 elements, with 20 in the horizontal direction and 30 in the vertical direction. Each element measures , and the array pitch is 1 mm. The central frequency and fractional bandwidth of CMUT are 2 MHz and 130%, respectively. The averaged conversion efficiency was at 2 MHz and its standard deviation was over the 600 elements. The noise-equivalent pressure (NEP) of this system was 5.6 Pa. at root-mean-square value without a signal average. The NEP measurement was examined with a low-pass filter of cutoff frequency was 6.7 MHz. The impulse response was measured as follows: (1) setting the hydrophone (Toray Engineering Co., Ltd.) as a US transmission device, (2) transmitting the pulse wave US from hydrophone to the CMUT device, (3) receiving the US by the CMUT device and the frequency response calculated considering the premeasured hydrophone’s frequency response property, and (4) calculating the impulse response using the frequency response. The frequency response and impulse response of a typical element are shown in Figs. 4(a) and 4(b), respectively. Fig. 4An example of the CMUT characteristics used in PAM-02: (a) typical frequency response and (b) typical impulse response. 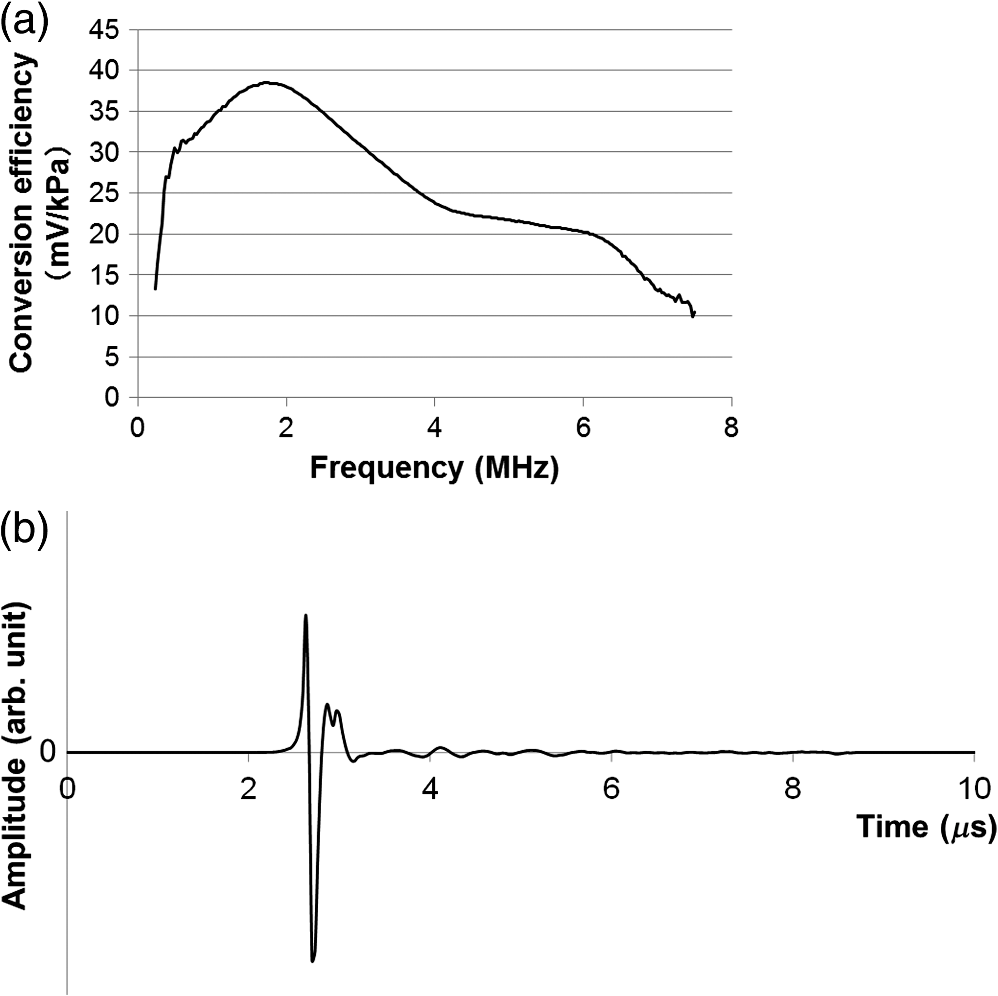 The major difference between PAM-02 and PAM-01 is the addition of US echo imaging. In PAM-02, a linear transducer array is used as a dedicated transducer for US echo imaging. This is because the CMUT device for the PA signal detector could not be applied to the US imaging frequency range of 6 MHz or more. The US transducer has 128 channels and the Doppler function was not mounted in this system. The specific parameters of PAM-02 and PAM-01 are shown in Table 1. Table 1Specific parameters of PAM-02 and PAM-01.
The transducer module consists of four components fabricated in the following order: a US transducer, the first optical prism, a PA detector, and the second optical prism. The laser light passes through the optical prisms mounted on both sides of the PA detector. This transducer module is scanned in the plane to measure a wide area of the breast. The main scan is a continuous reciprocating movement in the horizontal direction, synchronized with laser pulse irradiation. The typical scan speed used in our study was in the horizontal direction. The position detected by one element is the same as that of the neighboring element at the next laser pulse irradiation because both the interval between laser pulses and the time required to move the component to the next element are 100 ms. Therefore, as the PA detector is equipped with 20 elements in the horizontal direction, an average of 20 data points can be acquired in the same position by one-way scanning. The wavelengths of the laser irradiation in the first and second halves of a main reciprocating scan are 756 and 797 nm, respectively. The transducer module moves 10 mm in the vertical direction after each main reciprocating scan, which corresponds to 10 elements along the vertical axis. The main reciprocating scans overlap three times because the PA detector is equipped with 30 vertical elements; thus, an average of 60 data points can be obtained. This scan pattern contributes to lower levels of system noise because of the averaging of multiple data points and decreases the streak artifacts because the image is reconstructed using data from the entire scanned area. The subjects’ measurement area can be selected on the operation window of the personal computer that controls the PAM machine. The available area is 100 or 150 mm along the horizontal axis, and 30, 40, 50, 60, or 90 mm along the vertical axis, as shown in Fig. 5. The machine operator can select the position and size of the scan area according to breast size. More time is required for wider measurement areas. For example, the measurement time is for an area of and for an area of , each acquiring an average of 60 data points. In the clinical study, an appropriate scan area was set by a medical doctor based on the patient’s anatomy and general condition, as well as the extent of the tumor. 2.2.Imaging MethodPA image reconstruction was performed using a modified universal backprojection algorithm that corrects for the acoustic refraction of the PMP plate in front of the PA detector.25 Assuming that the breast consisted of homogeneous tissue via the background light absorption coefficient () and reduced light scattering coefficient (), the distribution of the absorbers was calculated from the initial pressure distribution, Gruneisen parameter, and light fluence distribution.26 The light fluence distribution () can be calculated as where is the position to be calculated, is the excitation source, and is the diffusion coefficient where the subscript represents the light wavelength. In the case of PAM-02, and represent wavelengths of 756 and 797 nm, respectively.As is well known, the quantitative PA imaging is a big issue to be solved. Especially, it is difficult to quantitatively estimate the absolute value of the absorption coefficient () due to the limited-view problem.27,28 and the wavelength dependence of the light fluence. If the two values of the absorbers for and wavelengths can be correctly obtained, the Hb saturation value () can be derived from the following equation: where is the molar extinction coefficient of deoxy-Hb and is the difference in the molar extinction coefficients between deoxy-Hb and oxy-Hb (). In practice, however, the absolute value of is still unreliable since the light fluence affects the absolute value.29 Against this background, we adopted the method detailed below to extract semiquantitative information in vivo.In the clinical study, and were estimated for each patient using the time-resolved spectroscopy of a commercially available product (TRS-20, Hamamatsu Photonics K.K.) at wavelengths of 760 and 800 nm30 to estimate the wavelength dependence of light fluence distribution at wavelengths of 756 and 797 nm. The estimated area was positioned sufficiently far from the lesion of the tumor-bearing breast or the contralateral normal breast to avoid the effect of tumor-related blood vessels and to more precisely obtain the average optical properties of normal breast tissue.31 We adopted and values of 760 and 800 nm, respectively, in the TRS-20 to calculate the light fluence distribution at 756 and 797 nm. The light fluence distribution is appropriately calculated on the assumption the breast consists of homogeneous tissue and that the errors caused by the slight difference of wavelengths between measurements by TRS-20 and PAM-02, i.e., only several nanometers, are negligibly small. However, there is a possibility that the derived value may cause doctors to misdiagnose due to the unreliability of the absolute value. Therefore, the derived Hb saturation value is called “-factor,” , in the following equation: where is the apparent light absorption coefficient at wavelength of the absorber measured by PAM-02 and is the relative parameter of the measured absorption coefficient of divided by that of . The reliability of is considered to be affected by the accuracy of the estimation of light fluence for each wavelength, which may be related to the depth and/or complexity of the tissues.The -factor image was constructed as follows: the -factor value was calculated at every point according to Eq. (4), and a heat map was developed with a continuous color hue variation from 0% (blue) to 100% (red). The heat map was weighted with an apparent absorption coefficient image of 797 nm, , obtained by PAM-02, which is a corresponding wavelength to the absorption coefficient values of oxy- and deoxy-Hb,32 such that the image of is approximately proportional to the total Hb concentration, if the limited-view effect is ignored and the light fluence distribution is correctly estimated. In other words, color hue is determined according to the -factor value and image intensity is determined according to the value of 797 nm. Therefore, we adopted the weighted -factor image to evaluate the Hb saturation and its concentration simultaneously. The weighted -factor can be described in the following equation: where is the weighted -factor and is the absorption coefficient of 797 nm measured by PAM-02.A three-dimensional US image was constructed by combining consecutive B-mode images acquired using a scanning transducer. A synthetic aperture was used to improve the resolution in the mechanical scan direction. To further improve the US resolution, we used the Capon method,33 which has been reported to enhance the spatial resolution in the US beam direction.34 We modified this method and applied it to improve the spatial resolution in the mechanical scan direction. The resolution of the B-mode image was 1 mm or less, as is the case with other US machines using transducers with a central frequency of 6 MHz. In this paper, we mainly evaluated PA image quality using a phantom and clinical research. The PA and US fusion image was obtained simply by overlaying the volume data, which were made considering the predetermined transducer offsets. 2.3.PhantomWe used a urethane mammographic phantom in which the optical and acoustic properties were adjusted to those of breast tissue, as shown in Table 2. Titanium dioxide particles (SJR-405S, Tayca Co., Ltd., Japan) and black pigments (Hitohada black, EXSEAL Co., Ltd., Japan) were used to adjust the optical scattering and absorption properties of the bulk urethane material (Hitohada gel, EXSEAL Co., Ltd., Japan) to mimic average breast properties. The height, width, and depth of the phantom were 224, 270, and 50 mm, respectively. Table 2Phantom specifications.
Figure 6 is a schematic illustration of the phantom. This phantom was equipped with 10 absorbers; the upper five and lower five measure contrast and resolution, respectively. Each absorber was set at a depth of 5, 15, 25, 35, or 45 mm in a staircase pattern to decrease the generation of harmful artifacts from other absorbers during image reconstruction. Fig. 6Schematic illustration of the evaluation phantom. The phantom was equipped with ten absorbers, five upper absorbers and five lower absorbers for contrast and resolution measurements, respectively. Each absorber was set at a depth of 45, 35, 25, 15, or 5 mm. 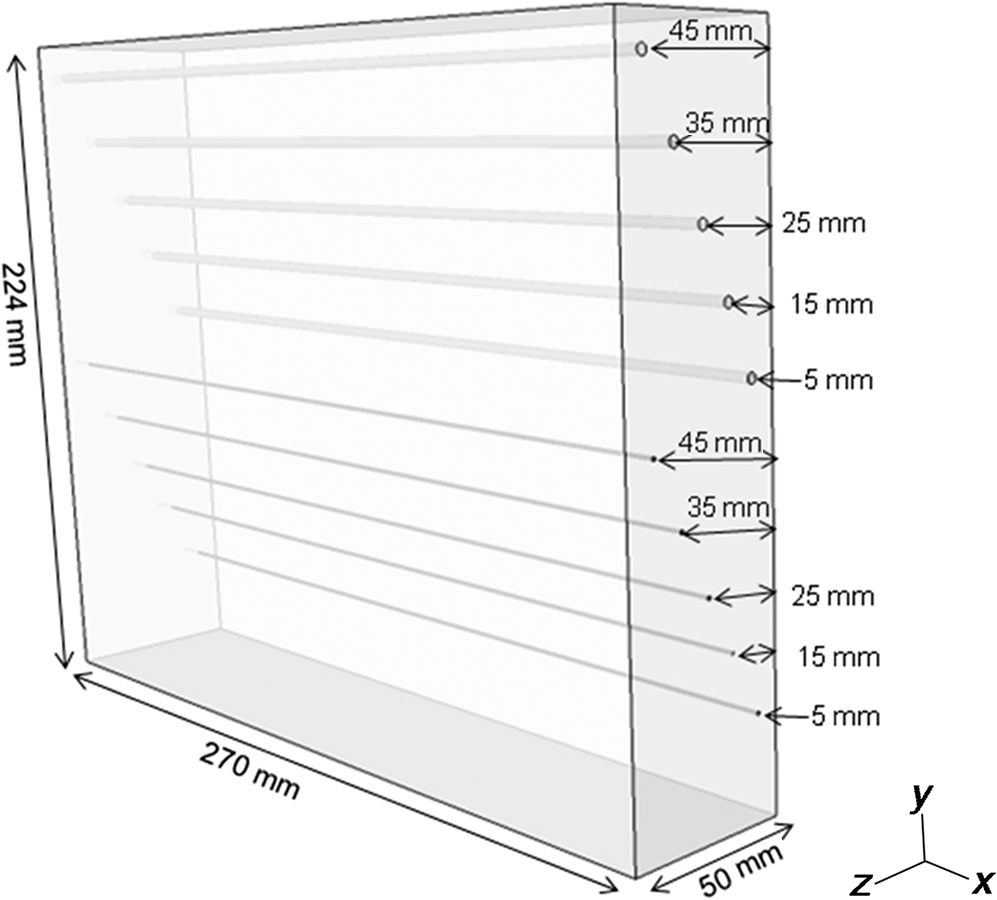 The contrast absorbers were all in the same cylinder (1 mm and comprised a urethane material with black pigments. The corresponding value was derived from the microvascular density of the tumor.35 The resolution absorbers were all in the same cylinder (0.3 mm ) and comprised of black rubber. The value was beyond the limit of our measurement but was estimated to be greater than . The US and PA images were simultaneously obtained using the rubber absorbers because this rubber reflects US waves. 3.Results3.1.Phantom ExperimentWe measured the phantom to evaluate the resolution and contrast using the wavelength of 797 nm. We did not use the NC gel because this phantom has a rectangular shape. The pulse laser illuminated the phantom from both sides. Figure 7 shows a maximum intensity projection (MIP) image of the distribution after calibrating the light fluence inside the phantom using the light diffusion equation. We simultaneously obtained evaluation data from a wide area because of the scan mechanism. Five of the six signals in Figs. 7(a) and 7(b), marked by a single asterisk, were images for contrast evaluation (obtained from the upper five absorbers), and five of the six signals in Figs. 7(c) and 7(d), marked by two asterisks, were used for resolution evaluation (obtained from the lower five absorbers), as shown in Fig. 6. The two arrows in the bottom of Fig. 7(a) are the same absorber as those in the top of Fig. 7(c). We set different window levels between Figs. 7(a)–7(b) and 7(c)–7(d) to appropriately evaluate each absorber depending on the different light absorption coefficients. Fig. 7MIP image of the evaluation phantom: (a) and (b) images for contrast evaluation obtained from the upper five absorbers marked by a single asterisk. (c) and (d) images for resolution evaluation obtained from the lower five absorbers marked by two asterisks, as shown in Fig. 6. Each arrow shows the set position of each absorber. (a) and (c) are front views while (b) and (d) are side views of the phantom.  Figure 8 shows the full width at half maximum (FWHM) as a function of the depth position of the absorbers using the lower half of the phantom. We compared these data with those measured by PAM-01. The spatial resolution performance improved from for PAM-01 to 1 mm for PAM-02 at all depths due to the decreased size of each element to approximately half. Fig. 8FWHM as a function of the depth position using 0.3-mm cylindrical absorbers. Filled circles represent data from PAM-02, whereas open circles represent data from PAM-01.  We measured the contrast-to-noise ratio (CNR) using the absorbers for contrast evaluation in the upper half of the phantom. To calculate the CNR, the PA signal intensity of the absorbers was measured within the region of interest (ROI) on the absorber in an area of . The PA signal intensity of the background was measured within the ROI at a distance of 25 mm from the absorber, where the PA signal intensity was unaffected by artifacts from the absorbers. The CNR was derived by dividing the intensity of the absorber by that of the background. Figure 9 shows the resulting CNR as a function of the depth of the absorbers. We compared the CNRs given by PAM-01 and PAM-02 and can confirm that the CNR of PAM-02 is superior to that of PAM-01. Fig. 9CNR of the contrast phantom. Filled circles represent data from PAM-02 and open circles represent those from PAM-01.  We confirmed that both the US image and the PA image could be reconstructed at the same location by the simultaneous scan. PAM-02 can easily generate overlaid images from PA and US images. We measured the same data as mentioned above using the wavelength of 756 nm and calculated the -factor value of the absorbers for contrast evaluation. As a result, the evaluated -factor was 76% on average, which almost corresponded to the assumed -factor value calculated by the absorption coefficient spectrum of black pigment (data not shown). In addition, we used another pigment for the absorber, which had a higher absorption coefficient at 797nm than that of 756 nm corresponding to 93% at Hb saturation. As a result, 88% of -factor was obtained. Although the reason for 5% inconsistency remained to be solved, these results suggested that the -factor value reflects the degree of Hb saturation at least qualitatively. 3.2.Clinical ResearchWe performed measurements on two patients diagnosed with invasive breast cancer; one was measured by PAM-01 and the other by PAM-02. We initially compared the resolution of PAM-02 with that of PAM-01. The patient measured by PAM-01 was a 77-year-old woman with right-breast cancer (patient 1) and a 44-year-old woman with left-breast cancer (patient 2) was measured by PAM-02. The pathological diagnosis for patient 1 was invasive ductal carcinoma (IDC) of no special type, of which the estrogen receptor was positive (ER+), human epidermal growth factor receptor 2 was negative (HER2 −), tumor-node-metastasis classification was T2N0M0, and the stage was 2A. The tumor size was 24 mm. Patient 2 was diagnosed as IDC of no special type, ER+, HER2 1+, T2N0M0, and stage 2A. The tumor size was 30 mm. For the PAM measurements, the patient lesions were positioned and measured in the CC position. The breast compression conditions were 19 N for PAM-01 and 15 N for PAM-02. The pulse laser illuminated the breast from both sides. Figures 10(a)–10(d) show the PA images of the subcutaneous blood vessel from PAM-01 and PAM-02 using a wavelength of 797 nm. Figures 10(c) and 10(d) are the enlarged views of the images given by PAM-01 [Fig. 10(a)] and PAM-02 [Fig. 10(b)], respectively. These images were obtained from the caudal side. The images from PAM-02 exhibit a wider measureable area and improved image visibility of the subcutaneous blood vessel. Although different patients were examined between PAM-01 and PAM-02, both measured objects are subcutaneous vessels and located at almost the same depth. Therefore, increased spatial resolution in the image obtained by PAM-02 was seen. Fig. 10Images of subcutaneous blood vessels of (a) PAM-01 and (b) PAM-02. (c) and (d) Enlarged views of the yellow dotted boxes in (a) and (b), respectively.  Figure 11 shows the lesion images of patient 2 of (a) MMG, (b) US image obtained by diagnostic US machine, and (c) contrast-enhanced MRI image. Figure 12 shows (a) US image of the lesion of patient 2 obtained by PAM-02 (slice image at a depth of 15 mm) and (b) PAM image (MIP image at a depth of 15 to 19 mm). The image from PAM-02 also exhibits improved image visibility in the deep tissue compared to that from patient 1 (figure not shown). Many blood vessel-like signals were observed around the tumor in the US low-echo image. Furthermore, it can be recognized that the signals run centripetally toward the center of the tumor, and that the signal intensities become disrupted or weakened at the border of the tumor. Thus, we were able to analyze the angioarchitecture of tumor-related blood vessels. Fig. 11Lesion images of (a) MMG, (b) US image obtained by diagnostic US machine, and (c) contrast-enhanced MRI image.  Fig. 12Lesion images of (a) US image obtained by PAM-02 and (b) PA image simultaneously obtained by PAM-02. 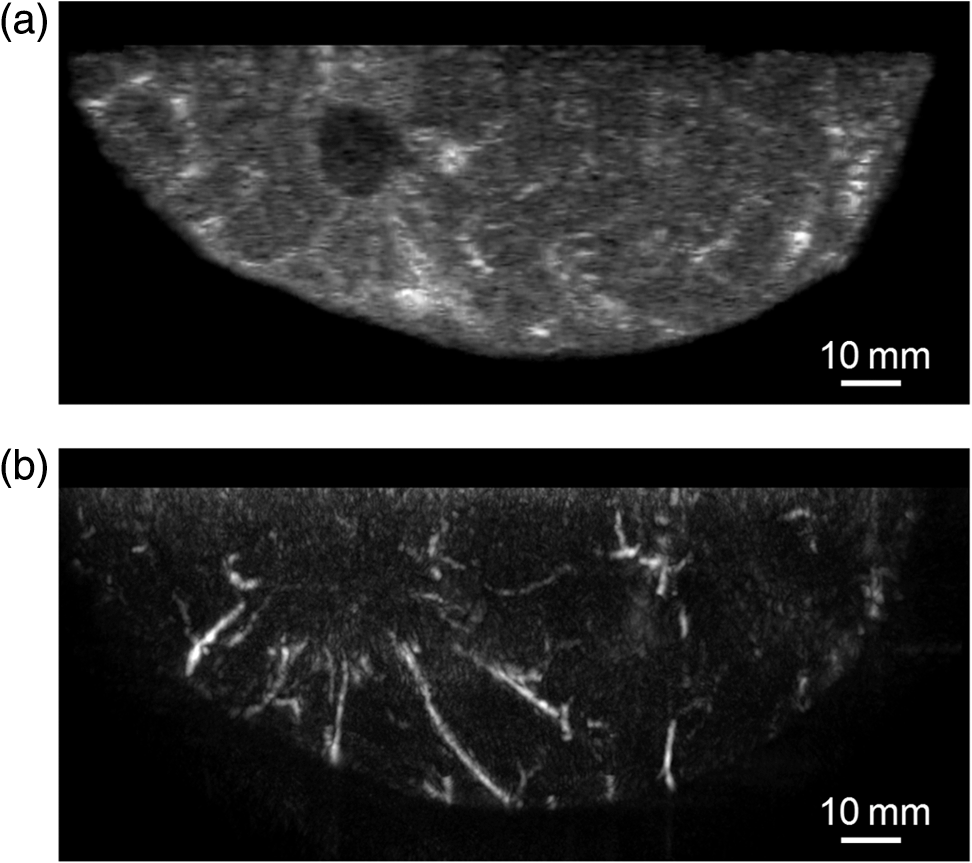 Next, PAM-02 and the wavelengths of 756 and 797 nm were used to analyze the -factor image. Figure 13(a) shows the -factor distribution image calculated using Eq. (3) of patient 2. This is represented as the comparable intensity, regardless of the existence or nonexistence of the PA signal sources. Red indicates close to 100% of -factor, whereas blue indicates close to 0%. It is difficult to analyze the -factor of the tumor-related blood vessel because the noise area and the actual signal area have the same intensity. Therefore, we adopted the -factor image weighted by the measured value at 797 nm, as mentioned in the description of the imaging method. Figure 13(b) shows the weighted -factor distribution image. We could analyze the tumor-related blood vessels using this imaging method. Fig. 13(a) -factor image and (b) -factor image weighted by the measured absorption coefficient of 797 nm. 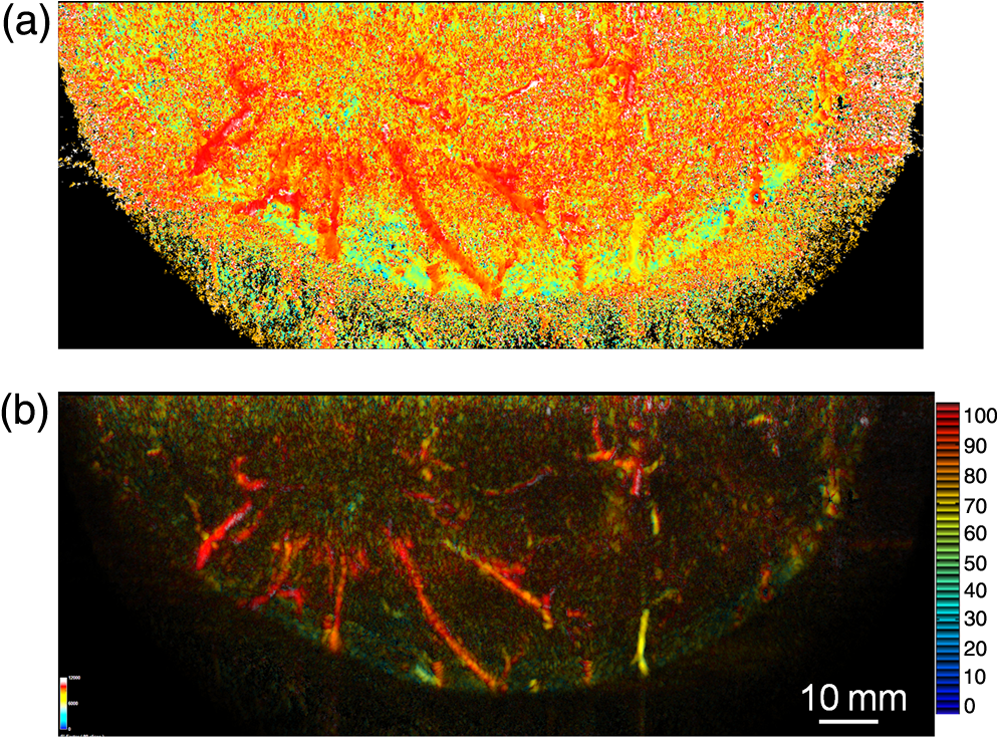 Figure 14(a) shows the -factor value weighted by the measured value at 797 nm to relatively evaluate Hb saturation in the region where Hb exists. The -factor values of each blood vessel were imaged. Figure 14(b) is the C-mode US image measured by PAM-02. Figure 14(c) shows the weighted -factor image overlaid on the US C-mode image. The breast border can be clearly recognized from the US C-mode image. Figure 14(d) shows a schematic illustration of the tumor location. Fig. 14(a) -factor distribution image, (b) US C-mode image, and (c) -factor distribution image overlaid on the US C-mode image. The color image represents the -factor distribution image, and the monochrome image represents the US C-mode image. (d) Schematic illustration of the tumor location. (e) Color scale for -factor value. The color changes from blue to red as -factor increases from 0% to 100%.  Figures 15(a)–15(d) show views of the PA images at increased depth overlaid on the US C-mode of patient 2. Each depth of the US B-mode is indicated in Fig. 15(e) by four arrows. Figure 15(a) is the MIP image at a depth of 14 to 16 mm. The tumor, which can be seen as a dark circle, is indicated by a yellow arrow. Some blood vessels approach the tumor. Figure 15(b) shows the MIP image at a depth of 23 to 25 mm. A number of blood vessels around the tumor can be recognized. These data show that our system can evaluate a tumor-related blood vessel to a depth of at least 25 mm. Figure 15(c) shows the MIP image at a depth of 35 to 37 mm. We cannot observe a significant signal in the breast because the CNR is not sufficiently high; therefore, the -factor value is unreliable at this depth. Certain signals reappeared at greater depths. These signals were generated by the laser illuminated from the forward or cranial side. Figure 15(d) shows the MIP image at a depth of 50 to 52 mm. Although some strong signals can be detected, most signals appear wider than those from closer to the detector. Fig. 15-factor distribution image including the tumor. MIP image at a depth of (a) 13 to 15 mm, (b) 23 to 25 mm, (c) 35 to 37 mm, and (d) 49 to 51 mm. (e) B-mode US image. The captions in (a)–(d) correspond to the cross-section position of the C-mode figures.  Figure 16 shows an enlarged section of the PA image around the tumor, which is the MIP image at a depth of 14 to 16 mm. In this figure, instead of overlaying the PA image on the US C-mode image, the outline of the tumor obtained by the US C-mode is highlighted with a white dashed circle. The window level was adjusted to qualitatively evaluate the PA signal intensity. Small spotty signals, indicated by yellow arrows, were observed inside the tumor. These signal intensities appeared significant in comparison to the normal area in the same breast, indicated by the yellow dotted circle. The -factor value of the blood vessels outside the tumor was nearly 90%, whereas the spotty signals inside the tumor had -factor values of . Fig. 16Enlarged section from Fig. 15(a) of the PAM image around the tumor. The white dashed circle surrounds the tumor and the yellow arrows indicate the spotty signals inside the tumor. These signal intensities were significantly higher than in other areas, such as inside the yellow dotted circle.  4.DiscussionWe developed PAM-02 as a second-generation prototype, which was the first dedicated breast PAM system capable of simultaneously acquiring PA and US images, and conducted a phantom study and clinical studies by two patients, one for PAM-01 and the other for PAM-02, to test its effectiveness. PAM-02 has greater resolution than PAM-01, as shown in Figs. 8 and 10, because of a reduction in the PA detector size, a widening of the fractional bandwidth, and an expansion of the aperture. A smaller element size leads to greater spatial resolution.28 The element size in the PAM-02 detector was smaller on each side compared with that in the PAM-01 detector, i.e., the element area in PAM-02 is smaller. In general, a reduction in element size causes a reduction in sensitivity. We prevented this reduction in sensitivity by adopting a high-sensitivity CMUT. The wideband property of the CMUT may also have helped improve the CNR. Furthermore, the system noise was lowered by optimizing the design of the electrical wiring. As a result, we obtained a higher contrast with PAM-02 than with PAM-01. In this study, the breast-holding pressure was within the range 10 to 30 N, which is less than conventional MMG based on the PAM-01 clinical study. This range corresponds to the blood pressure of the breast vein calculated from the central venous pressure to avoid preventing blood flow inside the breast. There were no adverse events related to pain due to breast holding in this study. In addition, the limited breast-holding pressure contributed to a reduction in thickness of the breast-holding PMP plate from 10 to 4 mm, as shown in Table 1. This reduces the attenuation of the PA signal intensity caused by the holding plate to some extent. However, we could not obtain a high-contrast image around the central depth of the breast at from the holding plate, as shown in Fig. 15(c). This result corresponded with the phantom data, as shown in Fig. 9, which showed the minimum value around the mid-depth of the phantom. Further improvement in the sensitivity of the PA detector or a higher laser-illumination power may be required to realize whole-breast imaging with a high-contrast ratio. Signals could be detected at deeper positions because the objects were closer to the forward-side laser, as shown in Fig. 15(d). However, the resolution was degraded, presumably due to the reduction in aperture size during the image reconstruction. Both the CNR and the resolution in the actual clinical result were inferior to those from the phantom experiments. One possible source of degradation is the distribution of sound speed because the human breast is more complicated and heterogeneous than the phantom used in this evaluation; hence, the development of a suitable phantom for quantitative evaluation will be required. We adopted two different transducers for US and PA imaging, and the images were appropriately fused using postimage processing. This configuration enabled us to implement optimal designs for both the US and PA detectors. Generally, US image resolution of the electric scan direction of the linear array is superior to that of its vertical direction since the resolution of the vertical direction is determined by the acoustic lens. In that case, US C-mode image shows anisotropy between these two directions. On the other hand, we were able to obtain a nearly equivalent resolution between the electric scan direction of the linear array and the mechanical scan direction using a synthetic aperture to improve the resolution of the mechanical scan direction. Although Doppler function is not mounted, the comparison of PAM and Doppler images may be interesting because Doppler imaging can image the thick blood vessels with adequate blood flow. However, PAM imaging requires only the absorber and no blood flow; therefore, PAM may be able to visualize narrower blood vessels. The previous clinical evaluation of PAM-01 demonstrated its applicability to cancer diagnosis but also highlighted some limitations. The images obtained by MRI and PAM were not always comparable because of the different breast shapes in each method. With PAM-02, we are able to analyze the blood vessel properties inside or in the vicinity of the tumor. In many cases, we were able to confirm lesions using the US C-mode image, if the target lesion was mass forming (data not shown). However, there are still difficulties in detecting lesions with poorly circumscribed margins or those existing in deeper portions of the breast. We are now developing image reconstruction methods that enable the tumor location to be projected from volume data acquired by other modalities, such as breast MRI. In addition, the US image quality should be improved to achieve higher diagnostic capability. The superposition of the PA image onto the US C-mode image enabled us to identify signals from tumor-related blood vessels. The signal intensity and signal density differed between the interior and exterior of the tumor. Although the Hb concentration is estimated to be higher in malignant tumors as a result of increased microvessel density, the PA signal inside the tumor tended to be lower than outside the tumor despite the absence of tumor necrosis. Further research from a biological (and technical) viewpoint is required to explain this phenomenon. Weighted -factor distribution images could be generated, and values could be calculated in all cases. However, the -factor values should be carefully treated as Hb saturation values because the validity of the -factor itself needs to be verified in vivo and its reliability is lower, where the noise level is higher, such as in the area around 35-mm depth as shown in Fig. 16(c). Although we cannot regard the -factor values as the absolute value of Hb saturation even in the low-noise areas, the weighted -factor image in low-noise areas may provide some important information about the relative oxygen saturation level of tumor-related blood vessels. We are now investigating the significance of the -factor distribution patterns for estimating the tumor properties through ongoing clinical trials. We showed the PA image of tumor-related blood vessels of human breast cancer with a high-resolution image overlaid by a precise lesion area obtained by the built-in US system. Frequent measurements may be acceptable for the patient, e.g., during cancer medication due to the noninvasive diagnostic procedure, and a dedicated breast PAM system provides the reproducibility of breast setting unlike in the case of a handheld PAT system. It is expected that this result will trigger the development of the functional diagnostic method. 5.SummaryWe have developed a second-generation PAM prototype (PAM-02) capable of simultaneously acquiring PA and US images. PAM-02 can noninvasively derive images of morphology and function as well as precisely fuse PA and US images. We confirmed the improvement in PA image quality compared with our previous PAM prototype (PAM-01) using a mammographic phantom and a clinical case study. The lesion could be identified because the US image was obtained simultaneously, which is the most significant improvement over PAM-01. We showed the feasibility of analyzing tumor-related blood vessels using morphological US and functional -factor images obtained by PA at two wavelengths. We will continue the clinical research using PAM-02 to further explore the clinical diagnostic significance provided by our images. DisclosuresYasufumi Asao, Yohei Hashizume, Takahiro Suita, Ken-ichi Nagae, Kazuhiko Fukutani, Yoshiaki Sudo, Toshikazu Matsushita, and Shuichi Kobayashi are employees of Canon Inc., Japan. Canon Inc. designed and invented a PAM device, which was used in this study. Canon has patents related to PAM-02 (Patent name: PA apparatus, and probe for receiving PA waves; biological information acquisition apparatus and biological information acquisition method; PA measurement apparatus; measurement apparatus, movement control method, and program). No conflicts of interest, financial or otherwise, are declared by the other authors. AcknowledgmentsThis work was partially supported by the Innovative Techno-Hub for Integrated Medical Bioimaging Project of the Special Coordination Funds for Promoting Science and Technology, from the Ministry of Education, Culture, Sports, Science, and Technology, Japan. ReferencesJ. Ferlay et al.,
“Cancer incidence and mortality worldwide: sources, methods and major patterns in GLOBOCAN 2012,”
Int. J. Cancer, 136 E359
–E386
(2015). http://dx.doi.org/10.1002/ijc.29210 IJCNAW 1097-0215 Google Scholar
B. W. Pogue et al.,
“Implicit and explicit prior information in near-infrared spectral imaging: accuracy, quantification and diagnostic value,”
Phil. Trans. R. Soc. A, 369 4531
–4557
(2011). http://dx.doi.org/10.1098/rsta.2011.0228 PTRMAD 1364-503X Google Scholar
G. Quarto et al.,
“Estimate of tissue composition in malignant and benign breast lesions by time-domain optical mammography,”
Biomed. Opt. Express, 5 3684
–3688
(2014). http://dx.doi.org/10.1364/BOE.5.003684 BOEICL 2156-7085 Google Scholar
P. Viacava et al.,
“Angiogenesis and VEGF expression in pre-invasive lesions of the human breast,”
J. Pathol., 204 140
–146
(2004). http://dx.doi.org/10.1002/(ISSN)1096-9896 Google Scholar
A. Makris et al.,
“Reduction in angiogenesis after neoadjuvant chemoendocrine therapy in patients with operable breast carcinoma,”
Cancer, 85 1996
–2000
(1999). http://dx.doi.org/10.1002/(ISSN)1097-0142 CANCAR 0008-543X Google Scholar
M. Milani and A. L. Harris,
“Targeting tumour hypoxia in breast cancer,”
Eur. J. Cancer, 44 2766
–2773
(2008). http://dx.doi.org/10.1016/j.ejca.2008.09.025 EJCAEL 0959-8049 Google Scholar
R. Jiang et al.,
“Phase-contrast diffuse optical tomography for in vivo breast imaging: a two-step method,”
Appl. Opt., 48 4749
–4755
(2009). http://dx.doi.org/10.1364/AO.48.004749 APOPAI 0003-6935 Google Scholar
A. Leproux et al.,
“Assessing tumor contrast in radiographically dense breast tissue using diffuse optical spectroscopic imaging (DOSI),”
Breast Cancer Res, 15 R89
(2013). http://dx.doi.org/10.1186/bcr3485 BCTRD6 Google Scholar
N. Nakamiya et al.,
“Clinicopathological and prognostic impact of imaging of breast cancer angiogenesis and hypoxia using diffuse optical spectroscopy,”
Cancer Sci., 105 833
–839
(2014). http://dx.doi.org/10.1111/cas.2014.105.issue-7 Google Scholar
R. A. Kruger et al.,
“Dedicated 3D photoacoustic breast imaging,”
Med. Phys., 40 113301
(2013). http://dx.doi.org/10.1118/1.4824317 Google Scholar
S. A. Ermilov et al.,
“Laser optoacoustic imaging system for detection of breast cancer,”
J. Biomed. Opt., 14 024007
(2009). http://dx.doi.org/10.1117/1.3086616 JBOPFO 1083-3668 Google Scholar
X. Li et al.,
“High resolution functional photoacoustic tomography of breast cancer,”
Med. Phys., 42 5321
–5328
(2015). http://dx.doi.org/10.1118/1.4928598 MPHYA6 0094-2405 Google Scholar
S. Manohar et al.,
“Initial results of in vivo non-invasive cancer imaging in the human breast using near-infrared photoacoustics,”
Opt. Express, 15 12277
–12285
(2007). http://dx.doi.org/10.1364/OE.15.012277 OPEXFF 1094-4087 Google Scholar
M. Heijblom et al.,
“Photoacoustic image patterns of breast carcinoma and comparisons with magnetic resonance imaging and vascular stained histopathology,”
Sci. Rep., 5 11778
(2015). http://dx.doi.org/10.1038/srep11778 SRCEC3 2045-2322 Google Scholar
M. Heijblom, W. Steenbergen and S. Manohar,
“Clinical photoacoustic breast imaging: the Twente experience,”
IEEE Pulse, 6 42
–46
(2015). http://dx.doi.org/10.1109/MPUL.2015.2409102 Google Scholar
T. Kitai et al.,
“Photoacoustic mammography: initial clinical results,”
Breast Cancer, 21
(2), 146
(2012). http://dx.doi.org/10.1007/s12282-012-0363-0 Google Scholar
L. Xi et al.,
“Design and evaluation of a hybrid photoacoustic tomography and diffuse optical tomography system for breast cancer detection,”
Med. Phys., 39 2584
–2594
(2012). http://dx.doi.org/10.1118/1.3703598 MPHYA6 0094-2405 Google Scholar
P. Otto et al.,
“Improved differentiation of breast tumors using laser opto-acoustic ultrasonic imaging system,”
in Proc. ECR 2012,
(2012). http://dx.doi.org/10.1594/ecr2012/C-2403 Google Scholar
A. Garcia-Uribe et al.,
“Dual-modality photoacoustic and ultrasound imaging system for noninvasive sentinel lymph node detection in patients with breast cancer,”
Sci. Rep., 5 15748
(2015). http://dx.doi.org/10.1038/srep15748 SRCEC3 2045-2322 Google Scholar
H. Ke et al.,
“Performance characterization of an integrated ultrasound, photoacoustic, and thermoacoustic imaging system,”
J. Biomed. Opt., 17 056010
(2012). http://dx.doi.org/10.1117/1.JBO.17.5.056010 Google Scholar
A. R. Selfridge,
“Approximate material properties in isotropic materials,”
IEEE Trans. Sonics Ultrason., 32
(3), 381
–394
(1985). http://dx.doi.org/10.1109/T-SU.1985.31608 Google Scholar
K. Haraguchi and T. Takehisa,
“Nanocomposite hydrogels: a unique organic-inorganic network structure with extraordinary mechanical, optical, and swelling/de-swelling properties,”
Adv. Mater., 14 1120
–1124
(2002). http://dx.doi.org/10.1002/1521-4095(20020816)14:16<1120::AID-ADMA1120>3.0.CO;2-9 ADVMEW 0935-9648 Google Scholar
I. Yamaga et al.,
“Development of photoacoustic mammography for detection of breast cancer,”
JSLSM, 34 24
–29
(2013). http://dx.doi.org/10.2530/jslsm.34.24 Google Scholar
O. Wygant et al.,
“Integration of 2D CMUT arrays with front-end electronics for volumetric ultrasound imaging,”
IEEE Trans. Ultrason. Ferroelect. Freq. Control, 55 327
–342
(2008). http://dx.doi.org/10.1109/TUFFC.2008.652 ITUCER 0885-3010 Google Scholar
K. Fukutani et al.,
“Characterization of photoacoustic tomography system with dual illumination,”
Proc. SPIE, 7899 78992J
(2011). http://dx.doi.org/10.1117/12.873690 Google Scholar
L. Yin et al.,
“Tomographic imaging of absolute optical absorption coefficient in turbid media using combined photoacoustic and diffusing light measurements,”
Opt. Lett., 32 2556
–2558
(2007). http://dx.doi.org/10.1364/OL.32.002556 OPLEDP 0146-9592 Google Scholar
M. Xu and L. V. Wang,
“Analytic explanation of spatial resolution related to bandwidth and detector aperture size in thermoacoustic or photoacoustic reconstruction,”
Phys. Rev. E, 67 056605
(2003). http://dx.doi.org/10.1103/PhysRevE.67.056605 Google Scholar
Y. Xu et al.,
“Reconstructions in limited-view thermoacoustic tomography,”
Med. Phys., 31 724
(2004). http://dx.doi.org/10.1118/1.1644531 MPHYA6 0094-2405 Google Scholar
B. Cox et al.,
“Quantitative spectroscopic photoacoustic imaging: a review,”
J. Biomed. Opt., 17 061202
(2012). http://dx.doi.org/10.1117/1.JBO.17.6.061202 Google Scholar
M. Oda et al.,
“Near-infrared time-resolved spectroscopy system for tissue oxygenation monitor,”
Proc. SPIE, 4160 204
(2000). http://dx.doi.org/10.1117/12.407622 PSISDG 0277-786X Google Scholar
N. Nakamiya et al.,
“Clinicopathological and prognostic impact of imaging of breast cancer angiogenesis and hypoxia using diffuse optical spectroscopy,”
Cancer Sci., 105 833
–839
(2014). http://dx.doi.org/10.1111/cas.2014.105.issue-7 Google Scholar
P. Beard,
“Biomedical photoacoustic imaging,”
Interface Focus, 1 602
–631
(2011). http://dx.doi.org/10.1098/rsfs.2011.0028 Google Scholar
K. Takao, M. Fujita and T. Nishi,
“An adaptive antenna array under directional constraint,”
IEEE Trans. Antennas Propag., 24 662
–669
(1976). http://dx.doi.org/10.1109/TAP.1976.1141411 IETPAK 0018-926X Google Scholar
H. Taki et al.,
“High range resolution ultrasonographic vascular imaging using frequency domain interferometry with the Capon method,”
IEEE Trans. Med. Imaging, 31 417
–429
(2012). http://dx.doi.org/10.1109/TMI.2011.2170847 ITMID4 0278-0062 Google Scholar
W. A. Wells et al.,
“Analysis of the microvasculature and tissue type ratios in normal vs. benign and malignant breast tissue,”
Anal. Quant. Cytol. Histol., 26 166
–174
(2004). AQCHED 0884-6812 Google Scholar
BiographyYasufumi Asao received his BS, MS, and PhD degrees in engineering from Tohoku University in 1991, 1993, and 2005, respectively. He is a manager at Canon Inc., and an associate professor at Kyoto University, Japan. He is the author of more than 10 journal papers. His current research interests include photoacoustic imaging and its clinical applications. |
|||||||||||||||||||||||||||||||||||||||||||||||||||||||||||||||||||||||||||||||||||||||||||||||||||||||||||||||||||||


