
|
|
|
Rapid quantitative imaging of tissue optical properties, namely absorption () and reduced scattering (), has long been a challenge in the field of biomedical optics. The recent introduction of spatial frequency domain imaging (SFDI) provides a transformative approach capable of measuring optical properties over a large field-of-view.1 In principle, SFDI relies on the analysis of the tissue response to structured illumination (patterns of light) in the spatial frequency domain in a multipixel manner over an entire field-of-view at once.2,3 More specifically, the spatial-frequency-dependent response, called the modulation transfer function, is calibrated using a phantom with known optical properties to determine the tissue diffuse reflectance (), which is then used to extract the optical properties using a light propagation model. While the method is rapid, SFDI has until recently involved the measurement of several images to form maps of optical properties, typically a total of six images (two spatial frequencies at three phases), although a method employing only a single spatial frequency and three phases has also been described. Recent developments in acquisition methods reduced the number of images necessary to extract optical properties from 6 to 2,4 and even from 6 to a single image with the method called single snapshot of optical properties (SSOP).5 In their most advanced implementations, such methods enable profile-corrected measurements of optical properties in a single snapshot, in turn facilitating true real-time acquisition of optical properties.6 Unfortunately, while acquisition methods can be performed in real time, the processing is still commonly achieved postacquisition. The most rapid processing method employs a lookup table (LUT) approach, by which solutions for diffuse reflectance are generated from a light propagation model (diffusion, Monte Carlo) or empirically with various spatial frequencies and optical properties.3,7,8 Such a method allows one to directly link a calibrated diffuse reflectance measurement at known spatial frequencies to a unique solution of optical properties ( and ). However, because it necessitates interpolations within the LUT for each pixel in the image, this method is still time-consuming (seconds), preventing the use of SFDI for true real-time imaging of optical properties. In this letter, we present forms of LUTs allowing rapid extraction of optical properties from the measurement of calibrated diffuse reflectance. We propose two solutions that do not necessitate interpolations and thus dramatically reduce computation time. The first method consists of a hyper-dense linearized LUT, and the second invokes an analytical representation of the LUT. These methods are described, implemented, and compared to the standard LUT method in terms of precision, accuracy, and computation time. Combined with real-time acquisition, this letter facilitates real-time quantitative optical imaging of tissue properties. The two methods described in this letter are based on a previously developed LUT.3 This standard LUT method uses “white” Monte-Carlo simulation (WMC, with zero absorbance) to model the spatially resolved impulse response, i.e., the steady-state diffuse reflectance , of a collimated point-source illumination for a given set of , , , and , which is then Fourier transformed to determine the spatial frequency response of the diffuse reflectance.9,10 To generate the standard LUT, WMC was used to simulate photons into a homogenous medium with index of refraction and anisotropy factor . The model used a detector with a numerical aperture of 0.22 and the radial bins were sampled in increments of , allowing a maximum spatial frequency of over . This process is repeated over several optical properties, and stored in a table that associates the diffuse reflectance at two spatial frequencies with a unique pair of optical properties. Recovering optical properties, therefore, involves measuring the diffuse reflectance of the sample and searching the table to find the corresponding optical property values (hence the name “lookup table”). With this method, it is important to understand that the optical properties are linearly sampled, so we refer to this method as the linear OP LUT. Using this method, the measured values are used to search through the nonlinear mapping of against the tissue properties in the linear OP LUT table, and then and are acquired using cubic spline interpolation. For our linear OP LUT, the resolution of the sampled optical properties was 0.001 and with a range of and for and , respectively, with a table size of 81,571 points (see linear OP LUT in Fig. 1). Fig. 1LUT protocols: white arrows indicate the formation of each LUT, from Monte-Carlo simulation, to linear sampling, and finally function fitting. Black arrows indicate three options for data flow and usage of each LUT. First, a sample’s (DC and AC) is measured and used as input. (a) The linear OP LUT must search and interpolate to generate optical properties, (b) the linear LUT uses parametric indexing to recall optical properties, and (c) the 2-D fit LUT evaluates the function to generate optical properties. 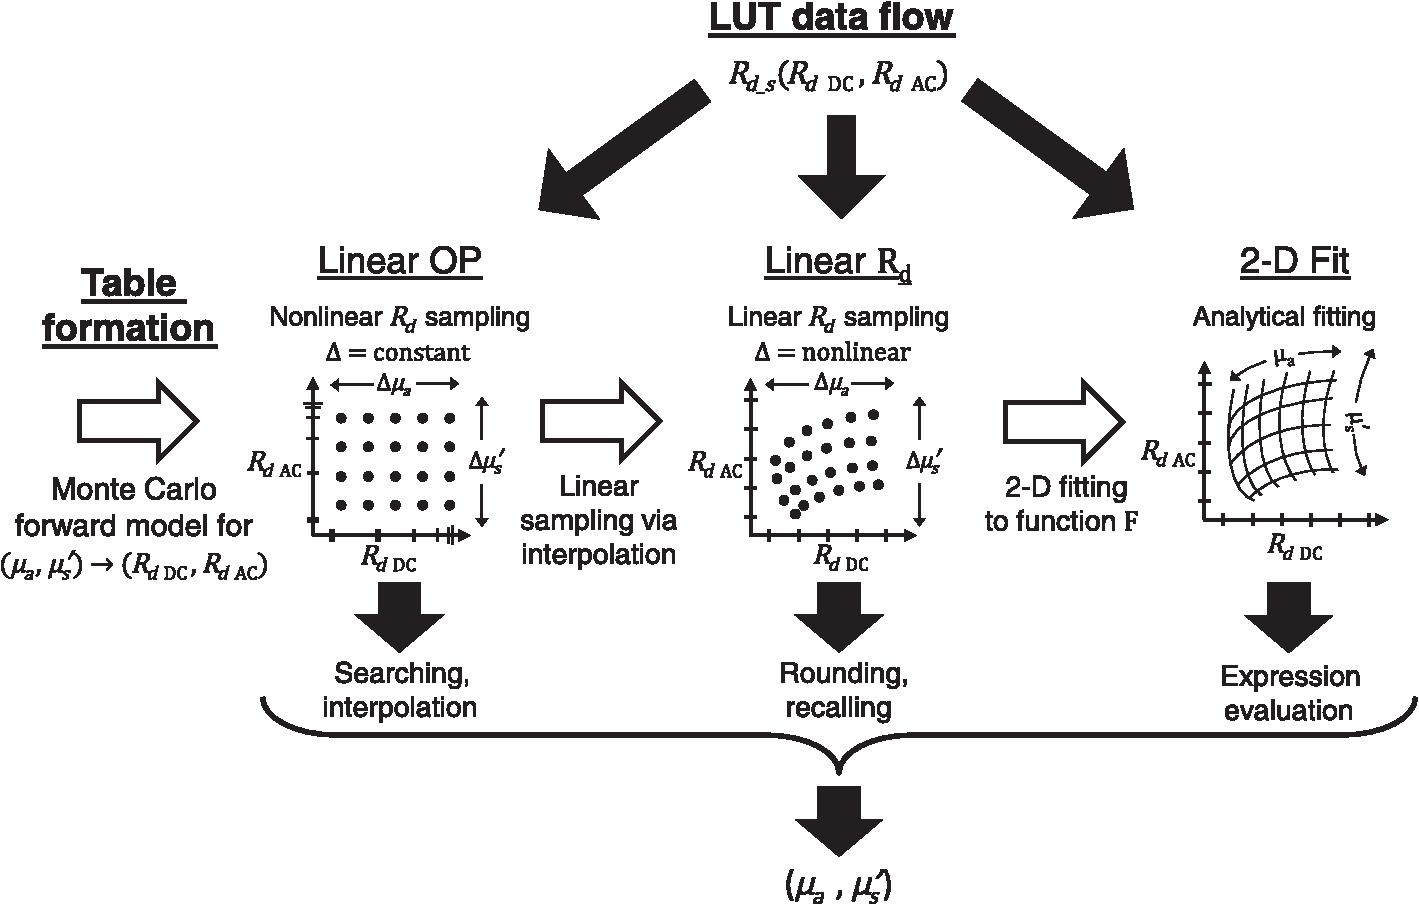 To avoid the time-consuming searching and interpolation steps required for the standard linear OP LUT, an LUT linear with respect to (linear LUT) was made by interpolating linearly sampled values from 0 to 1 by 500 points within a high-resolution linear OP LUT (0.0001 and resolution with a range of and for and , respectively, with a table size of 8,105,701 points). The resolution of the linear sampling is chosen so that measured values can be found directly in the table by rounding their value to the nearest increment of 0.02, without interpolation (see linear LUT in Fig. 1). Given a sample’s values, the LUT’sorresponding indices can be calculated by parameterizing the linear grid and rounding to the nearest vertex to acquire and . Using the linear LUT, each optical property table was fit to a two-dimensional (2-D) function using a nonlinear least squares solver (“fit” using MATLAB) where through are optimized parameters. Using these functions, optical properties can be directly deduced from the diffuse reflectance at low spatial frequency (noted DC here) and the diffuse reflectance at high spatial frequency (noted AC here). This is referred to as the 2-D fit LUT (see 2-D fit LUT in Fig. 1).Figure 1 summarizes the LUT formations and workflows. The white arrows describe the formation process from Monte-Carlo simulation to the linear OP LUT (arrow 1), to the linear LUT (arrow 2), and finally to the 2-D fit LUT (arrow 3). The black arrows indicate the three options for workflow when using the LUTs to extract optical properties. Diffuse reflectance measurements at two spatial frequencies (low: DC, and high: AC) are used as inputs to the LUTs to extract the optical properties. The custom imaging system and associated processing have been described extensively and results have been published, including a clinical trial.11,12 Briefly, the system utilizes a digital micromirror device (DMD) to project patterns of 670-nm laser illumination which is cross polarized with the collection optics to minimize specular reflections in images collected on a CCD camera. An array of tissue-like silicone phantoms was made using India ink (Blick Art Materials, Boston, Massachusetts) and titanium dioxide (Atlantic Equipment Engineers, Bergenfield, New Jersey) for absorption and scattering, respectively. The array was made to span the optical properties and . The array was imaged using SFDI and the inversion from to optical properties was then evaluated on all three LUT methods and compared to a Monte Carlo (MC) least-squares solver over square ROIs of .9 Finally, a Yorkshire pig was used as an in vivo model to evaluate each LUT method during realistic surgical conditions (Beth Israel Deaconess Medical Center Institutional Animal Care and Use Committee approved institutional protocol #034-2013). Abdominal skin flaps were elevated on a pair of perforator vessels, the venous pedicle was occluded, and released to restore tissue perfusion. All computational processing and analyses were done on a 64-bit Dell Optiplex 9020 (Dell, Round Rock Texas) with an Intel Core i7-4770 CPU (Intel, Santa Clara, California). inversions were repeated 100 times for each LUT type and averaged for comparison. Figure 2 shows the results for the phantom sample array. Agreement is seen among all three LUTs for both absorption and reduced scattering maps [Fig. 2(a)]. ROIs were chosen to quantify the results for each phantom well [Fig. 2(a)] and to compare the LUT methods [Fig. 2(b)]. All methods show low relative error compared to the MC results : linear OP LUT (1.3, 0.5), linear LUT (0.2, 0.09), 2-D fit LUT (1.9, 2.8). Table 1 summarizes the processing times for each method on this sample, from a single pixel to the entire image. The linear and 2-D fit LUTs exhibit better performances over the entire range. Importantly, processing shows a 100-fold improvement for an entire image (), for both absorption and reduced scattering. Fig. 2Phantom array measurement. (a) Tissue-simulating phantom array was measured using SFDI and absorption (top row) and reduced scattering (bottom row) maps were generated using the linear OP, linear , and 2-D fit LUTs. (b) Regions of interest (dotted squares) were chosen to compare each method’s accuracy. Image resolution is . Scale bar represents 1 cm.  Table 1Processing speeds for LUT inversion of Rd to both μa and μs′ property maps.
The in vivo results are shown in Fig. 3. All LUT methods show strong agreement for both absorption and reduced scattering maps [Fig. 3(a)]. A line profile was taken across the sample [dotted lines in Fig. 3(a)] to quantitatively compare the LUT results [Fig. 3(b)]. All LUTs show agreement with the MC results : linear OP LUT (4.1, 2.1), linear LUT (0.9, 0.6), 2-D fit LUT (1.5, 3.2). Fig. 3In vivo measurement. (a) A pig skin flap vascular occlusion model was measured using SFDI and optical property maps were generated using each LUT. (b) Line profiles (dotted lines) compare each method’s accuracy. Scale bar represents 1 cm. 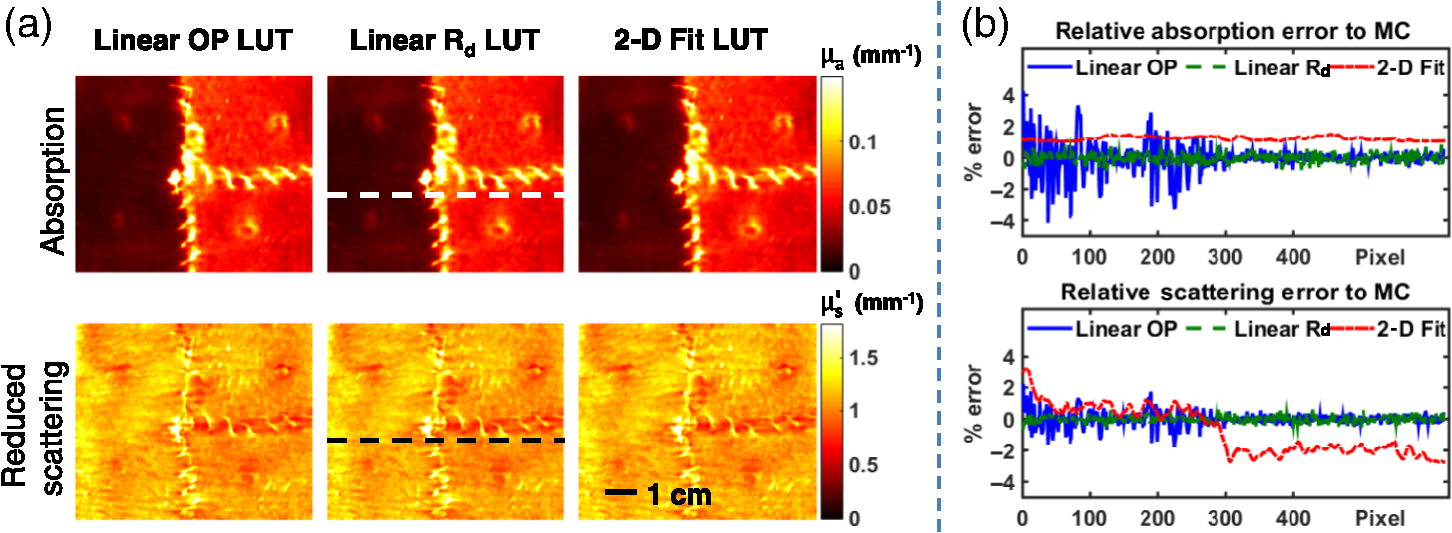 Both newly developed LUT methods, the linear LUT and 2-D fit LUT, decrease the processing time by a factor of by avoiding searching and interpolating with two different approaches. The linear LUT parameterizes a linear grid using the table’s sampling resolution and range and rounds to the nearest vertex that matches the sample’s input. The 2-D fit method avoids this discrete sampling by fitting a continuous function to each surface of and as a function of diffuse reflectance at two spatial frequencies. Each LUT method has its own unique relationship among inversion speed, memory space, and accuracy. The standard linear OP LUT must use interpolation for practically sized tables, which increases the required processing time. Because this table samples in a nonlinear manner, increasing the sampling grid greatly increases the searching time for each input. In comparison, the linear LUT is sampled with a parameterized grid, thus its speed is minimally affected by increased grid size because no searching occurs. However, because the table is linearly sampled, the density required to maximize accuracy at high gradients in the table is used for the entire table, resulting in a large grid that requires considerable computer memory. This could potentially be mitigated by choosing a sampling function whose density increases for higher gradients of the table. The 2-D fit LUT requires less computer memory space but has variable accuracy across the table due to under-fitting, though this accuracy could potentially be weighted toward optical property values that are more likely to occur, e.g., separate LUTs for brain, liver, or skin tissues. While the presented 2-D fit LUT was fit to the entire linear LUT, accuracy was weighted to prioritize optical properties reasonably expected for skin tissues (, ). Within this range of optical properties, errors in comparing the 2-D fit LUT with ground truth does not exceed in absorption and in scattering. The new frameworks introduced can be applied to other LUT processes with possibly more dimensions. For profile corrected SFDI11 or three-dimensional-SSOP,6 there is the potential to include height/phase dependence among the table’s input parameters for optical property mapping. In addition, it is important to note that to make multispectral measurements, each wavelength is processed separately with the same LUT. Because wavelengths can be independently processed in parallel, processing time is minimally affected. Given a known set of wavelengths, one could also go directly from input values to hemodynamic values such as oxygen saturation. Generating these calculations after calibrating the imaging system but before the sample acquisition makes real-time feedback for surgical guidance possible. In this letter, we introduced a new framework for LUT formation and evaluated its performance on tissue-mimicking phantoms and in vivo in comparison with a standard OP LUT.3 Overall, the new techniques were accurate compared to MC simulations, i.e., within 0.9% and 0.6% for linear LUT and , respectively, and within 1.9% and 3.2% for 2-D fit LUT and , respectively, and are faster than the standard linear OP LUT. These techniques help enable real-time image-guidance feedback for spatial frequency domain techniques. The authors would like to thank Steve McClure for his helpful discussion and support. This work was supported by R01-DE-022820 (BL), K01-DK-093603, France Life Imaging, University of Strasbourg and ICube Laboratory (S.G.), and NIH/NIDDK Award Number F31-DK-105839 (J.A.). ReferencesN. Dognitz and G. Wagnieres,
“Determination of tissue optical properties by steady-state spatial frequency-domain reflectometry,”
Laser Med. Sci., 13 55
–65
(1998). http://dx.doi.org/10.1007/BF00592960 LMSCEZ 1435-604X Google Scholar
D. J. Cuccia et al.,
“Modulated imaging: quantitative analysis and tomography of turbid media in the spatial-frequency domain,”
Opt. Lett., 30
(11), 1354
–1356
(2005). http://dx.doi.org/10.1364/OL.30.001354 Google Scholar
D. J. Cuccia et al.,
“Quantitation and mapping of tissue optical properties using modulated imaging,”
J. Biomed. Opt., 14
(2), 024012
(2009). http://dx.doi.org/10.1117/1.3088140 Google Scholar
K. P. Nadeau et al.,
“Advanced demodulation technique for the extraction of tissue optical properties and structural orientation contrast in the spatial frequency domain,”
J. Biomed. Opt., 19 056013
(2014). http://dx.doi.org/10.1117/1.JBO.19.5.056013 Google Scholar
J. Vervandier and S. Gioux,
“Single snapshot imaging of optical properties,”
Biomed. Opt. Express, 4
(12), 2938
(2013). http://dx.doi.org/10.1364/BOE.4.002938 BOEICL 2156-7085 Google Scholar
M. van de Giessen et al.,
“Real-time, profile-corrected single snapshot imaging of optical properties,”
Biomed. Opt. Express, 6
(10), 4051
–62
(2015). http://dx.doi.org/10.1364/BOE.6.004051 Google Scholar
G. M. Palmer and N. Ramanujam,
“Monte Carlo-based inverse model for calculating tissue optical properties. Part I: theory and validation on synthetic phantoms,”
Appl. Opt., 45
(5), 1062
–1071
(2006). http://dx.doi.org/10.1364/AO.45.001062 Google Scholar
N. Rajaram et al.,
“Lookup table–based inverse model for determining optical properties of turbid media,”
J. Biomed. Opt., 13
(5), 050501
(2008). http://dx.doi.org/10.1117/1.2981797 Google Scholar
A. Kienle and M. S. Patterson,
“Determination of the optical properties of turbid media from a single Monte Carlo simulation,”
Phys. Med. Biol., 41
(10), 2221
–2227
(1996). http://dx.doi.org/10.1088/0031-9155/41/10/026 Google Scholar
J. Swartling et al.,
“Accelerated Monte Carlo models to simulate fluorescence spectra from layered tissues,”
J. Opt. Soc. Am. A, 20
(4), 714
–27
(2003). http://dx.doi.org/10.1364/JOSAA.20.000714 Google Scholar
S. Gioux et al.,
“Three-dimensional surface profile intensity correction for spatially modulated imaging,”
J. Biomed. Opt., 14
(3), 034045
(2009). http://dx.doi.org/10.1117/1.3156840 Google Scholar
S. Gioux et al.,
“First-in-human pilot study of a spatial frequency domain oxygenation imaging system,”
J. Biomed. Opt., 16
(8), 086015
(2011). http://dx.doi.org/10.1117/1.3614566 Google Scholar
|


