
|
|
1.IntroductionPhotoacoustic microscopy (PAM) is a hybrid in vivo three-dimensional (3-D) imaging modality that can offer high-resolution images with optical absorption contrast.1 PAM has so far been applied to numerous applications such as vascular biology, oncology, neurology, ophthalmology, dermatology, gastroenterology, and cardiology.2–6 In PAM, short laser pulse energy is absorbed by an intrinsic absorber, such as hemoglobin or melanin in tissue, leading to local temperature rise, and due to thermoelastic expansion generates pressure waves in the form of ultrasound. The photoacoustic (PA) waves are detected with an ultrasonic transducer (UST). PAM has several advantages over pure optical methods:1 (a) PAM makes use of the weak acoustic scattering to do high-resolution imaging beyond the optical diffusion limit () in biological tissues, (b) it is highly scalable 3-D in vivo imaging modality, both imaging depth and resolution are scalable, (c) it provides optical absorption contrast, unlike confocal fluorescence microscopy and optical coherence tomography (OCT), which provides fluorescence and scattering contrast, (d) it directly images optical absorption with 100% relative sensitivity, and the sensitivity is two orders of magnitude greater than those of confocal microscopy and OCT,2 and (e) it can simultaneously image functional, structural, molecular, flow dynamic, and metabolic contrasts in vivo.2,7 In PAM, both the laser excitation and acoustic detection are focused (tightly or loosely depending on the configuration), and the dual foci are configured confocally to enhance measurement sensitivity. Depending on whether the acoustic focus or optical focus is finer, PAM is categorized into acoustic-resolution PAM (ARPAM)8 and optical-resolution PAM (ORPAM).9–12 In ARPAM, the acoustic focus is finer, and it could provide an axial resolution of , and a lateral resolution of at 3-mm depth with 0.44 NA, 50 MHz UST.8 In ORPAM, the optical focus is finer. So, the size of optical spot limits the imaging resolution in ORPAM. The diffraction-limited size of optical focus is , where denotes the optical wavelength and NA is the numerical aperture of the optical objective.2 One way to reduce the spot size is to use high-NA objective. ORPAM systems with resolution using 0.1 NA and ,13 using 0.1 NA and , using 0.1 NA and ,14 using 0.47 NA and ,15 and using 1.23 NA and 12 were demonstrated. Because of the high sensitivity and resolution, ORPAM has become an important tool for studying biological systems at the cellular and subcellular levels. In vivo label-free PAM of cell nuclei by excitation of DNA and RNA was demonstrated using UV light excitation.16 In all these techniques, the resolution is still limited by the optical diffraction. It is necessary to achieve imaging resolution beyond the diffraction limit to image subcellular structures, mitochondria, hemoglobin nanoclusters, and nanoparticles. In recent years, few attempts have been made to break the diffraction limit in ORPAM. A nonlinear super-resolution PAM was demonstrated for visualizing 10-nm gold nanoparticles in graphene and hemoglobin nanoclusters in live erythrocytes.17 A label-free photoacoustic nanoscopy (PAN) using optical saturation and polynomial fitting was demonstrated for imaging mitochondria in NIH 3T3 fibroblasts.18 Using a double-excitation process, subdiffraction-limited lateral resolution was demonstrated in photoimprint PAM.9 These approaches are either complicated or expensive or both. Dielectric microspheres were widely used to break the diffraction limit in optical microscopy.19–22 It is simpler, cost-effective, and can provide far-field super-resolution. This microsphere approach can be implemented in conventional microscopy without modifying the system and it has gained enormous attention in the field of optical nanoscopy.21,23 Optical imaging at 50-nm resolution was achieved in white light microscopy using fused silica () microspheres with diameter in the range 4 to in air medium.21 The super-resolution is due to a photonic nanojet (PNJ) generated by the microsphere. When the microsphere is illuminated by a light beam, a narrow (subwavelength waist), intense, nonevanescent, and low-diverging jet like optical beam is generated on the shadow side of the microsphere. Such a nanojet can break the diffraction limit in optical microscopy by greatly reducing the size of the excitation volume, and the signal generated in the excitation volume can still be collected in the far-field. Super-resolution imaging using a PNJ was successfully demonstrated in white light microscopy,21 fluorescence microscopy,24 Raman microscopy,25 and coherent anti-stokes Raman scattering microscopy.26 A simulation study was reported on achieving super-resolution in ORPAM using PNJs.27 This study was focused on: (i) generation of PNJ by a round microsphere (RM) under tight optical focusing (using high-NA values 0.5, 0.7, and 1.0) condition in water, and (ii) one of the important PNJ parameters, its waist size, was studied by changing the incident wavelength , numerical aperture (NA) of the objective, refractive index of the microsphere , and diameter of the sphere . It was observed that RM could generate a narrow jet, but its major drawback is its short length which limits its penetration depth. To control PNJ properties, several designs such as truncated microsphere (TM),28 microsphere with concentric rings (MCR),29 and multilayer microsphere (MLM)30,31 have been reported till date. In this work, we investigated all the important parameters of PNJs including “effective length” related to the penetration depth, “waist size” related to the lateral resolution, “working distance” related to the distance between the shadow-side surface of the sphere to the sample, and “peak intensity” related to the enhancement of the signal. We compared PNJ parameters for various sphere designs such as RM, TM, MCR, MLM, and a new design named truncated multilayer microsphere (TMLM). Here, an 800 nm Gaussian beam was loosely focused (low NA) on the sphere to generate PNJ. The low NA (0.1) used in this work is also in line with the widely used NA in ORPAM studies.13,14 The TMLM design generated a PNJ with remarkable length (i.e., , it is the longest nanojet achieved so far) and focal length (i.e., , it is the longest focal length achieved with microsphere so far). We also observed that using RM with and it is possible to achieve -fold enhancement in the lateral resolution in conventional ORPAM with 0.1 NA, . 2.MethodsCOMSOL multiphysics is a finite element method (FEM)-based simulation software package for various physics and engineering applications. COMSOL software version 4.3b was used for generating the fluence maps for Gaussian focus and PNJs. These fluence maps were then exported to MATLAB for PA image simulation using the k-wave toolbox. k-wave32 is an open source acoustics tool box in MATLAB. It was designed for ultrasound and PA simulations in tissue media. For both COMSOL and k-wave-based simulations, a desktop with 64-bit windows 10 operating system, 3.7 GHz processor, and 16 GB RAM was used. 2.1.COMSOL-Based Simulation for Generating Focused Gaussian BeamWe designed a two-dimensional (2-D) FEM simulation geometry based on electromagnetic theory in COMSOL. The simulation model used is illustrated in Fig. 1(a). Area of simulation () includes optical focusing, water medium, and microsphere. Perfect matching layer (PML) was used as a boundary condition. A focused beam was simulated by a Gaussian beam propagating along the -axis with a full width at half maximum (FWHM) beam waist diameter of or an radius of in intensity,26 where is the incident wavelength and NA is the numerical aperture of the objective. The beam waist was always centered laterally in the simulation area , but the -position varies for different simulations. In our simulations, we have generated a focusing Gaussian beam with and , so its theoretical FWHM waist diameter would be 4000 nm. Fig. 1(a) Simulation geometry for PNJ generation using FEM in COMSOL: FGB—focused Gaussian beam, —refractive index of water, —refractive index of microsphere, —diameter of microsphere, WD—working distance, —FWHM, and —effective length of PNJ. (b) Simulation geometry for PA microscopic imaging using k-wave in MATLAB. UST—ultrasound transducer (point detector).  2.2.Simulation of Photonic Nanojets in COMSOLThe FEM model shown in Fig. 1(a) was used for generating PNJs. The dielectric solid microsphere with diameter and refractive index was immersed in water medium having refractive index . In most of the previously reported PNJ simulations, the incident light was a plane wave. But in ORPAM, excitation beam is a focused Gaussian beam. Hence, in our simulations, we have used 800 nm Gaussian beam focused using an objective with as discussed in Sec. 2.1. A sphere with was placed inside the Gaussian focus having an FWHM diameter of 3958 nm. Spheres with different designs and different materials were tested. The materials used for the spheres were all existing materials. We have carried out simulations for the following spheres: (i) RM: It was a perfectly round, solid sphere with a diameter, . The material used for the sphere is (fused silica), (polystyrene), or (–BaO–ZnO glass). This design was widely used for generating PNJs.21,27 (ii) TM: Through simulation studies, it was observed that PNJ parameters are significantly influenced just by truncating the RM.28 In our simulations, a diameter RM made out of silica was cut by different thicknesses, , , . So, the cutting thicknesses used here are . (iii) MCR: Both experimental and simulation studies showed that the MCR on its shadow-side surface could modulate the PNJ generated.29 In our simulations, we have used a silica sphere decorated with 2, 3, or 4 uniformly distributed rings. The depth and width of all the rings were 1.2 and , respectively. The inner radius of the first ring was and the distance between the adjacent rings was . (iv) MLM: It was shown that using a two-layer microsphere configuration it is possible to enhance the length of the nanojet significantly. A PNJ with FWHM length of ,31 and a PNJ with decay length of 30 were achieved using a two-layer microsphere. In our simulations, we have used an MLM sphere consisting of an inner core of radius and with a refractive index , and of a shell with outer radius and with an index . The schematic of microspheres is shown in Fig. 2. The total diameter of the two-layer sphere was . Three different two-layered spheres were designed with existing material: (a) silica sphere and BK7 layer , (b) BK7 sphere and layer , (c) lanthanum dense flint (LaSF) sphere , and barium flint (BaF) layer . (v) TMLM: The two-layer spheres discussed above were truncated to study the influence of its cutting thickness on the PNJ parameters. We found that truncating the MLM design significantly enhanced the effective length, and working distance compared to all other designs. The three different spheres used for MLM design were truncated by thickness, , , (i.e., ). Figure 2 summarizes the properties of PNJs generated from the five different designs discussed above. Figure 2 is discussed in detail in Sec. 3. Fig. 2Properties of PNJ generated by microspheres (with diameter, ) of different designs when illuminated with a focusing Gaussian beam (generated in water with 0.1 NA and ) in water medium . The FWHM waist diameter of Gaussian focus in water, . The highlighted ones are the best values observed in our simulations. —number of concentric rings. *The PNJs used for demonstrating PA imaging in k-wave simulations, where is the effective length, is the FWHM width, WD is the working distance of the microsphere, is the peak intensity, and is the quality criterion or figure-of-merit. 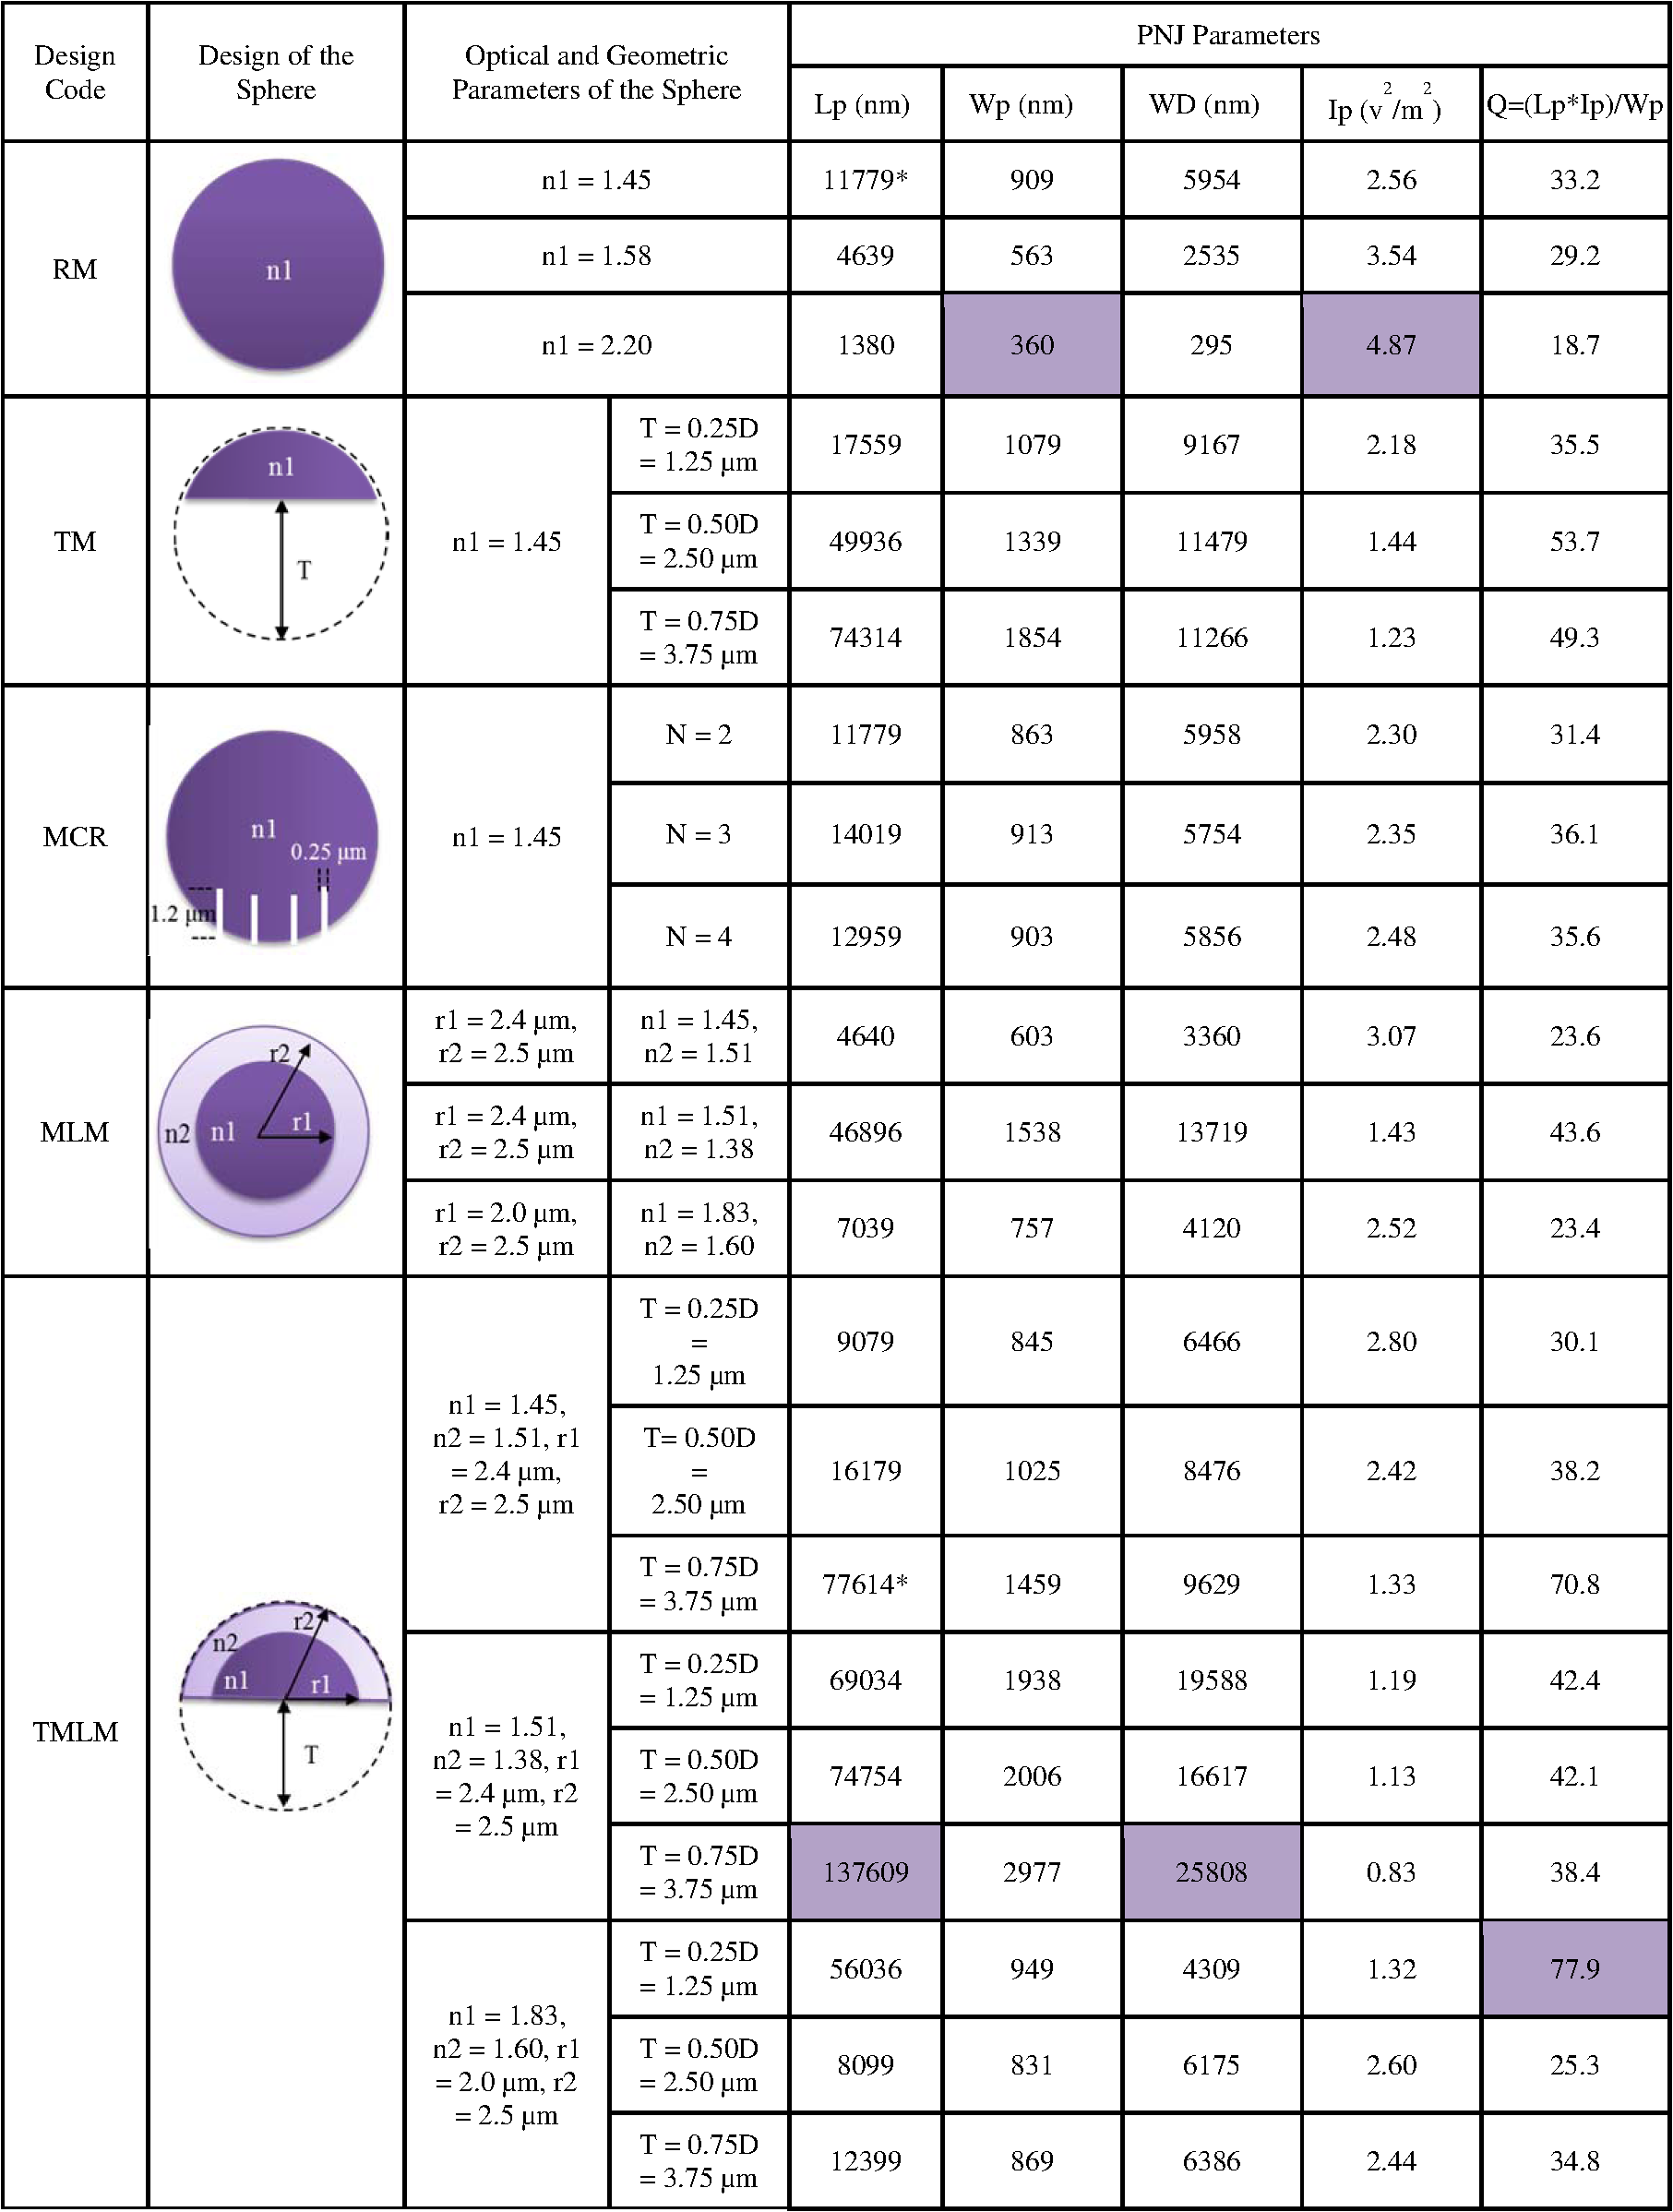 2.3.Simulation of Photoacoustic B-Scan Images Using k-Wave Toolbox in MATLABThe fluence maps of focusing Gaussian beam and PNJs were exported to MATLAB for simulating PA images using the k-wave toolbox. Figure 1(b) shows the 2-D simulation geometry used in k-wave simulations. A grid of (i.e., ) was created with . A PML was used as a boundary condition for the generation of the forward PA data. A numerical phantom as shown in Fig. 1(b) was used for the study. The phantom consists of square targets with a side length of , separated by a distance . Seven such targets were placed along -axis with gap between each pair of targets to create an object with a depth of . The targets were embedded inside a nonabsorbing medium. In our simulation, the light illumination was fixed at the center of the scanning area and the object was scanned across the light field. The scanned area was (i.e., ). The object was moved along the -direction with a step size of 50 nm resulting in a total of 101 A-lines. A point detector (UST) was used to collect the A-lines and it was placed at a distance of from the object. The center frequency and the fractional bandwidth of the detector were 375 or 1225 MHz and 80%, respectively. According to the simulations, 375 and 1225 MHz transducers can provide up to - and depths, respectively, at signal attenuation.33–35 To simplify the simulations, we used a point detector. To collect forward PA signal over a length of , a total of 1340 time steps with each step 50 ps was used. The PA signals were down sampled five times to mimic a data acquisition system with sampling rate. To every PA signal, 1% noise was added, resulting in 40 dB signal-to-noise ratio level. The A-line PA data were stacked after taking Hilbert transform to form a B-scan PAM image. The simulations assumed a sound speed of . For simplicity, the medium was considered acoustically homogeneous and there was no absorption or dispersion of sound. 3.Results and Discussion3.1.Properties of Photonic Nanojets from Various Sphere DesignsAs discussed in Sec. 2.1, a Gaussian focus was generated with and , and its FWHM waist diameter measured to be . As discussed in Sec. 2.2, the simulations were carried out to investigate PNJs for sphere designs RM, TM, MCR, MLM, and TMLM. The basic characteristics of PNJ are as follows: (i) effective length is the distance of the point where the nanojet intensity drops by a factor of with respect to the peak intensity in the axial profile (-axis), (ii) working distance (WD) is the distance from the sphere shadow-side surface to the point of peak intensity (), (iii) waist of the nanojet is the FWHM of the nanojet intensity profile (along -axis) at peak intensity , (iv) peak intensity is the maximum intensity of the PNJ, (v) figure-of-merit or quality criterion “” is a measure of the quality of the PNJ, it combines the basic characteristics of PNJ, and is defined as .36 For a given microsphere, the PNJ was optimized based on the value of the nanojet they produced. The sphere inside the focusing Gaussian beam was moved (along -axis) to generate a PNJ with highest value. The PNJ parameters, such as the effective length , FWHM waist size , working distance (WD), and peak intensity , and quality criterion of the PNJs generated when a sphere was placed inside a focusing Gaussian beam with 3958 nm waist size, are listed in Fig. 2. The summary of the table is as follows: (i) The PNJ properties are significantly affected by the design of the sphere under the same illumination conditions. (ii) FWHM widths of all the PNJs are smaller than the Gaussian focus (i.e., ). (iii) Increase in will reduce the PNJ width, length, and working distance. The PNJ is elongated at the expense of PNJ broadening and intensity lowering. (iv) RM design could generate a strong and narrow nanojet. With , PNJ having peak intensity and width was observed. The ultranarrrow nanojet having length is shown in Fig. 3(a). The sphere generates a 360 nm spot from a 3958 nm Gaussian spot, i.e., -flod enhancement in the resolution. But the drawback with the RM design is it could only generate a nanojet with short length and short working distance. (v) By cutting the silica , sphere by , i.e., , the PNJ was elongated from 11,779 to 74,314 nm (i.e., -fold enhancement in length). Figure 3(b) shows the PNJ with the length of 11,779 nm obtained by round silica sphere and its intensity plot along the line indicated as shown in Fig. 3(c). Figure 3(d) shows the PNJ with the length of 74,314 nm obtained by truncating the silica sphere by . (vi) In case of MCR design, the number of rings 2, 3, or 4 made on the round silica sphere does not influence the PNJ parameters much. However, the length and working distance are slightly better compared to the RM silica sphere . (vi) By properly selecting the sphere and layer materials, the MLM design is promising to generate an ultralong nanojet. Here, the layer thickness was optimized to generate PNJ with highest value. With , , , , a long nanojet was generated. (vii) The TMLM design with , , , , and cutting thickness generated PNJ with a remarkable extension of (, it is the longest nanojet compared to the previously reported nanojet lengths30,31) and long working distance (, it is the longest working distance compared to the previously reported values28,36). The ultralong nanojet is shown in Fig. 3(e). The fluence maps for Gaussian focus, nanojets from RM design with silica sphere , and TMLM design with , , and are shown in Figs. 4(a)–4(c), respectively. Figure 4(d) shows the normalized FWHM line profiles showing the widths and lengths. The fluence maps for Gaussian focus and PNJs as shown in Figs. 4(a)–4(c) were then used for illuminating the object [Fig. 1(b)] in k-wave simulations in MATLAB to generate PA B-scan image. Fig. 3Fluence maps generated when a Gaussian beam with waist 3958 nm focused through (a) an RM with and , (b) an RM with and , and (c) intensity profile along the line shown in (b). Here, —diameter of the sphere , WD—working distance , —effective length , (d) a TM with , , and , and (e) a TMLM with and . COMSOL simulations were carried out in area. For clarity, the area around the nanojet is shown here. The area of images in (a) and (b) is and the area of images in (c) and (d) is .  3.2.Super-Resolution Photoacoustic B-Scan ImagingThe numerical phantom described in Fig. 1(b) was sequentially scanned by the fluence maps shown in Figs. 4(a)–4(c). Figures 5(a)–5(c) show the 2-D B-scan PAM images of the target excited with the Gaussian focused beam with FWHM 3958 nm [Fig. 4(a)] and excited with PNJs with FWHM 909 nm [Fig. 4(b)] and 1459 nm [Fig. 4(c)], respectively. The images shown in Figs. 5(a)–5(c) were acquired using 375 MHz UST. From the ORPAM image shown in Fig. 5(a), it is clear that the Gaussian beam illumination could provide information of all the targets at depth but it could not resolve the gap between the targets. It is because the Gaussian spot size is larger than the separation between the targets 1500 nm. Figure 5(b) shows that the narrow PNJ (909 nm) generated by RM could resolve the gap (1500 nm) between the targets but it could not image the targets beyond depth. From Fig. 5(c), it is clear that the elongated PNJ generated using TMLM design could image all the targets and resolve the gap (1500 nm) between the targets. Here, the gap between the targets is clearly resolved, but the gap is not uniform along the depth. This is due to slight variation in the width along the length of the nanojet. Similar simulations were repeated using 1225 MHz transducer and the corresponding ORPAM images are shown in Figs. 5(d)–5(f). From these results, it is evident that the depth of super-resolution ORPAM can be enhanced with the help of ultralong PNJs. Fig. 5PAM B-scan images obtained by scanning the object [Fig. 1(b)] with Gaussian focus and PNJ: (a, d) images obtained with Gaussian focus shown in Fig. 4(a), (b, e) images obtained with short PNJ shown in Fig. 4(b), and (c, f) images obtained with ultralong PNJ shown in Fig. 4(c). Images were acquired using USTs (a–c) 375 MHz and (d–f) 1225 MHz.  These simulations promise that it is possible to control or tune the imaging depth, lateral resolution, and signal enhancement in the conventional ORPAM system just by changing the sphere design being used. Based on the requirement, the PNJ parameters can be optimized by choosing the appropriate sphere and refractive index. Microsphere has already proven its potential in white light microscopy21 by imaging 50-nm features, and in fluorescence microscopy24 by imaging subcellular structures such as centrioles, mitochondria, and chromosomes, and also in Raman microscopy by imaging subdiffraction features of a Blu-ray disc.26 The simulation results in our work promise that by using an appropriate microsphere, conventional ORPAM could be transformed into PAN at virtually no extra cost. The PAN can be used in many biomedical imaging applications that demand high resolution. For example, cellular structures, vasculature, and microcirculation systems, in vivo PAN, having high endogenous contrast, may help to monitor the molecular mechanism of blood vessel formation that can reveal the cause for angiogenesis. Currently, the diagnosis of melanoma is done based on invasive biopsy and inaccurate visual inspection. In vivo PAN being noninvasive, noncontact, and label-free will help us to diagnose melanoma in the early stage, a key to successful treatment. The approach may allow ORPA imaging of biological entities, such as bacteria , large virus (0.05 to ) particles, labeled as nucleic acids, molecules, etc. In spite of its promises, there are challenges in implementing the microsphere approach in practice. Although, other optical imaging modalities have successfully demonstrated the use of PNJ to improve the imaging resolution by breaking the diffraction limit. The experimental validation of PNJ for PA imaging is yet to be demonstrated. Our future work is to experimentally validate the usefulness of this simple technique in optical-resolution PA imaging. 4.ConclusionsIn this work, we investigated and optimized the main parameters of PNJ (length, width, working distance, and peak intensity) for various spheres under Gaussian illumination in water medium. The materials used for spheres are conventionally available in optical materials. The RM generates strong, short, and narrow nanojets, it can be used for super-resolution imaging of surface and nano/submicron features on the surface. With RM having , an ultranarrow nanojet having 360-nm width (-fold enhancement in lateral resolution) was observed. An elongated nanojet can be generated by simply truncating the microsphere by an appropriate thickness. The TMLM could generate PNJ with remarkable length and working distance . Also, the TMLM design could generate PNJ with highest figure-of-merit, , compared to the other designs. The method is simple, cost-effective, and allows far-field super-resolution in vivo imaging. AcknowledgmentsThe authors would like to acknowledge the financial support from the Tier 2 research grant funded by the Ministry of Education in Singapore (ARC2/15: M4020238). Authors have no relevant financial interests in the manuscript and no other potential conflicts of interest to disclose. ReferencesS.-L. Chen, L. J. Guo and X. Wang,
“All-optical photoacoustic microscopy,”
Photoacoustics, 3
(4), 143
–150
(2015). http://dx.doi.org/10.1016/j.pacs.2015.11.001 Google Scholar
L. V. Wang and S. Hu,
“Photoacoustic tomography: in vivo imaging from organelles to organs,”
Science, 335
(6075), 1458
–1462
(2012). http://dx.doi.org/10.1126/science.1216210 SCIEAS 0036-8075 Google Scholar
S. S. Oladipupo et al.,
“Conditional HIF-1 induction produces multistage neovascularization with stage-specific sensitivity to VEGFR inhibitors and myeloid cell independence,”
Blood, 117
(15), 4142
–4153
(2011). http://dx.doi.org/10.1182/blood-2010-09-307538 BLOOAW 0006-4971 Google Scholar
X. Cai et al.,
“Photoacoustic tomography of foreign bodies in soft biological tissue,”
J. Biomed. Opt., 16
(4), 046017
(2011). http://dx.doi.org/10.1117/1.3569613 JBOPFO 1083-3668 Google Scholar
D. Pan et al.,
“Molecular photoacoustic imaging of angiogenesis with integrin-targeted gold nanobeacons,”
FASEB J., 25
(3), 875
–882
(2011). http://dx.doi.org/10.1096/fj.10-171728 FAJOEC 0892-6638 Google Scholar
S. Hu et al.,
“Label-free photoacoustic ophthalmic angiography,”
Opt. Lett., 35
(1), 1
–3
(2010). http://dx.doi.org/10.1364/OL.35.000001 OPLEDP 0146-9592 Google Scholar
M. Schwarz et al.,
“Three-dimensional multispectral optoacoustic mesoscopy reveals melanin and blood oxygenation in human skin in vivo,”
J. Biophotonics, 9
(1–2), 55
–60
(2016). http://dx.doi.org/10.1002/jbio.201500247 Google Scholar
H. F. Zhang et al.,
“Functional photoacoustic microscopy for high-resolution and noninvasive in vivo imaging,”
Nat. Biotechnol., 24
(7), 848
–851
(2006). http://dx.doi.org/10.1038/nbt1220 NABIF9 1087-0156 Google Scholar
J. Yao et al.,
“Photoimprint photoacoustic microscopy for three-dimensional label-free subdiffraction imaging,”
Phys. Rev. Lett., 112
(1), 014302
(2014). http://dx.doi.org/10.1103/PhysRevLett.112.014302 PRLTAO 0031-9007 Google Scholar
G. Li, K. I. Maslov and L. V. Wang,
“Reflection-mode multifocal optical-resolution photoacoustic microscopy,”
J. Biomed. Opt., 18
(3), 030501
(2013). http://dx.doi.org/10.1117/1.JBO.18.3.030501 JBOPFO 1083-3668 Google Scholar
W. Shi et al.,
“In vivo dynamic process imaging using real-time optical-resolution photoacoustic microscopy,”
J. Biomed. Opt., 18
(2), 026001
(2013). http://dx.doi.org/10.1117/1.JBO.18.2.026001 JBOPFO 1083-3668 Google Scholar
C. Zhang, K. Maslov and L. V. Wang,
“Subwavelength-resolution label-free photoacoustic microscopy of optical absorption in vivo,”
Opt. Lett., 35
(19), 3195
–3197
(2010). http://dx.doi.org/10.1364/OL.35.003195 OPLEDP 0146-9592 Google Scholar
K. Maslov et al.,
“Optical-resolution photoacoustic microscopy for in vivo imaging of single capillaries,”
Opt. Lett., 33
(9), 929
–931
(2008). http://dx.doi.org/10.1364/OL.33.000929 OPLEDP 0146-9592 Google Scholar
P. Hai et al.,
“Near-infrared optical-resolution photoacoustic microscopy,”
Opt. Lett., 39
(17), 5192
–5195
(2014). http://dx.doi.org/10.1364/OL.39.005192 OPLEDP 0146-9592 Google Scholar
G. Ku et al.,
“Photoacoustic microscopy with 2-microm transverse resolution,”
J. Biomed. Opt., 15
(2), 021302
(2010). http://dx.doi.org/10.1117/1.3339912 JBOPFO 1083-3668 Google Scholar
D.-K. Yao et al.,
“In vivo label-free photoacoustic microscopy of cell nuclei by excitation of DNA and RNA,”
Opt. Lett., 35
(24), 4139
–4141
(2010). http://dx.doi.org/10.1364/OL.35.004139 OPLEDP 0146-9592 Google Scholar
D. A. Nedosekin et al.,
“Super-resolution nonlinear photothermal microscopy,”
Small, 10
(1), 135
–142
(2014). http://dx.doi.org/10.1002/smll.201300024 SMALBC 1613-6810 Google Scholar
A. Danielli et al.,
“Label-free photoacoustic nanoscopy,”
J. Biomed. Opt., 19
(8), 086006
(2014). http://dx.doi.org/10.1117/1.JBO.19.8.086006 JBOPFO 1083-3668 Google Scholar
S. Lee et al.,
“Overcoming the diffraction limit induced by microsphere optical nanoscopy,”
J. Opt., 15
(12), 125710
(2013). http://dx.doi.org/10.1088/2040-8978/15/12/125710 JOOPDB 0150-536X Google Scholar
A. Darafsheh et al.,
“Optical super-resolution by high-index liquid-immersed microspheres,”
Appl. Phys. Lett., 101
(14), 141128
(2012). http://dx.doi.org/10.1063/1.4757600 Google Scholar
Z. Wang et al.,
“Optical virtual imaging at 50 nm lateral resolution with a white-light nanoscope,”
Nat. Commun., 2 218
(2011). http://dx.doi.org/10.1038/ncomms1211 NCAOBW 2041-1723 Google Scholar
A. Heifetz et al.,
“Photonic nanojets,”
J. Comput. Theor. Nanosci., 6
(9), 1979
–1992
(2009). http://dx.doi.org/10.1166/jctn.2009.1254 Google Scholar
H. Yang et al.,
“Super-resolution imaging of a dielectric microsphere is governed by the waist of its photonic nanojet,”
Nano Lett., 16
(8), 4862
–4870
(2016). http://dx.doi.org/10.1021/acs.nanolett.6b01255 NALEFD 1530-6984 Google Scholar
H. Yang et al.,
“Super-resolution biological microscopy using virtual imaging by a microsphere nanoscope,”
Small, 10
(9), 1712
–1718
(2014). http://dx.doi.org/10.1002/smll.v10.9 SMALBC 1613-6810 Google Scholar
J. Kasim et al.,
“Near-field Raman imaging using optically trapped dielectric microsphere,”
Opt. Express, 16
(11), 7976
–7984
(2008). http://dx.doi.org/10.1364/OE.16.007976 OPEXFF 1094-4087 Google Scholar
P. K. Upputuri et al.,
“Super-resolution coherent anti-Stokes Raman scattering microscopy with photonic nanojets,”
Opt. Express, 22
(11), 12890
–12899
(2014). http://dx.doi.org/10.1364/OE.22.012890 OPEXFF 1094-4087 Google Scholar
P. K. Upputuri et al.,
“Super-resolution photoacoustic microscopy using photonic nanojets: a simulation study,”
J. Biomed. Opt., 19
(11), 116003
(2014). http://dx.doi.org/10.1117/1.JBO.19.11.116003 JBOPFO 1083-3668 Google Scholar
C.-Y. Liu,
“Photonic nanojet shaping of dielectric non-spherical microparticles,”
Phys. E, 64 23
–28
(2014). Google Scholar
M. X. Wu et al.,
“Modulation of photonic nanojets generated by microspheres decorated with concentric rings,”
Opt. Express, 23
(15), 20096
(2015). http://dx.doi.org/10.1364/OE.23.020096 OPEXFF 1094-4087 Google Scholar
G. Gu et al.,
“Super-long photonic nanojet generated from liquid-filled hollow microcylinder,”
Opt. Lett., 40
(4), 625
–628
(2015). http://dx.doi.org/10.1364/OL.40.000625 OPLEDP 0146-9592 Google Scholar
Y. Shen, L. V. Wang and J. T. Shen,
“Ultralong photonic nanojet formed by a two-layer dielectric microsphere,”
Opt. Lett., 39
(14), 4120
–4123
(2014). http://dx.doi.org/10.1364/OL.39.004120 OPLEDP 0146-9592 Google Scholar
B. E. Treeby and B. T. Cox,
“k-wave: MATLAB toolbox for the simulation and reconstruction of photoacoustic wave fields,”
J. Biomed. Opt., 15
(2), 021314
(2010). http://dx.doi.org/10.1117/1.3360308 JBOPFO 1083-3668 Google Scholar
E. M. Strohm, M. J. Moore and M. C. Kolios,
“High resolution ultrasound and photoacoustic imaging of single cells,”
Photoacoustics, 4
(1), 36
–42
(2016). http://dx.doi.org/10.1016/j.pacs.2016.01.001 Google Scholar
E. M. Strohm, M. J. Moore and M. C. Kolios,
“Single cell photoacoustic microscopy: a review,”
IEEE J. Sel. Top. Quantum Electron., 22
(3), 6801215
(2016). http://dx.doi.org/10.1109/JSTQE.2015.2497323 IJSQEN 1077-260X Google Scholar
E. M. Strohm, E. S. Berndl and M. C. Kolios,
“High frequency label-free photoacoustic microscopy of single cells,”
Photoacoustics, 1
(3–4), 49
–53
(2013). http://dx.doi.org/10.1016/j.pacs.2013.08.003 Google Scholar
P. Wu et al.,
“Tunable and ultra-elongated photonic nanojet generated by a liquid-immersed core-shell dielectric microsphere,”
Appl. Phys. Express, 8
(11), 112001
(2015). http://dx.doi.org/10.7567/APEX.8.112001 APEPC4 1882-0778 Google Scholar
BiographyPaul Kumar Upputuri received his PhD in physics from the Indian Institute of Technology (IIT), Madras, in 2010. Currently, he is working as a research fellow at the Nanyang Technological University. He has published around 65 papers in journals and conference proceedings. His research areas are biomedical imaging, coherent Raman microscopy, ultrafast lasers, optical metrology, and instrumentation. He is a member of SPIE, OSA, Indian Laser Association (ILA), and Optical Society of India (OSI). Moganasundari Krisnan received her bachelor’s degree in biomedical engineering from the Nanyang Technological University, Singapore, in 2016. Manojit Pramanik received his PhD in biomedical engineering from Washington University in St. Louis, Missouri, USA. Currently, he is an assistant professor at the School of Chemical and Biomedical Engineering, Nanyang Technological University, Singapore. His research interests include the development of photoacoustic/thermoacoustic imaging systems, image reconstruction methods, and clinical application areas such as breast cancer imaging, molecular imaging, contrast agent development, and Monte Carlo simulation of light propagation in biological tissue. |


