|
|
1.IntroductionImaging at cellular and subcellular resolutions with optical imaging techniques is important in developmental biology. Over the past few years, there has been an increased interest in exploring the potential of high-resolution optical imaging and advanced metrological techniques for real-time in situ investigations of microorganisms such as biofilms. Biofilms are the aggregates of microorganisms such as bacteria, which are adhered to living and inert surfaces.1 They are generally enclosed in a matrix formed by extracellular polymer substances (EPS).2 Biofilms are observed abundantly in nature and they are often characterized by structural organization and population density.1,2 The development of the microbial communities and their structural organization are influenced by various environmental gradients such as shear stress, temperature, and the nutrient composition.3 Biofilms are also observed in industrial and medical environments often giving rise to a wide range of concerns, especially biosafety. It has been reported that biofilms can develop on or within indwelling medical devices such as catheters, needleless connectors, contact lenses, mechanical joints and various body tissues such as teeth, middle ear, oral tissues, and so on.4–6 The biofilms colonized in such devices are identified as the major reason for healthcare-associated bacterial infections.7,8 The formation of the biofilm and EPS enable the microorganisms to achieve better resistance toward the antimicrobial treatment as well as tenaciously attaching to surfaces.9,10 Hence, it is often a challenge to eradicate biofilms from biomedical and industrial environments to meet sufficient biosafety levels. In order to have a better understanding and control of biofilms in highly sensitive environments, an efficient in situ measurement/imaging scheme is required that would assist the strategies used for eradicating the biofilms. Literature reports various optical and nonoptical imaging methodologies for the investigation of biofilms. Nonoptical schemes include the investigation using scanning transmission x-ray microscopy, transmission electron microscopy, and nuclear magnetic resonance imaging.11,12 These are generally bulky and not feasible for in situ and online monitoring of the biofilms. On the other hand, optical imaging techniques allow noncontact and high-resolution imaging with nonionization radiation and enable real-time monitoring. Optical fluorimetry, time resolved photo acoustic spectroscopy, light microscopy, and confocal laser scanning microscopy (CLSM) are some of the reported optical techniques used for biofilm monitoring.13–15 Among these methods, CLSM is a widely accepted methodology since it allows high-resolution enface and three-dimensional (3-D) imaging of biofilms. However, this approach works only with the staining of the cells or bacteria which limits its applicability for the in vivo investigation of natural biofilms. In addition, CLSM offers a restricted penetration depth and requires the movement of the focal plane for -slicing and 3-D image acquisition. On the contrary, in vivo and label free imaging of biofilms at large working distances and improved depth can be achieved by optical coherence tomography (OCT).16–19 OCT allows depth resolved high-resolution cross-sectional and volumetric imaging of biological specimens up to a few millimeters of depth.20 The mean biofilm thickness obtained from the cross-sectional images provides a measure of the spatial size of the biofilm and is the most common variable used in biofilm literature to quantify the growth.21 The axial resolution of the practical OCT systems is limited by the center wavelength and bandwidth of the light source used. Therefore, the studies based on the tomographic images are useful only if the biofilms have sufficient thickness and structural features that are resolvable by the axial resolution of OCT system. This prevents the qualitative and quantitative investigation of the microbial growth or biofilm formation at the earlier stages of their development. This situation is more relevant in the case of biofilms, such as Klebsiella pneumonia (KP-1), which are generally developed in a flat shape and without any distinct vertical structures.22 In an OCT system, the mechanism that governs the axial and transverse resolutions is decoupled. The performance of OCT can be improved to high lateral resolution via optical coherence microscopy (OCM), which combines the coherent detection with confocal microscopy. OCM makes use of an objective with a high numerical aperture (NA) and facilitates enface visualization with high lateral resolution sufficient to resolve both structural and cellular morphology without contrasting agents. Therefore, OCM can provide better visualization of the development of the microcolonies at their earlier stages, over a large field of view. OCM provides an enhanced penetration depth compared to conventional confocal microscopy and improves the image contrast by rejecting unwanted scattered light from the out-of-focus region using coherent gated detection.23,24 Moreover, OCM based on a Fourier-domain detection scheme allows simultaneous acquisition of the signals from different depths, thereby enabling the acquisition of enface image at any depth position.25,26 Recent trends in OCM imaging are more focused on the swept source-based Fourier-domain OCM (SSOCM) configurations because of their capability to perform volume imaging at high-speed imaging and sensitivity.27,28 This makes them more attractive for many real-time applications including the in vivo and in situ monitoring of developmental biology. The feasibility of applying the OCM system for the in situ investigation of biofilms is explored in this work with a focus on the early developmental biology of a representative biofilm-KP-1. The KP-1 biofilms are allowed to grow continuously in a planar flow cell with tight control over environmental factors such as flow rate and temperature. Once the biofilm matures, it is subjected to a short perturbation via antibacterial treatment. The growth of the biofilms and their transient response under the perturbation has been monitored continuously using an in-house developed SSOCM system operating at 1300 nm. The volume imaging by the SSOCM allows the enface visualization of the base of the flow cell leading to an efficient analysis of the development of microcolonies and their spatial localization. The potential of the optical coherence systems to measure the optical density (OD) of the medium is explored and used to quantify biofilm growth. Furthermore, the planar densities of the biofilms are calculated from the OCM enface images. Both OD and planar density values measured using OCM are compared with the OD and colony forming units (CFUs) measured using standard procedures via the sampling of the flow-cell effluent. 2.Materials and Methods2.1.Biofilm GrowthWild type KP-1, an environmental isolate, was maintained at . The bacteria was cultured in M9 minimal medium (48 mM ; 22 mM ; 9 mM NaCl; 19 mM ) supplemented with 2 mM , 0.1 mM , 0.04% w/v glucose, and 0.2% w/v casamino acids (supplemented M9). The continuous flow-cell experiment was adapted from Refs. 22 and 29. Biofilms were cultivated at in three-channel flow cells with channel dimensions of (IBI Scientific). The flow cells were connected to syringes and waste collection bottles with oxygen-permeable silicon tubing. The flow cells were supplied (via syringe pumps) with supplemented M9 minimal medium at (mean velocity of and associated Reynolds number of 1.12). Overnight cultures of KP-1 were grown in LB10 medium from frozen stock and then streaked onto LB10-Agar. The streaked plates were incubated at 30°C for 24 h and then refrigerated at 3°C for a maximum of 1 week. A single colony was selected and grown overnight in supplemented M9. Afterward, the bacteria were pelleted, followed by resuspension in fresh supplemented M9, and incubation at 25°C for 1 h. Each channel of the flow cell was inoculated with overnight culture, diluted to an of 0.100 (UV-1800, Shimadzu, Japan), containing . Incubation was made without flow at 25°C for 1 h to allow cell attachment. Three-day-old biofilms were treated with 0.1% w/v sodium dodecyl sulfate (SDS) in supplemented M9 at a flow rate of for 2 h to impose a stress. Biofilm growth was monitored by periodic measurements of the and CFUs of the effluent. It has already been established in a related experiment that measurements of the effluent of the flow cell closely correlate with biomass measurements made by quantitative confocal microscopy image analysis using IMARIS and 16S rRNAs sequencing.22 2.2.Optical Coherence Microscopy ImagingA schematic of the experimental configuration used for the flow cell-based biofilm monitoring is shown in Fig. 1(a). The OCM probe was placed in the same incubator as the planar flow cell and aligned with the top glass surface. The growth rate of KP-1 has been shown to be sensitive to glucose concentrations and as such, its biomass varies from channel inlet to outlet.22 For consistency, only images of stacks of biofilms grown 5 mm from the inlet ends were used in this study. Fig. 1(a) Schematic of the planar flow cell configuration used for the biofilm growth and OCM imaging. The OCM probe is seen located above the flow-cell coverslip, with a working distance of 1 cm.  A sketch of the instrumentation scheme configured for the SSOCM, which is used for biofilm monitoring, is shown in Fig. 2(a). This system makes use of a high-speed frequency swept laser source (SL1325-P16, Thorlabs Inc.) that operates at a central wavelength of 1320 nm and bandwidth of 100 nm. The source has a repetition rate of 16,000 A-scans per second and has a coherence length of 6 mm. A built-in Mach–Zehnder interferometer within the source unit generates the calibration signal for resampling OCT signals in uniform frequency space. The laser beam from the source is directed toward a Michelson interferometer (MI) through a circulator. The light in the reference arm of MI is collimated and projected onto a mirror through a neutral density (ND) filter and a dispersion compensator (BK7 glass). The light carried by the sample arm is scanned over the sample by a two-dimensional galvo mirror-based beam steering setup. The interferogram formed by combining the retro-reflected light from the sample and reference arms is collected via the balanced detection scheme. The detected signal is digitally sampled at 50 MHz and 14-bit resolution using a high-speed digitizer (NI PXI 5622, National Instruments). The acquired A-scan signals are resampled by a spectral phase-based wavenumber linearization scheme.30,31 The various signal processing procedures for OCT image construction—including background subtraction, inverse Fourier transformation, logarithmic compression, and gray scale conversion—are made in real-time using LabVIEW software (National Instruments). Fig. 2(a) Schematic of the SS-OCM imaging setup. BD, balanced detector; C, collimator; CIR, circulator; DAC, digital to analog converter; CH, digitizer channel; FC, fiber coupler; GM, galvo mirror; M, mirror; ND, neutral density filter; OBJ, objective; PD, photo detector; PC, personal computer. (b) Axial PSFs measured from different depth positions. (c) Axial PSF of the raw fringe and spectrally reshaped fringe. (d) Enface image of the USAF chart demonstrating the lateral resolution of the imaging system. 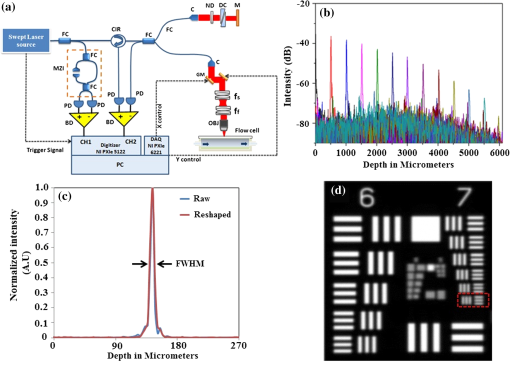 The average output power of the laser source is 6 mW and the incident power on the sample (flow cell channel) is 2.6 mW. The axial point spread functions measured from different depth positions are shown in Fig. 2(b). A peak sensitivity of 110 dB was measured using an ND filter () and a mirror. An axial resolution of in air ( after spectral shaping using Hamming window) was measured using the full width at half maximum (FWHM) of the PSF as shown in Fig. 2(c). This is corresponding to resolution in growth medium (). The light in the sample arm is collimated and focused onto the sample surface by a commercially available microscope objective with magnification (, LD Plan-Neofluar 441340, Zeiss). The lateral resolution of the imaging system is quantified using a USAF resolution chart after being immersed into growth medium at 1-mm depth and by holding a cover glass slip on the surface of the medium. This is to replicate experimental conditions where the probe beam has to pass through the cover glass slip and growth medium for imaging biofilms at the bottom surface of the flow cell. Figure 2(d) shows the enface image of the USAF chart. From the image, it is evident that the smallest element that can be resolved is group 7—element 6, which indicate a lateral resolution of . This resolution is sufficient to resolve the microcolonies of KP-1.32,33 The position of the beam waist is manually calibrated such that focal plane coincides with the bottom surface of the flow cell. The laser beam was scanned over the flow-cell channel in the - and -directions using two orthogonally aligned galvo mirrors (GVSM002, Thorlabs Inc.), 5 mm away from the flow-cell inlet. The volume images are generated by combining the individual B-scan images. The volumetric data contained and the physical size of a sampled voxel is . The B-scan images are acquired at a speed of 20 frames per second. This corresponds to a volume acquisition time of 25 s. Enface OCM images with a dimension of were generated by selecting a depth-of-interest (bottom surface of the flow-cell channel) from all cross-sectional images in a volumetric data set and a square root compression was applied to the intensity for visualization. This is corresponding to a field of view of . Therefore, the developed OCM system provides the combined spatial and temporal resolution necessary for assessing the acute biofilms to consistent growth and perturbations. 2.3.Optical Density Measurement Using OCM TechniqueThe quantitative analysis of the microbial growth is performed in terms of OD of the bacterial microcolonies since this correlates directly with the cell concentration.34,35 Considering the single-scattering model for the photon diffusion, the depth-dependent decay of the OCM signal follows Beer–Lamberts law as36,37 where OD is the ; is the extinction coefficient, is the concentration, is the intensity of the OCT signal, and is the optical path length of the medium. Since the extinction coefficient (for a single bacterial species) and the length of the channel are constant, then the OD directly correlates with the concentration of the biofilm. In addition to providing morphological images, OCT can perform quantitative measurements of local optical intensities which would enable the estimation of OD or reflectivity of the biological specimen.38 It has been reported that the bottom surface of the flow cell can serve as a reference surface whose relative position and reflectivity can be used for the estimation of the refractive index and thickness of the biofilms.21 In the present experiment, the OD is altered by the varying concentration of bacterial cells or microcolonies leading to a subdued intensity from the bottom surface, according to the relation16,38 where is the reflection peak that corresponds to the base of the flow channel before inoculation (), is the reflection peak at any time instant and represents the time varying concentration of the microbial. Therefore, the OD of the biofilms can be calculated by the relation2.4.Planar Density MeasurementA quantitative analysis of the biofilm growth is performed in terms of planar density, which represents the ratio of the area occupied by the microbial communities to the total field of view. In order to highlight and calculate the area occupied by the microcolonies, the enface images are subtracted from the background image followed by edge detection using ImageJ. 3.Results and DiscussionsTo facilitate the growth of biofilms on engineering plastics, a standard planar flow cell was used. Figure 3(a) shows the enface image of the base of the flow-cell channel. The surface roughness, scratches, and holes are apparent from the topography of the lower plastic base. A side-by-side comparison is made by bright field microscopy (Nikon Eclipse LV100 with objective) and demonstrates that these features are not artifacts induced by OCM. Fig. 3Enface image of bottom surface of the flow cell channel acquired by (a) OCM and (b) light microscopy. The scale bar represents . 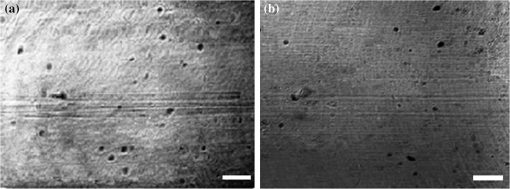 Figures 4(a)–4(f) show the representative images (day 1, day 3, and day 3 just 2 h after perturbation) of the growth dynamics of a KP-1 biofilm as imaged continuously over a period of 6 days. The nonuniform profile of the base surface reduces the visibility of microcolonies. In order to study the spatial localization of microcolonies and their quantification, image processing methods have been adopted. The edge detected images highlight the regions occupied by the bacterial microcolonies and are shown in Figs. 4(b), 4(d), and 4(f), respectively. Fig. 4Enface images and edge detected images of the KP-1 microcolonies formed on the base of flow cell channel. (a), (c), and (e) Biofilm growth on day 1, day 3, and day 3; 2 h after perturbation. (b), (d), and (f) Corresponding edge detected images. The scale bar represents . 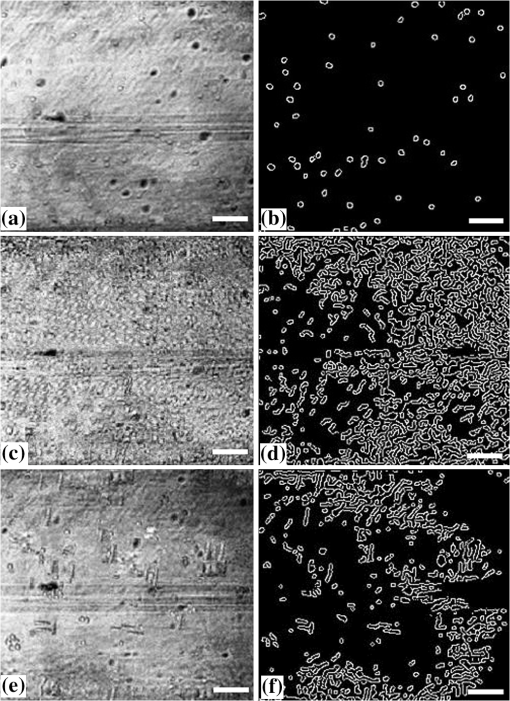 On day-1, fragmented biofilm regions are apparent [see Fig. 4(a)]. By day-3, a mature KP-1 biofilm is visible and occupies the entire bottom surface of the channel, as shown in Fig. 4(c). The average lateral size of the microcolonies is found to be on day 3, which is in good agreement with size ranges previously reported.33 On day-3, the matured biofilm is treated with 0.1% of w/v SDS, and the recovery from the transient response was observed for the next 3 days (day-4 to day-6). Figure 4(e) shows the image acquired 2 h after the perturbation, demonstrating significant reduction of the biomass in response to the perturbation. The biomass has reached its minimum level on day-4 and gradually recovered over the following days (day-5 and day-6). The complete set of enface images of microcolonies of KP-1 and their background removed and edge detected images are given in Appendix A [see Figs. 7(a)–7(n)]. This result is consistent with the growth rate reported for the same KP-1 biofilm, with identical experimental conditions.22 The cross-sectional images of the flow cell (on day-3) are provided in Appendix B (see Figs. 8(a)–8(d). These figures illustrate that the biofilms developed at the bottom cannot be resolved via the cross-sectional imaging at an axial resolution of . On the other hand, the enface images with high lateral resolution provide better visualization of bacterial microcolonies and their development at the bottom surface of the flow cell. Figure 5 shows the representative averaged A-scan profiles acquired from the volume under investigation before and after the biofilm growth. The first two peaks in the profile represent the reflections from the top and bottom surfaces of the glass cover slip. The third peak represents the reflection from the base of the flow-cell channel. The region between the top and bottom reflections represents the growth medium, where the signal attenuation is dominant due to the absorption. It is known that the plankton cells and biofilms that are present in the flow cell will alter the OD. The variation in the OD would be reflected as a variation in peak reflection from the base surface. Fig. 5These are representative A-scan profiles (averaged) demonstrating a reduction of the reflection peak caused by the presence of the microbial. 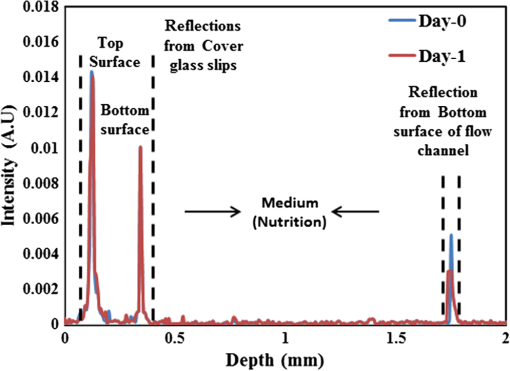 Figure 6(a) shows the OD plot obtained by the standard approach based on UV–VIS spectroscopy () of the effluent. Similarly, CFU measurements are illustrated in Fig. 6(b). These measurements are different from OD since they only quantify the viable cells that are able to be cultured into colonies. Nevertheless, the trend in CFU’s is similar to that for OD. Figure 6(c) shows the OD plot obtained using OCM techniques based on Eq. (3). The individual OD values with standard deviation are calculated from the six datasets that are successively collected from the same sample. It is observed that OD measured using the OCM technique is consistent with the OD measured using spectroscopy. However, their absolute values differ due to the use of different wavelength regimes for their measurements. It can be seen that the OD increases from day-1 to day-3 representing the growth of biofilm. On day-3, OD reaches a maximum indicating that the biofilm is now mature. The reduction of the OD can be observed on day-3 to day-4, representing the reduction of biomass in response to the perturbation by SDS. The recovery of the biofilm on days 5 and 6 was also exhibited by the OD analysis as a gradual increase in the OD values. Fig. 6(a) Standard OD () measurements and (b) CFU measurements made by periodically sampling the flow-cell effluent. (c) OD measured via OCM and (d) planar density measurements of the biofilm via OCM. 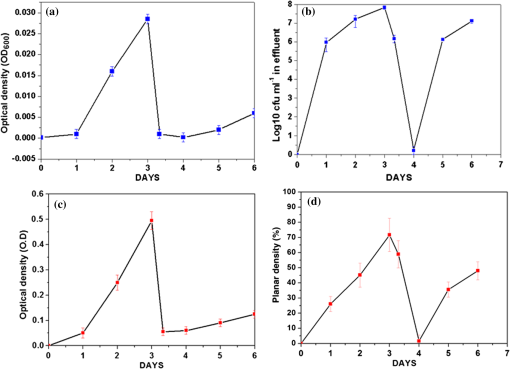 Quantitative analysis of biofilms based on the OCM enface images was also made. Figure 6(d) shows the planar density of the biofilm microcolonies, which represents the ratio of the area occupied by the microbial communities to the total field of view. Figure 6(d) shows the variation of the planar density over different days. It is evident from the illustrated figures and analysis that the quantitative assessment of the biofilm growth using both the OCM technique and standard procedures closely agrees with the enface image-based analysis. 4.ConclusionA custom-built swept source-based OCM system with a lateral resolution of was used to acquire the enface images during the growth of KP-1 biofilms. The development of the biofilms and the transient processes in response to the antibacterial treatment was demonstrated using enface images. The growth of biofilms are quantified in terms of OD and planar density using the OCM technique, which is found to be consistent with the assessment based on the spectroscopy-based OD values and CFUs. It is envisaged that this in situ monitoring with OCM can make impactful contributions toward various biofilm analyses and their growth monitoring in vivo. Moreover, this proposed methodology can be extended to the possible use of this bio-optic probe variety of different applications such as for the detection of the resistance to therapeutic agents during treatment of chronic infections in vivo. AppendicesAppendix A:Enface Images of the Microcolonies of Klebsiella pneumonia at the Bottom Surface of the Flow ChannelFigure 7 shows the development of the microcolonies of KP-1, at the bottom surface of the flow channel. Figure 7(a), 7(c), 7(e), 7(g), 7(i), 7(k), and 7(m) show the enface images of the bacterial microcolonies. The presence of microcolonies is highlighted by back ground subtraction followed by the edge detection, as shown in Figs. 7(b), 7(d), 7(f), 7(h), 7(j), 7(l), and 7(n), respectively. Figures 7(a), 7(c), and 7(e) demonstrate the continuous growth of the KP-1 biofilms in the presence of nutrition medium. On day-3, biofilms have matured and occupied the entire area of the bottom surface as shown in Fig. 7(e). Figure 7(g) shows the image acquired 2 h after the perturbation. On day-4, the biomass has reached its minimum as shown in Fig. 7(i). The biomass has recovered on the following days (day-5 and day-6), which is evident from Figs. 7(k) and 7(m), respectively. Fig. 7Enface images and edge detected images showing the development of the KP-1 microcolonies from day-0 to day-6. (a), (c), and (e) The continuous growth of microcolonies from day-0 to day-3. (g) The microcolonies 2 h after the perturbation. (i) Microcolonies are reduced to minimum on day-4. (k) and (m) The recovery of the biofilms on day-5 and day-6, respectively. (b), (d), (f), (h), (j), (l), and (n) The corresponding edge detected images. The scale bar represents . 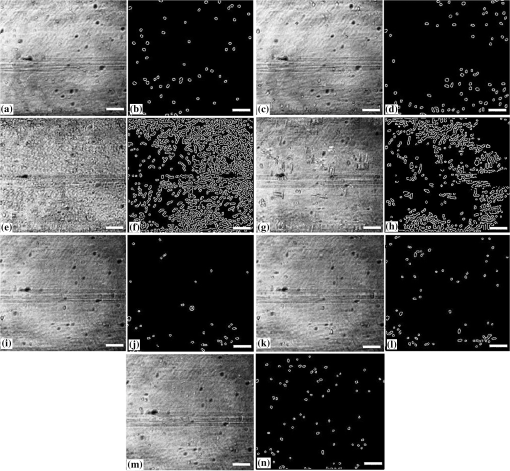 Appendix B:Cross-Sectional Images of the Flow Channel (on Day-3)Figure 8 shows the enface and cross-sectional images of the bottom surface of the flow-cell channel. Figure 8(a) shows the enface image of the KP-1 biofilm developed at the bottom surface of the flow channel on day-3. Figures 8(b)–8(d) show the cross-sectional images corresponding to the lateral positions indicated by the red dotted line in Fig. 8(a). In Figs. 8(b)–8(d), the two horizontal lines at the top represent the reflections from the top and bottom surfaces of the cover glass slip. The third horizontal line at the bottom represents the reflection from the bottom surface of the flow-cell channel, where the biofilms are developed. The physical depth of the channel is 1 mm and enface images used for the investigations are acquired from this depth. The region between the cover glass slip and bottom surface of the flow-cell channel is occupied by the growth medium. This medium is fairly transparent to the probe beam and one cannot expect backscattered photons from this region. Consequently, this region would appear as dark in the cross-sectional image. From the illustrated figures, it is evident that the tomographic images with an axial resolution of are unable to resolve the morphological structures of the biofilms. On the other hand, enface images with a lateral resolution of acquired using SSOCM clearly show the developed biofilm at the bottom surface of the flow channel. AcknowledgmentsThe authors acknowledge the financial support received through MOE Tier 1 project (RG96/14) and COLE-EDB funding. ReferencesS. S. Branda et al.,
“Biofilms: the matrix revisited,”
Trends Microbiol., 13
(1), 20
–26
(2005). http://dx.doi.org/10.1016/j.tim.2004.11.006 Google Scholar
M. D. Rodney,
“Biofilms: microbial life on surfaces,”
Emerging Infect. Dis. J., 8
(9), 881
(2002). http://dx.doi.org/10.3201/eid0809.020063 Google Scholar
P. S. Stewart,
“Biophysics of biofilm infection,”
Pathog. Dis., 70
(3), 212
–218
(2014). http://dx.doi.org/10.1111/2049-632X.12118 Google Scholar
J. W. Costerton, P. S. Stewart and E. P. Greenberg,
“Bacterial biofilms: a common cause of persistent infections,”
Science, 284
(5418), 1318
–1322
(1999). http://dx.doi.org/10.1126/science.284.5418.1318 SCIEAS 0036-8075 Google Scholar
W. E. Stamm,
“Catheter-associated urinary tract infections: epidemiology, pathogenesis, and prevention,”
Am. J. Med., 91
(3), S65
–S71
(1991). http://dx.doi.org/10.1016/0002-9343(91)90345-X Google Scholar
A. Dongari-Bagtzoglou,
“Pathogenesis of mucosal biofilm infections: challenges and progress,”
Expert Rev. Anti-Infective Ther., 6
(2), 201
–208
(2008). http://dx.doi.org/10.1586/14787210.6.2.201 1743-4440 Google Scholar
M. D. Rodney,
“Biofilms and device-associated infections,”
Emerging Infect. Dis. J., 7
(2), 277
(2001). http://dx.doi.org/10.3201/eid0702.700277 Google Scholar
S. S. Magill et al.,
“Multistate point-prevalence survey of health care-associated infections,”
N. Engl. J. Med., 370
(13), 1198
–1208
(2014). http://dx.doi.org/10.1056/NEJMoa130680 Google Scholar
K. Smith and I. S. Hunter,
“Efficacy of common hospital biocides with biofilms of multi-drug resistant clinical isolates,”
J. Med. Microbiol., 57
(8), 966
–973
(2008). http://dx.doi.org/10.1099/jmm.0.47668-0 Google Scholar
P. S. Stewart and J. W. Costerton,
“Antibiotic resistance of bacteria in biofilms,”
Lancet, 358
(9276), 135
–138
(2001). http://dx.doi.org/10.1016/S0140-6736(01)05321-1 LANCAO 0140-6736 Google Scholar
J. R. Lawrence et al.,
“Scanning transmission X-ray, laser scanning, and transmission electron microscopy mapping of the exopolymeric matrix of microbial biofilms,”
Appl. Environ. Microbiol., 69
(9), 5543
–5554
(2003). http://dx.doi.org/10.1128/AEM.69.9.5543-5554.2003 Google Scholar
F. V. B. Manz, D. Goll and H. Horn,
“Investigation of biofilm structure, flow patterns and detachment with magnetic resonance imaging,”
Water Sci. Technol., 52
(7), 1
–6
(2005). http://dx.doi.org/10.1002/bit.10782 Google Scholar
T. Schmid et al.,
“A photoacoustic technique for depth-resolved in situ monitoring of biofilms,”
Environ. Sci. Technol., 36
(19), 4135
–4141
(2002). http://dx.doi.org/10.1021/es0158657 Google Scholar
R. Bakke, R. Kommedal and S. Kalvenes,
“Quantification of biofilm accumulation by an optical approach,”
J. Microbiol. Methods, 44
(1), 13
–26
(2001). http://dx.doi.org/10.1016/s0167-7012(00)00236-0 Google Scholar
L. N. Mueller et al.,
“Analysis of a marine phototrophic biofilm by confocal laser scanning microscopy using the new image quantification software PHLIP,”
BMC Ecol., 6
(1), 1
–15
(2006). http://dx.doi.org/10.1186/1472-6785-6-1 Google Scholar
L. Zhou et al.,
“Effects of titanium dioxide nanoparticles coupled with diode laser on optical properties of in vitro normal and cancerous human lung tissues studied with optical coherence tomography and diffuse reflectance spectra,”
J. Biomed. Opt., 20
(4), 046003
(2015). http://dx.doi.org/10.1117/1.JBO.20.4.046003 Google Scholar
C. Haisch and R. Niessner,
“Visualisation of transient processes in biofilms by optical coherence tomography,”
Water Res., 41
(11), 2467
–2472
(2007). http://dx.doi.org/10.1016/j.watres.2007.03.017 Google Scholar
C. Xi et al.,
“High-resolution three-dimensional imaging of biofilm development using optical coherence tomography,”
J. Biomed. Opt., 11
(3), 034001
(2006). http://dx.doi.org/10.1117/1.2209962 Google Scholar
M. Balu et al.,
“Effect of excitation wavelength on penetration depth in nonlinear optical microscopy of turbid media,”
J. Biomed. Opt., 14
(1), 010508
(2009). http://dx.doi.org/10.1117/1.3081544 Google Scholar
D. Huang et al.,
“Optical coherence tomography,”
Science, 254
(5035), 1178
–1181
(1991). http://dx.doi.org/10.1036/1097-8542.757714 SCIEAS 0036-8075 Google Scholar
R. K. Meleppat et al.,
“Quantification of biofilm thickness using a swept source based optical coherence tomography system,”
Proc. SPIE, 9524 95242L
(2015). http://dx.doi.org/10.1117/12.2190106 PSISDG 0277-786X Google Scholar
K. W. K. Lee et al.,
“Biofilm development and enhanced stress resistance of a model, mixed-species community biofilm,”
ISME J., 8
(4), 894
–907
(2014). http://dx.doi.org/10.1038/ismej.2013.194 Google Scholar
J. A. Izatt et al.,
“Optical coherence tomography and microscopy in gastrointestinal tissues,”
IEEE J. Sel. Top. Quantum Electron., 2
(4), 1017
–1028
(1996). http://dx.doi.org/10.1109/2944.577331 Google Scholar
J. A. Izatt et al.,
“Optical coherence microscopy in scattering media,”
Opt. Lett., 19
(8), 590
–592
(1994). http://dx.doi.org/10.1364/OL.19.000590 OPLEDP 0146-9592 Google Scholar
J. W. Hettinger, W. R. Myers and M.E. Williams,
“Optical coherence microscopy. a technology for rapid, in vivo, non-destructive visualization of plants and plant cells,”
Plant Physiol., 123
(1), 3
–16
(2000). http://dx.doi.org/10.1117/12.2044758.3439408435001 Google Scholar
V. J. Srinivasan et al.,
“Optical coherence microscopy for deep tissue imaging of the cerebral cortex with intrinsic contrast,”
Opt. Express, 20
(3), 2220
–2239
(2012). http://dx.doi.org/10.1364/OE.20.002220 OPEXFF 1094-4087 Google Scholar
O. O. Ahsen et al.,
“Swept source optical coherence microscopy using a 1310 nm VCSEL light source,”
Opt. Express, 21
(15), 18021
–18033
(2013). http://dx.doi.org/10.1364/OE.21.018021 OPEXFF 1094-4087 Google Scholar
S.-W. Huang et al.,
“Swept source optical coherence microscopy using a Fourier domain mode-locked laser,”
Opt. Express, 15
(10), 6210
–6217
(2007). http://dx.doi.org/10.1364/OE.15.006210 OPEXFF 1094-4087 Google Scholar
S. A. Crusz et al.,
“Bursting the bubble on bacterial biofilms: a flow cell methodology,”
Biofouling, 28
(8), 835
–842
(2012). http://dx.doi.org/10.1080/08927014.2012.716044 BFOUEC 0892-7014 Google Scholar
R. K. Meleppat, M. V. Matham and L. K. Seah,
“An efficient phase analysis-based wavenumber linearization scheme for swept source optical coherence tomography systems,”
Laser Phys. Lett., 12
(5), 055601
(2015). http://dx.doi.org/10.1088/1612-2011/12/5/055601 Google Scholar
K. M. Ratheesh, L. K. Seah and V. M. Murukeshan,
“Spectral phase-based automatic calibration scheme for swept source-based optical coherence tomography systems,”
Phys. Med. Biol., 61
(21), 7652
(2016). http://dx.doi.org/10.1088/0031-9155/61/21/7652 Google Scholar
K. W. K. Lee et al.,
“Draft genome sequence of Klebsiella pneumoniae strain KP-1,”
Genome Announcements, 1
(6), 13
–14
(2013). http://dx.doi.org/10.1128/genomeA.01082-13 Google Scholar
S. P. Dzul et al.,
“Contribution of the Klebsiella pneumoniae capsule to bacterial aggregate and biofilm microstructures,”
Appl. Environ. Microbiol., 77
(5), 1777
–1782
(2011). http://dx.doi.org/10.1128/AEM.01752-10 Google Scholar
J. A. Myers, B. S. Curtis and W. R. Curtis,
“Improving accuracy of cell and chromophore concentration measurements using optical density,”
BMC Biophys., 6
(1), 1
–16
(2013). http://dx.doi.org/10.1186/2046-1682-6-4 Google Scholar
H.-L. Lin et al.,
“Revisiting with a relative-density calibration approach the determination of growth rates of microorganisms by use of optical density data from liquid cultures,”
Appl. Environ. Microbiol., 76
(5), 1683
–1685
(2010). http://dx.doi.org/10.1128/aem.00824-09 Google Scholar
J. Li et al.,
“Quantitative measurement on optical attenuation coefficient of cell lines 5-8F and 6-10B using optical coherence tomography,”
J. Appl. Phys., 112
(8), 084702
(2012). http://dx.doi.org/10.1063/1.4757035 Google Scholar
L. Wind and W. W. Szymanski,
“Quantification of scattering corrections to the Beer-Lambert law for transmittance measurements in turbid media,”
Meas. Sci. Technol., 13
(2002). http://dx.doi.org/10.1088/0957-0233/13/6/501 Google Scholar
H. Chen et al.,
“Quantitative analysis of retinal layers’ optical intensities on 3D optical coherence tomography for central retinal artery occlusion,”
Sci. Rep., 5 9269
(2015). http://dx.doi.org/10.1038/srep09269 Google Scholar
BiographyRatheesh Kumar Meleppat received his Bachelor of Technology degree in electronics and communication engineering from the University of Calicut, India, in 2006 and his Master of Technology in optoelectronics and optical communications from the University of Kerala, India, in 2011. He is currently pursuing his PhD at the Centre for Optical and Laser Engineering (COLE), School of MAE, Nanyang Technological University, Singapore. He is a student member of SPIE and IEEE Photonics Society. Christopher Shearwood graduated in physics (honors) from the Department of Physics, Leeds University, UK, in 1984, and then received his PhD in solid state physics in 1988. He has been at the School of Mechanical and Aerospace Engineering since 1998 and has an interest in biofilm research. He is a fellow of the Institute of Physics. Seah Leong Keey received his BSc and PhD degrees in mechanical engineering from the University of Strathclyde, UK, in 1985 and 1989, respectively. He has been at the School of MAE, Nanyang Technological University of Singapore, since 1989. His major research interests are optical fiber sensor, optical imaging technique, smart structures, experimental stress analysis, and thin-walled structures. He has published more than 80 top quality international conference and journal papers and holds two international patents. Murukeshan Vadakke Matham is an associate professor at the School of MAE and deputy director of COLE, NTU. His main research interests are biomedical optics, nanoscale optics, and applied optics for metrology. He has published more than 250 research articles in leading journals and conference proceedings and has 6 patents and 8 innovations disclosures. He is a fellow of the Institute of Physics and is a member of SPIE. |


