
|
|
|
Fundus photography plays a key role in retinal study and disease diagnosis. However, the diffraction limit poses a fundamental barrier to the spatial resolution of conventional ophthalmic instruments. Particularly, the maximum of available numeric aperture (NA) of the human eye is , which limits the spatial resolution of in vivo retinal imaging. Adaptive optics has been used to compensate for optical aberrations to improve resolution of retinal imaging,1 but the achievable resolution is still diffraction limited. Further improvement of imaging resolution is desirable for sensitive detection of subtle distortions of retinal morphology at an early stage of eye diseases. Several approaches, including stimulated emission depletion microscopy,2 photoactivated localization microscopy3,4 and stochastic optical reconstruction microscopy,5 have been demonstrated for high-resolution microscopy of biological cells and tissues. However, the high power requirement of laser illumination for super-resolution imaging limits their application for retinal study of living animals or humans. Moreover, all of these methods require fluorescence labeling, which makes their application for imaging intrinsic optical signals (IOSs) unachievable. Structured illumination microscopy (SIM) performs a patterned illumination on the object to shift the high frequency information to lower frequencies within the passing bandwidth of the imaging system, and thus expands the effective bandwidth of the optical system by subsequent frequency shifting and recombination. SIM is applicable to both fluorescence6–8 and nonfluorescence imaging.9,10 However, for the purpose of super-resolution reconstruction, traditional SIM requires sophisticated mechanical manipulation of a grating9,10 or grid11,12 to generate structured illumination patterns with accurate phase control, which is particularly challenging for moving samples, such as the retina with inevitable eye movements. In theory, SIM also can be achieved in a point scanning system through spatiotemporal modulation, either by modulating the light source intensity in an illumination light path or by moving a physical mask in a detection light path.13 However, the physically spatiotemporal modulation of the illumination/detection light is difficult for ophthalmic applications due to the limited imaging speed. We recently demonstrated super-resolution scanning laser microscopy14 using virtually structured detection (VSD), which requires neither physical modulation of the light source intensity in the illumination arm nor a physical mask in the light detection arm. Without the complexity of SIM for precise phase and pattern controls, the VSD-based approach provides an easy, low-cost, and phase-artifact-free strategy to achieve super-resolution scanning laser microscopy and optical coherence tomography.15 However, deployable application of the VSD for in vivo retinal imaging is challenged by limited frame-speed of single-point scanning prototype.14 Line-scanning strategy has been demonstrated for high-speed in vivo retinal imaging.16 Recently, we demonstrated the potential of combining the line-scanning strategy for VSD-based super-resolution imaging.17,18 In this letter, we report experimental validation of VSD combined with the line-scanning strategy as a feasible method to achieve in vivo super-resolution imaging of frog retina with subcellular resolution. Technical details of the VSD method and VSD-based line-scanning super-resolution imaging have been reported previously.17,19 Figure 1 shows a schematic diagram of the experimental setup. A near-infrared superluminescent diode (SLD-35-HP, SUPERLUM), which has a center wavelength of 830 nm and a bandwidth of 60 nm, was used as the light source. A focused line illumination was produced by a cylindrical lens with a focal length of 50 mm. The focused line was scanned across the retina by a scanning galvanometer mirror (GVS001, THORLABS). The pivot point of the scanner was placed conjugate with the pupil plane of the frog eye to minimize the vignetting effect. The reflected light from the retina was descanned by the scanning mirror and relayed to the image plane of the retina with a magnification of . For theoretical estimation of system magnification, the focal length of the frog eye is assumed as .20 A high-speed two-dimensional (2-D) CMOS camera with a pixel size of (Photron FastCam AX50) was used to acquire the images of the line profiles on the retina. The pixel size corresponds to a pixel sampling resolution of at the retina. To achieve the maximum imaging speed, only one-dimensional line scanning (along the axis) was adopted, and nonisotropic resolution improvement would be expected. A region of interest of the camera, 32 pixels along the direction and 512 pixels along the direction, was chosen in the experiment. 512 line profiles were acquired to reconstruct one VSD-based super-resolution image. In our experiment, the imaging speed of the camera was set at (fps), corresponding to a 127-fps speed for VSD-based super-resolution imaging. The light enters the frog pupil with a beam diameter of and a power of . Fig. 1Schematic diagram of the optical apparatus for in vivo imaging of frog retina. SLD, superluminescent diode; CO, collimator; L1–L4, lens; BS, beam splitter; CL, cylindrical lens; SGM, scanning galvanometer mirror. The scanning direction is along the axis. The focal length of the CL is 50 mm. Focal lengths of lenses L1–L4 are 80, 80, 25, and 400 mm, respectively. The focal length of the frog eye is estimated as .20 The pixel size of the camera is . 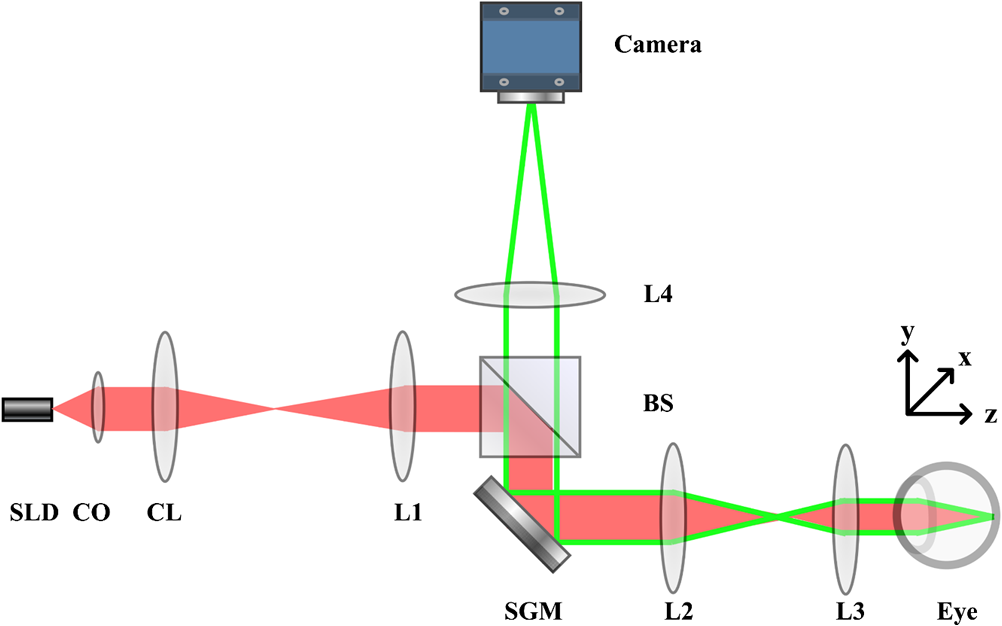 Northern leopard frogs (Rana pipiens) were used for this study. The experimental procedure was approved by the Office of Animal Care and Institutional Biosafety Committee of the University of Illinois at Chicago. The frog was anesthetized by immersing it into tricaine methanesulfonate (MS-222) solution (). After confirmation of the anesthesia, the frog was placed in an animal holder, which can provide five degrees of freedom to allow easy adjustment of the animal orientation and retinal area, to perform in vivo imaging. The pupils were fully dilated with atropine (1%) and phenylephrine (2.5%) solution. Figure 2 shows representative in vivo images of the frog retinal photoreceptor layer. Figure 2(a) shows an equivalent wide-field image by superimposing raw images acquired with line-scanning illumination. The field of view is . Because the photoreceptors can be barely resolved, the average size of the visible photoreceptor that is can be estimated as the actual resolution of the imaging system. Figure 2(b) shows the corresponding VSD-based super-resolution image. Spatial resolution along the direction shows significant enhancement compared to the wide-field image as shown in Fig. 2(a). That is, the photoreceptors become readily resolved along the direction, while along the direction, they are still not well resolved, as evidenced by reflective intensity profiles shown in Figs. 2(c) and 2(d). Figure 2(c) shows the reflective intensity profiles along the horizontal ( direction) yellow dashed lines in Figs. 2(a) and 2(b), where we can see that the five individual photoreceptors could be barely resolved for both wide-field and VSD-based super-resolution images. The reflective intensity profile along the vertical ( direction) yellow dashed line in the VSD-based image shows significant improvement in terms of resolution compared to the counterpart in the wide-field image, as shown in Fig. 2(d). To confirm this perspective, we quantitatively compared spatial frequency spectra of the equivalent wide-field and VSD-based super-resolution images, which are shown in Figs. 2(e) and 2(f). It appears that the spatial frequency spectrum of the VSD-based image undergoes significant enhancement along both directions compared to the spatial frequency spectrum of the wide-field image. To clarify this point, we plotted the spatial frequency profiles of the spatial spectra along and (spatial frequency coordinates) directions in Figs. 2(g) and 2(h). Figure 2(g) shows the spatial frequency components along direction of the VSD-based super-resolution image, which show slight improvement compared to those of the wide-field image. The spatial frequency components along direction of the VSD-based image, however, show significant improvement compared to those of the wide-field image, especially the spatial frequency components higher than , which corresponds to the actual resolution, as evidenced in Fig. 2(h). The anisotropy of the spatial frequency enhancement confirms anisotropy of the spatial resolution improvement, which can be attributed to the unidirectional VSD implementation. Fig. 2Comparative in vivo imaging of the photoreceptor layer of the frog retina. (a) Equivalent wide-field image and (b) VSD-based super-resolution image. (c) Reflective intensity profiles along the horizontal yellow dashed lines in (a) and (b). (d) Reflective intensity profiles along the vertical yellow lines in (a) and (b). (e, f) spatial frequency spectra of (a) and (b), respectively. (g) Spatial frequency profiles along direction through the centers of (e) and (f). (h) Spatial frequency profiles along direction through the centers of (e) and (f). Scale bars in Figs. 2(a) and 2(b): . Scale bars in Figs. 2(e) and 2(f): . 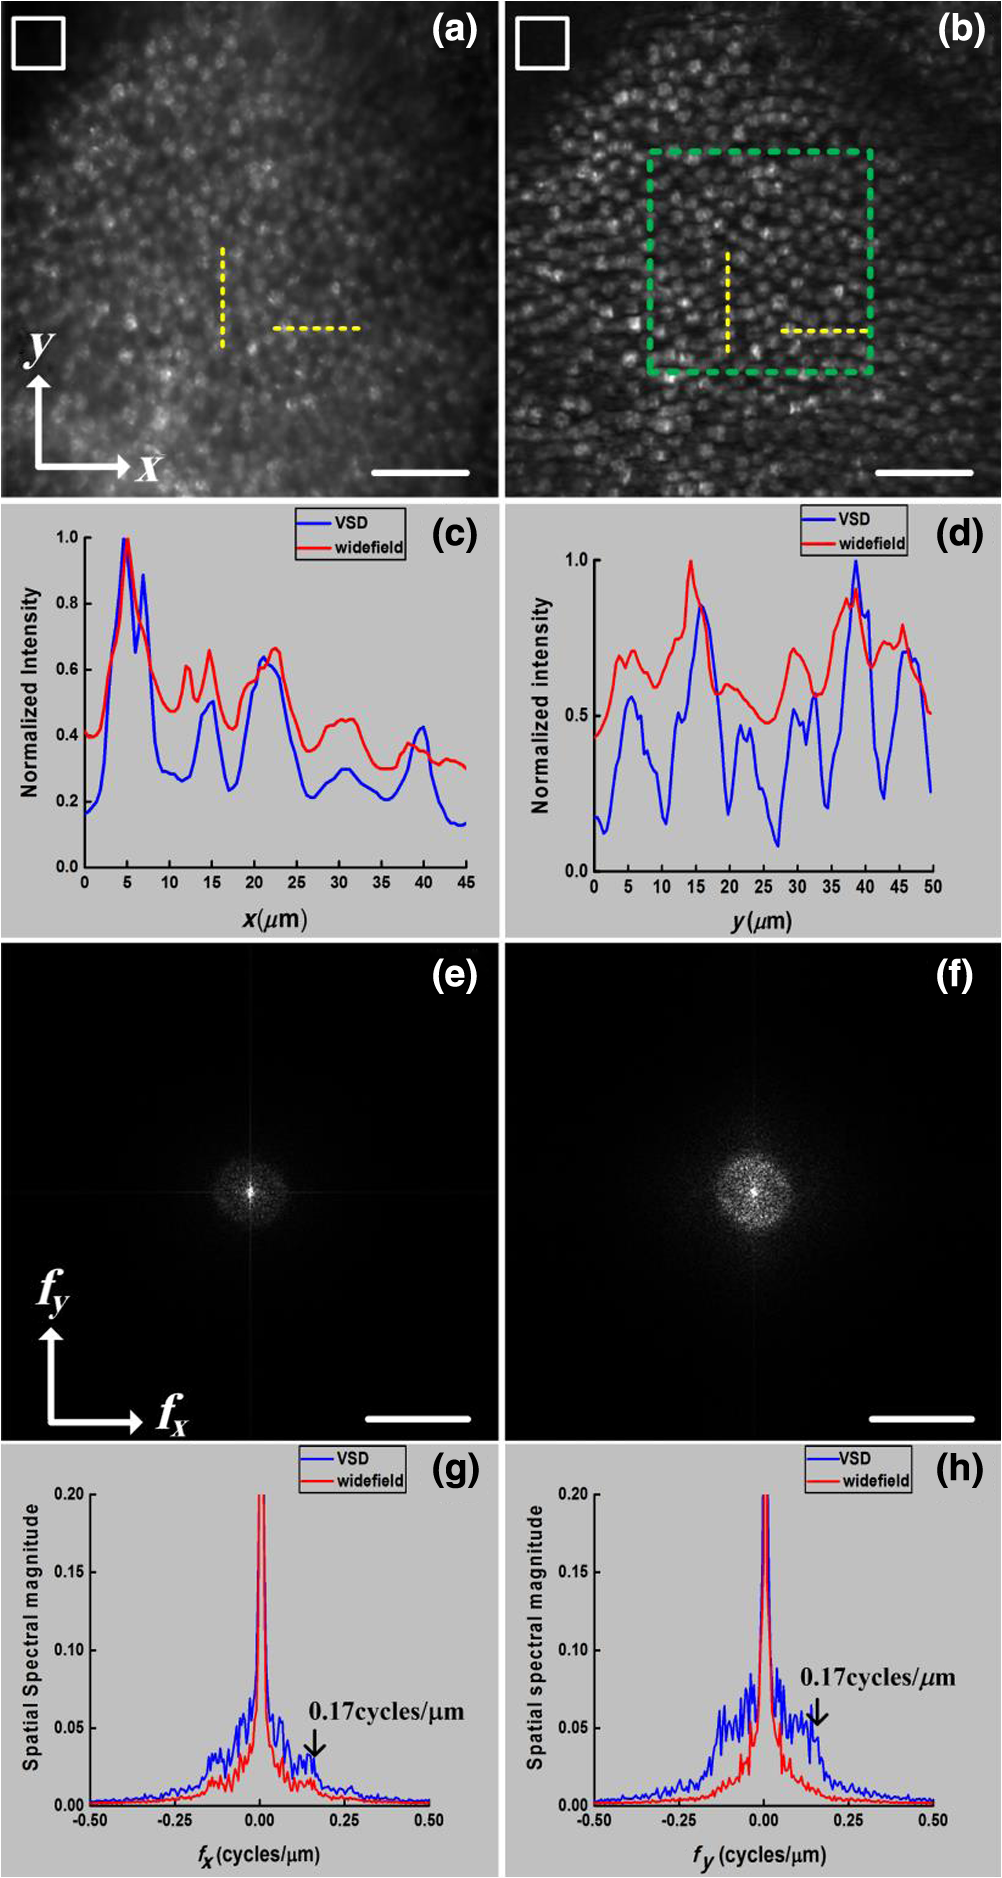 The benefit of the resolution enhancement can be shown in Fig. 3, which shows the zoomed view of the region marked by the green window in Fig. 2(b). Bright subcellular structures (red arrowheads) can be unambiguously observed. The bright subcellular structures were previously observed in two-photon excited autofluorescence images, which were speculated to be correlated with the structure of photoreceptor connecting cilium.21 Compared to the equivalent wide-field image, the VSD super-resolution image also showed improved signal-to-noise ratio (SNR) and image contrast. In order to calculate the image contrast of the wide-field images, and VSD-based super-resolution images, respectively, the images are divided into overlapping segments and the maximum intensity and minimum intensity are found within the segmented region. The average contrast is calculated using Fig. 3Zoomed view of the region bounded by the green square in Fig. 2(b). Red arrows point to subcellular structures. Scale bar: . 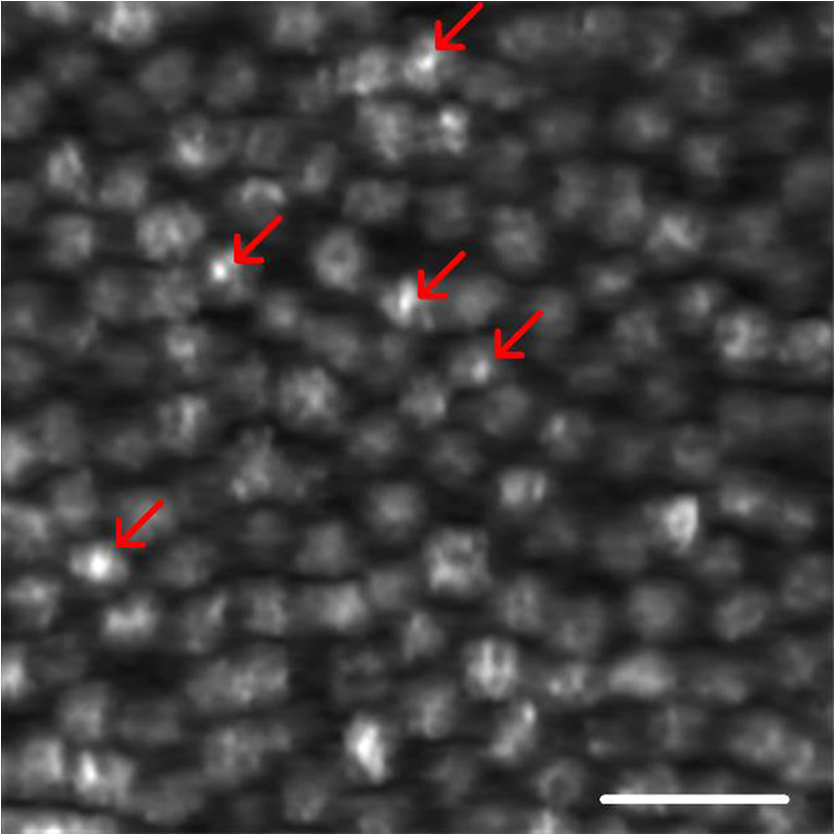 The average contrasts of the equivalent wide-field image in Fig. 2(a), and the VSD-based super-resolution image in Fig. 2(b) are calculated as 0.54 and 0.92, respectively. Compared with the wide-field image, the VSD-based super-resolution image could obtain the clearer mosaic structure with higher image contrast. The SNRs of the equivalent wide-field and VSD-based super-resolution images can be estimated by where is computed by averaging the peak intensities of the bright subcellular structures as highlighted in Fig. 3, and is estimated by the standard deviation of the dark regions in the white boxes in Figs. 2(a) and 2(b). The SNR calculated from the wide-field image is , while the SNR of the VSD-based image is , which verifies that the SNR is also improved by the VSD method compared to the wide-field imaging.To further confirm the improvement of spatial resolution and depth-resolved sectioning capability provided by the VSD method, frog retinal nerve fibers were also imaged. Figure 4 shows representative in vivo images of the frog retinal nerve fiber layer. Figures 4(a) and 4(b) show the wide-field and VSD-based images, respectively. It is clear that the VSD-based image shows significant improvement of spatial resolution compared to the wide-field image. Again the spatial frequency spectra of the wide-field and VSD-based images, as shown in Figs. 4(c) and 4(d), were quantified to confirm this observation. Similar to the case of the photoreceptor imaging, spatial frequency spectra of the VSD-based super-resolution image appear enhanced along both and directions compared to those of the equivalent wide-field image. By close examination of their spatial frequency profiles as shown in Figs. 4(e) and 4(f), it shows that improvement of the frequency components especially those higher than is indeed achieved mainly along direction, which is consistent with our observation in the photoreceptor imaging. This anisotropy reasonably arises from the unidirectional VSD implementation. Fig. 4Comparative in vivo images of the retinal nerve fibers. (a) Equivalent wide-field image and (b) VSD-based super-resolution image. (c, d) Spatial frequency spectra of (a) and (b), respectively. (e) Spatial frequency profiles along direction through the centers of (c) and (d). (f) Spatial frequency profiles along direction through the centers of (c) and (d). Scale bars in Figs. 4(a) and 2(b): . Scale bars in Figs. 4(c) and 2(d): . 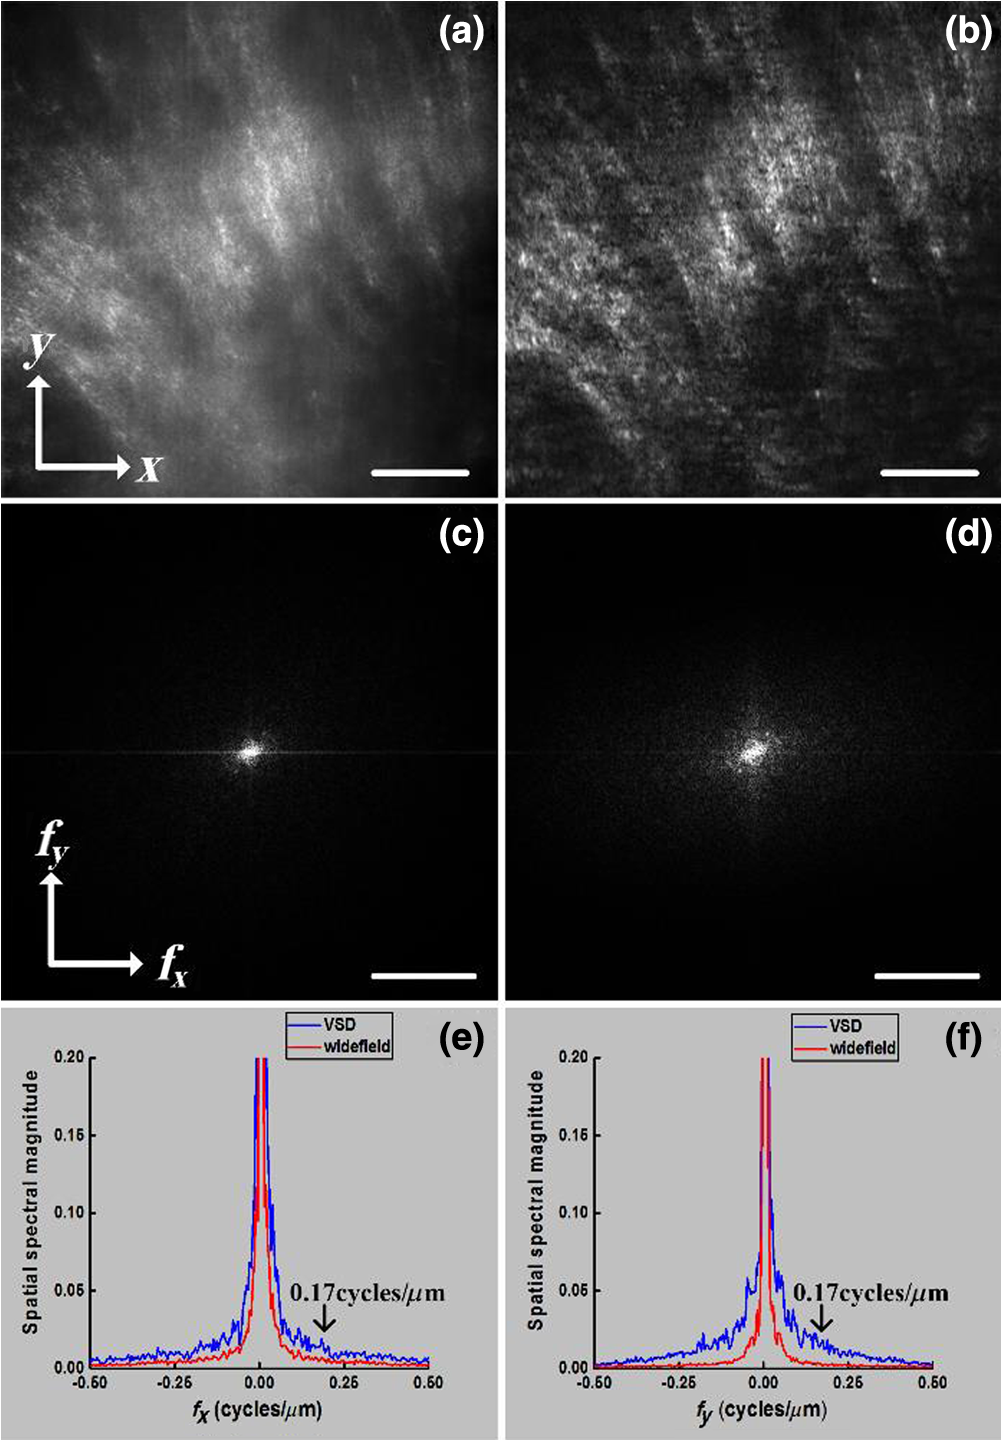 In summary, in vivo VSD-based super-resolution imaging of frog retina has been demonstrated using a high-speed line-scanning imager. In comparison with equivalent wide-field images, the VSD-based super-resolution images show improved spatial resolution, SNR, and image contrast. With improved resolution, subcellular structures, i.e., bright subcellular spots in retinal photoreceptors could be unambiguously identified (Fig. 3). According to comparisons of the extents of spatial frequency contents before and after VSD implementation, as evidenced in Figs. 2(g) and 2(h), and in Figs. 4(e) and 4(f), the resolution achieved by VSD-based line-scanning imaging is improved by a factor of compared to that of the wide-field counterpart. Further improvement in the extent of spatial frequency contents or spatial resolution begins to introduce imaging artifacts due to image noise. We are currently pursuing denoising methods to achieve further resolution improvement. For the proof of concept, the line-scanning strategy was employed to achieve image speed up to 127 fps, with a fame size of . In principle, the image speed can be further improved by decreased frame size. Because of the line illumination, the resolution improvement of the current prototype instrument is anisotropic. Isotropic resolution improvement can be achieved by using multiple-orientation scanning,17 with compromised image speed. Further development of the VSD-based imaging system can provide an easy, low-cost, and phase-artifact-free strategy to achieve super-resolution of the human retina, promising sensitive detection of morphological distortions to foster better study and diagnosis of eye diseases. Improved imaging resolution can also benefit functional assessment of retinal physiology. Recent studies have indicated that high resolution is essential to provide high sensitivity in functional IOS imaging of stimulus-evoked retinal physiological changes.22–24 Moreover, the development of super-resolution ophthalmic instruments will allow in vivo study of transient retinal phototropism,25–27 which can not only provide a better understanding of the nature of the visual system but may also produce new biomarkers for early detection of eye diseases. AcknowledgmentsThis research was supported in part by NIH R01 EY023522, NIH R01 EY024628, NSF CBET-1055889, and NIH P30 EY001792. ReferencesD. R. Williams,
“Imaging single cells in the living retina,”
Vision Res., 51 1379
–1396
(2011). http://dx.doi.org/10.1016/j.visres.2011.05.002 VISRAM 0042-6989 Google Scholar
S. W. Hell,
“Toward fluorescence nanoscopy,”
Nat. Biotechnol., 21 1347
–1355
(2003). http://dx.doi.org/10.1038/nbt895 NABIF9 1087-0156 Google Scholar
E. Betzig et al.,
“Imaging intracellular fluorescent proteins at nanometer resolution,”
Science, 313 1642
–1645
(2006). http://dx.doi.org/10.1126/science.1127344 SCIEAS 0036-8075 Google Scholar
M. F. Juette et al.,
“Three-dimensional sub-100 nm resolution fluorescence microscopy of thick samples,”
Nat. Methods, 5 527
–529
(2008). http://dx.doi.org/10.1038/nmeth.1211 1548-7091 Google Scholar
M. J. Rust, M. Bates and X. Zhuang,
“Sub-diffraction-limit imaging by stochastic optical reconstruction microscopy (STORM),”
Nat. Methods, 3 793
–795
(2006). http://dx.doi.org/10.1038/nmeth929 1548-7091 Google Scholar
M. G. Gustafsson,
“Surpassing the lateral resolution limit by a factor of two using structured illumination microscopy,”
J. Microsc., 198 82
–87
(2000). http://dx.doi.org/10.1046/j.1365-2818.2000.00710.x Google Scholar
M. G. Gustafsson,
“Nonlinear structured-illumination microscopy: wide-field fluorescence imaging with theoretically unlimited resolution,”
Proc. Natl. Acad. Sci. U. S. A., 102 13081
–13086
(2005). http://dx.doi.org/10.1073/pnas.0406877102 Google Scholar
M. G. Gustafsson et al.,
“Three-dimensional resolution doubling in wide-field fluorescence microscopy by structured illumination,”
Biophys. J., 94 4957
–4970
(2008). http://dx.doi.org/10.1529/biophysj.107.120345 BIOJAU 0006-3495 Google Scholar
S. Chowdhury, A. H. Dhalla and J. Izatt,
“Structured oblique illumination microscopy for enhanced resolution imaging of non-fluorescent, coherently scattering samples,”
Biomed. Opt. Express, 3 1841
–1854
(2012). http://dx.doi.org/10.1364/BOE.3.001841 BOEICL 2156-7085 Google Scholar
J. H. Park, J. Y. Lee and E. S. Lee,
“Enhancing the isotropy of lateral resolution in coherent structured illumination microscopy,”
Biomed. Opt. Express, 5 1895
–1912
(2014). http://dx.doi.org/10.1364/BOE.5.001895 BOEICL 2156-7085 Google Scholar
D. Debarre et al.,
“Adaptive optics for structured illumination microscopy,”
Opt. Express, 16 9290
–9305
(2008). http://dx.doi.org/10.1364/OE.16.009290 OPEXFF 1094-4087 Google Scholar
D. Karadaglic and T. Wilson,
“Image formation in structured illumination wide-field fluorescence microscopy,”
Micron, 39 808
–818
(2008). http://dx.doi.org/10.1016/j.micron.2008.01.017 MICNB2 0047-7206 Google Scholar
J. Lu et al.,
“Super-resolution laser scanning microscopy through spatiotemporal modulation,”
Nano Lett., 9 3883
–3889
(2009). http://dx.doi.org/10.1021/nl902087d NALEFD 1530-6984 Google Scholar
R. W. Lu et al.,
“Super-resolution scanning laser microscopy through virtually structured detection,”
Biomed. Opt. Express, 4 1673
–1682
(2013). http://dx.doi.org/10.1364/BOE.4.001673 BOEICL 2156-7085 Google Scholar
B. Wang et al.,
“Breaking diffraction limit of lateral resolution in optical coherence tomography,”
Quant. Imaging Med. Surg., 3 243
–248
(2013). http://dx.doi.org/10.3978/j.issn.2223-4292.2013.10.03 Google Scholar
Q. X. Zhang et al.,
“In vivo confocal intrinsic optical signal identification of localized retinal dysfunction,”
Invest Ophthalmol. Vis. Sci., 53 8139
–8145
(2012). http://dx.doi.org/10.1167/iovs.12-10732 Google Scholar
Y. Zhi et al.,
“Rapid super-resolution line-scanning microscopy through virtually structured detection,”
Opt. Lett., 40 1683
–1686
(2015). http://dx.doi.org/10.1364/OL.40.001683 OPLEDP 0146-9592 Google Scholar
Y. Zhi, B. Wang and X. C. Yao,
“Super-resolution scanning laser microscopy based on virtually structured detection,”
Crit. Rev. Biomed. Eng., 43 297
–322
(2015). http://dx.doi.org/10.1615/CritRevBiomedEng.v43.i4 CRBEDR 0278-940X Google Scholar
A. C. Aho,
“The visual acuity of the frog (Rana pipiens),”
J. Comp. Physiol. A, 180 19
–24
(1997). http://dx.doi.org/10.1007/s003590050023 JCPADN 0340-7594 Google Scholar
R. W. Lu et al.,
“Two-photon excited autofluorescence imaging of freshly isolated frog retinas,”
Biomed. Opt. Express, 2 1494
–1503
(2011). http://dx.doi.org/10.1364/BOE.2.001494 BOEICL 2156-7085 Google Scholar
Q. Zhang et al.,
“Functional optical coherence tomography enables in vivo physiological assessment of retinal rod and cone photoreceptors,”
Sci. Rep., 5 9595
(2015). http://dx.doi.org/10.1038/srep09595 SRCEC3 2045-2322 Google Scholar
X. Yao and B. Wang,
“Intrinsic optical signal imaging of retinal physiology: a review,”
J. Biomed. Opt., 20 090901
(2015). http://dx.doi.org/10.1117/1.JBO.20.9.090901 JBOPFO 1083-3668 Google Scholar
B. Wang et al.,
“En face optical coherence tomography of transient light response at photoreceptor outer segments in living frog eyecup,”
Opt. Lett., 38 4526
–4529
(2013). http://dx.doi.org/10.1364/OL.38.004526 OPLEDP 0146-9592 Google Scholar
X. Zhao et al.,
“Stimulus-evoked outer segment changes in rod photoreceptors,”
J. Biomed. Opt., 21 065006
(2016). http://dx.doi.org/10.1117/1.JBO.21.6.065006 JBOPFO 1083-3668 Google Scholar
B. Q. Wang et al.,
“Functional optical coherence tomography reveals transient phototropic change of photoreceptor outer segments,”
Opt. Lett., 39 6923
–6926
(2014). http://dx.doi.org/10.1364/OL.39.006923 OPLEDP 0146-9592 Google Scholar
R. W. Lu et al.,
“Dynamic near infrared imaging reveals transient phototropic change in retinal rod photoreceptors,”
J. Biomed. Opt., 18 106013
(2013). http://dx.doi.org/10.1117/1.JBO.18.10.106013 JBOPFO 1083-3668 Google Scholar
|


