
|
|
1.IntroductionMost fundamental biological knowledge is, at least in part, based on the study of model organisms. An ideal model should not only be as relevant as possible, but it should be convenient, inexpensive, and easy to use. In addition, models able to give results as reproducibly as possible are highly desirable. Saccharomyces cerevisiae is one of the most widely studied and extensively used model organisms, with fully characterized genome.1 It displays most of the features of higher eukaryotes (each yeast cell contains all the major organelles also present in the higher eukaryotes). Yet its utilization is simple, economical, and rapid in most cases. For instance, a majority of the knowledge on mitochondrial function and dysfunction were discovered by studying Saccharomyces cerevisiae.2 Moreover, yeast belongs to the foremost studied model organisms for nutrient sensing questions.3 5-aminolevulinic acid (ALA), as well as some of its derivatives, has an excellent clinical tolerance and good tumor selectivity in many cases. These prodrugs are clinically approved and used for diagnostic and therapeutic applications, mostly in dermatology, neurosurgery, and urology.4–9 They are precursors of protoporphyrin IX (PpIX), a fluorescent, oxygen-sensitive, and photosensitizing molecule.10 Topical (in the form of cream or instillation) or systemic (mostly oral) administration of ALA leads to an intracellular production of PpIX in mammalian cells.7,11 The ability of PpIX to accumulate in certain cancer cells/tissues combined with its phototoxic and fluorescent properties allow its use in photodynamic therapy (PDT) and photodiagnosis (PDD), respectively.5,9,12,13 In mammals, PpIX is produced via the heme biosynthetic pathway, which occurs partially in mitochondria. In all living organisms, heme plays a key role in oxygen sensing and utilization, as well as in regulation of various processes through similar mechanisms.14–16 In yeasts, PpIX is produced through the same biosynthetic mechanism,17 thus making them excellent models to study the modulation of endogenous PpIX production. Heme functions as the internal barometer of oxygen tension in Saccharomyces cerevisiae and is dependent on the levels of oxygen in the extracellular environment.18 It also impacts the expression of respiratory function genes and genes, which are responsible for the oxidative damage controlling.19–21 Furthermore, it was showed that Saccharomyces cerevisiae is able to produce endogenously PpIX after ALA and 2,2′-bipyridyl addition.22,23 The objective of this study was to develop a model producing endogenous levels of PpIX comparable to those observed in the abovementioned clinical applications. Such a model is of high interest to optimize or study basic mechanisms involved in PDT and PDD, such as the influence of agents or environmental factors on the modulation of the PpIX biosynthetic pathway;23,24 the study of steady-state and time-resolved spectroscopy of PpIX produced endogenously, in particular, its dependence on environmental factors [temperature and oxygen partial pressure ()];12,13,25 the development of optical phantoms mimicking the PpIX fluorescence spectroscopy and intensity observed in tumors,26,27 the study of agents modulating the production of ROS, including singlet oxygen, to optimize and/or monitor PDT.28 Thus, the determination of the conditions reproducibly leading to the maximal PpIX fluorescence intensity produced by Saccharomyces cerevisiae was studied and is reported in this paper. It is noteworthy that, although various fluorescent porphyrins with similar spectroscopy account for the typical porphyrin fluorescence spectrum, the name “PpIX” is used throughout to mean “PpIX and other fluorescent porphyrins with similar fluorescence spectrum.” PpIX accumulation in yeast after ALA and 2,2′-bipyridyl administration was visualized by fluorescence microscopy. In addition, the steady-state and time-resolved spectroscopy of PpIX produced in this model was compared to that of PpIX dissolved in DMSO. Finally, the sensitivity of PpIX delayed fluorescence (DF) lifetime on the was determined in yeast and in solutions to confirm that PpIX is the main luminophore presenting a long (up to a few hundreds of microseconds) luminescence in this model. 2.Materials and Methods2.1.Growth Conditions of the YeastYeast cells from Saccharomyces cerevisiae YSC2 (Type II, Sigma Aldrich, Switzerland, in the order of USD ) were shaken in a rotary shaker at 210 rpm and 32°C in aqueous glucose () solution. It should be noted that, under these conditions, yeast cells are not replicating. This fact does not prevent the production of PpIX, as demonstrated by our results. 2.2.Assessment of the Endogenous PpIX Fluorescence Intensity and Steady-State Fluorescence Spectroscopy of PpIX in SolutionALA (Sigma Aldrich, Switzerland) was dissolved in distilled water with pH adjusted to by addition of NaOH. 2,2′-bipyridyl (Sigma Aldrich, Switzerland) was dissolved in pure ethanol. Various concentrations of ALA (5 nM to 30 mM) and/or 2,2′-bipyridyl ( to 30 mM; 0.5% v/v) were added to yeast to determine the maximal PpIX fluorescence intensity. Samples were incubated in the rotary shaker for 3 h. During this incubation time, PpIX fluorescence intensity already reached half of its maximal intensity, as described below in more details. Maximal fluorescence intensity was achieved with a combination of ALA () and 2,2′-bipyridyl (1 mM). All spectroscopic measurements were performed in 3 ml cuvettes filled with a clear diluted 2.5% solution of yeast. The fluorescence spectroscopy and intensity of the PpIX produced endogenously were measured with a fully calibrated Horiba Fluorolog®-3 spectrofluorometer operated in the front face mode and using an excitation at 405 nm with 2-nm excitation slit width and 10-nm emission slit width. These conditions were used to avoid the edge effects and spectral distortion. The temperature of the cuvette holder was controlled by a Neslab (Newington, NH) RTE refrigerated circulator and kept at 32°C (same temperature as in the incubator shaker). To prevent sedimentation, samples were stirred during the measurement. Power illuminating the samples during the spectroscopic measurements was . This power did not photobleach PpIX in yeast, nor did it create a PpIX photoproduct (data not shown). The identification of these conditions is based on a separate study aiming at determining the conditions that are optimal in terms of photobleaching, lack of spectral distortion due to the optical properties of the sample (inner filter effect), and temperature dependence of the PpIX spectroscopy. The intensity of the PpIX fluorescence emission peak at 635 nm was used to assess its relative concentration. All experiments were performed three times and error bars in the figures represent the standard deviation of these three independent measurements. Independent batches of yeasts were prepared for all different experimental conditions. Pure 25 nM PpIX dimethyl ester (Sigma Aldrich, Switzerland) was dissolved in DMSO (Sigma Aldrich, Switzerland). Fluorescence spectrum of PpIX dimethyl ester was measured using the same parameters as for recording fluorescence spectra of PpIX produced endogenously in yeast after 3 h incubation with ALA and 2,2′-bipyridyl. 2.3.PpIX Pharmacokinetics MeasurementPpIX fluorescence intensity in yeast was measured for 48 h after addition of ALA and 1 mM 2,2′-bipyridyl using the set-up conditions described in Sec. 2.2. The volume of medium was checked and filled to the initial volume before each measurement to compensate the evaporation, which took place during the 48-h-long measurements. 2.4.Fluorescence Microscopy of YeastYeast cells were placed onto 35-mm culture dishes with integral no. 0 glass cover slip bottoms (MatTek, Ashland, Massachusetts) covered with ECL Cell Attachment Matrix (Millipore, Bedford, Massachusetts). The optimal concentrations of ALA () and 2,2′-bipyridyl (1 mM) were added to yeast cells, which were then incubated overnight in the rotary shaker. Cells were stained for mitochondrial membrane potential with Rhodamine 123 (ThermoFischer Scientific, Waltham, Massachusetts), green fluorescent, and cell-permeant dye.29 After 30 min incubation at 32°C with Rhodamine 123, cells were centrifuged ( for 5 min) and visualized with fluorescence microscope (Laboratoryophot-2; Nikon, Japan) equipped with an air-cooled, slow scan 16-bit CCD camera, and mercury-vapor lamp (HbO, 100 W) and an 60X oil objective (Nikon; NA: 1.4). BV-2A Nikon filter cube (excitation: 400 to 440 nm; 455-nm dichroic mirror; emission: 470-nm high-pass filter) was used for PpIX fluorescence and FITC Nikon filter cube (excitation: 475 to 490 nm; 500- to 540-nm dichroic mirror; emission: 520-nm long-pass filter) for Rhodamine 123 fluorescence. Images were analyzed by Image J software (National Institutes of Health, Bethesda, Maryland). 2.5.Measurement of the PpIX Delayed Fluorescence LifetimesDF lifetimes were measured with the optical fiber-based time-resolved setup previously described by Piffaretti et al.12 Briefly, PpIX molecules were excited with 5-ns light pulses at 405 nm emitted by a nitrogen-laser-pumped dye laser (MNL 100 HP, LTB) at 10 Hz. These pulses were coupled into a quartz optical fiber, which was also used to collect the PpIX emission. This emission was filtered with two high-quality band-pass filters to reject all wavelengths outside with an . To discriminate the prompt fluorescence from the DF, a gated PMT (C1392, R928) was used in such a way that it was blinded during the first after the pulse. The resulting PMT signal was sampled (LeCroy instruments LT342, 500 MHz) in temporal windows ranging between and 10 ms. The average of at least 10 sweeps was then fitted with a double exponential decay model. The reciprocal lifetime (inverse of the long lifetime component) was used to derive the value according to the Stern–Volmer equation. 12 Acquisition (LabVIEW, National Instruments, Austin, Texas) and analysis (OriginLab®, Northampton, Massachusetts) were automatically performed in real time via a homemade interface. Yeast samples were incubated overnight with ALA and 1 mM 2,2′-bipyridyl in the incubator shaker to reach the maximal PpIX intensity. Yeast solutions were then centrifuged at for 5 min to further increase the yeast, and hence the PpIX, concentration by a factor eight. The pellet was resuspended in the aqueous glucose () solution (5 ml) and the final solution was placed into a flask. Oxygen partial pressure and temperature of the final solution were kept constant (using air bubbling with atmospheric and 32°C, respectively), as in the rotary shaker conditions, during all the experiment (unless otherwise specified). Yeast suspension in the flask was circulated via a peristatic pump through a flow cell cuvette (Hellma Analytics: 137-1-40). The optical path length of this cuvette was 1 mm. The total circulated volume was 4 ml and yeast suspension flow speed . The tip of the measurement fiber was applied in gentle contact to the quartz window of the flow cell. In these conditions, the sensing volume was in the order of . Ten excitation pulses (, 10 Hz) were sufficient to assess the value (). In our conditions, PpIX photobleaching can be neglected.13 This is compounded by the fact that the probability that a given yeast cell be probed is in the order of . 3.Results and Discussion3.1.Determination of the Optimal Conditions Inducing Maximal PpIX Fluorescence IntensityThe main aim of this study was to determine the optimal conditions, at which Saccharomyces cerevisiae cells reproducibly produce the maximal PpIX fluorescence intensity. It was reported that the presence of a metal-chelating agent (2,2′-bipyridyl) enhances endogenous PpIX fluorescence intensity in yeast.22,30 Same effects were observed with another iron-chelator, Desferal®, which effects were extensively studied on mammalian cells.24 2,2′-bipyridyl decreases generation of metallo-porphyrins and increases accumulation of free porphyrins by complexing with a number of bivalent metals including iron,31 which would otherwise bind preferentially to porphyrins and turn them into nonfluorescent moieties. One of the most frequently used mediums for growing yeast is rich medium (YPD; containing yeast extract, peptone, and dextrose/glucose).32 However, YPD has a strong autofluorescence interfering with PpIX fluorescence (data not shown). To simplify yeasts’ maintenance and following measurements of the yeast fluorescence, YPD was replaced in all experiments with a high glucose concentration solution (; see Sec. 2.1). Arrest of the cell replication under this condition does not affect endogenous production of PpIX in yeast. In addition, the steady-state and time-resolved luminescence spectroscopy of PpIX is comparable between the in vitro and in vivo situations. This fact is very favorable: without yeast cells replication, is constant (Fig. 1) and longtime experiments can be carried out [up to 2 days (data not shown)]. On the other hand, if yeast cells are grown in the “standard” conditions (in the presence of YPD), in the medium slowly decreases (with increasing amount of yeast cells) due to the replication of yeast cells. Fig. 1Evolution of the in a yeast solution in the presence of high glucose (filled square) and in yeast grown in YPD (filled circle)—See text for conditions. was measured with the Oxylab probe. The lines are drawn for visual support only.  According to a report by Strakhovskaya et al.,23 0.2 mM 2,2′-bipyridyl induced remarkable increase of endogenous PpIX fluorescence intensity in Saccharomyces cerevisiae. Since this yeast strain contains up to 1.5 mM endogenous ALA,33 no additional ALA was needed. On the other hand, different conditions for maintaining yeast were used in this study than in Strakhovskaya et al. and ALA addition was essential. Individual contributions to the endogenous PpIX production of ALA or 2,2′-bipyridyl are discussed later. Various concentrations of ALA and 2,2′-bipyridyl were incubated with yeast and fluorescence spectra of PpIX were recorded. Figure 2 shows the ALA and 2,2′-bipyridyl concentration dependence curve, respectively. It was found that PpIX fluorescence intensity was reproducibly the highest when it was incubated with ALA and 1 mM 2,2′-bipyridyl. It should be noted that in the presence of 2,2′-bipyridyl, the absolute fluorescence intensity of the PpIX was times higher than without 2,2′-bipyridyl addition. This is in accordance with observations in other studies.24,34 Fig. 2Evolution of the fluorescence measured at 635 nm for various ALA and 2,2′-bipyridyl concentrations (excitation: 405 nm). (a) Various ALA concentrations in the presence of 1 mM 2,2′-bipyridyl (filled circle) and without 2,2′-bipyridyl (filled square); (b) various 2,2′-bipyridyl concentrations in the presence of ALA (filled square). See text for further conditions. The lines are drawn for visual support only. Each point represents the average of three independent measurements, error bars represent the standard deviation of these three independent measurements. 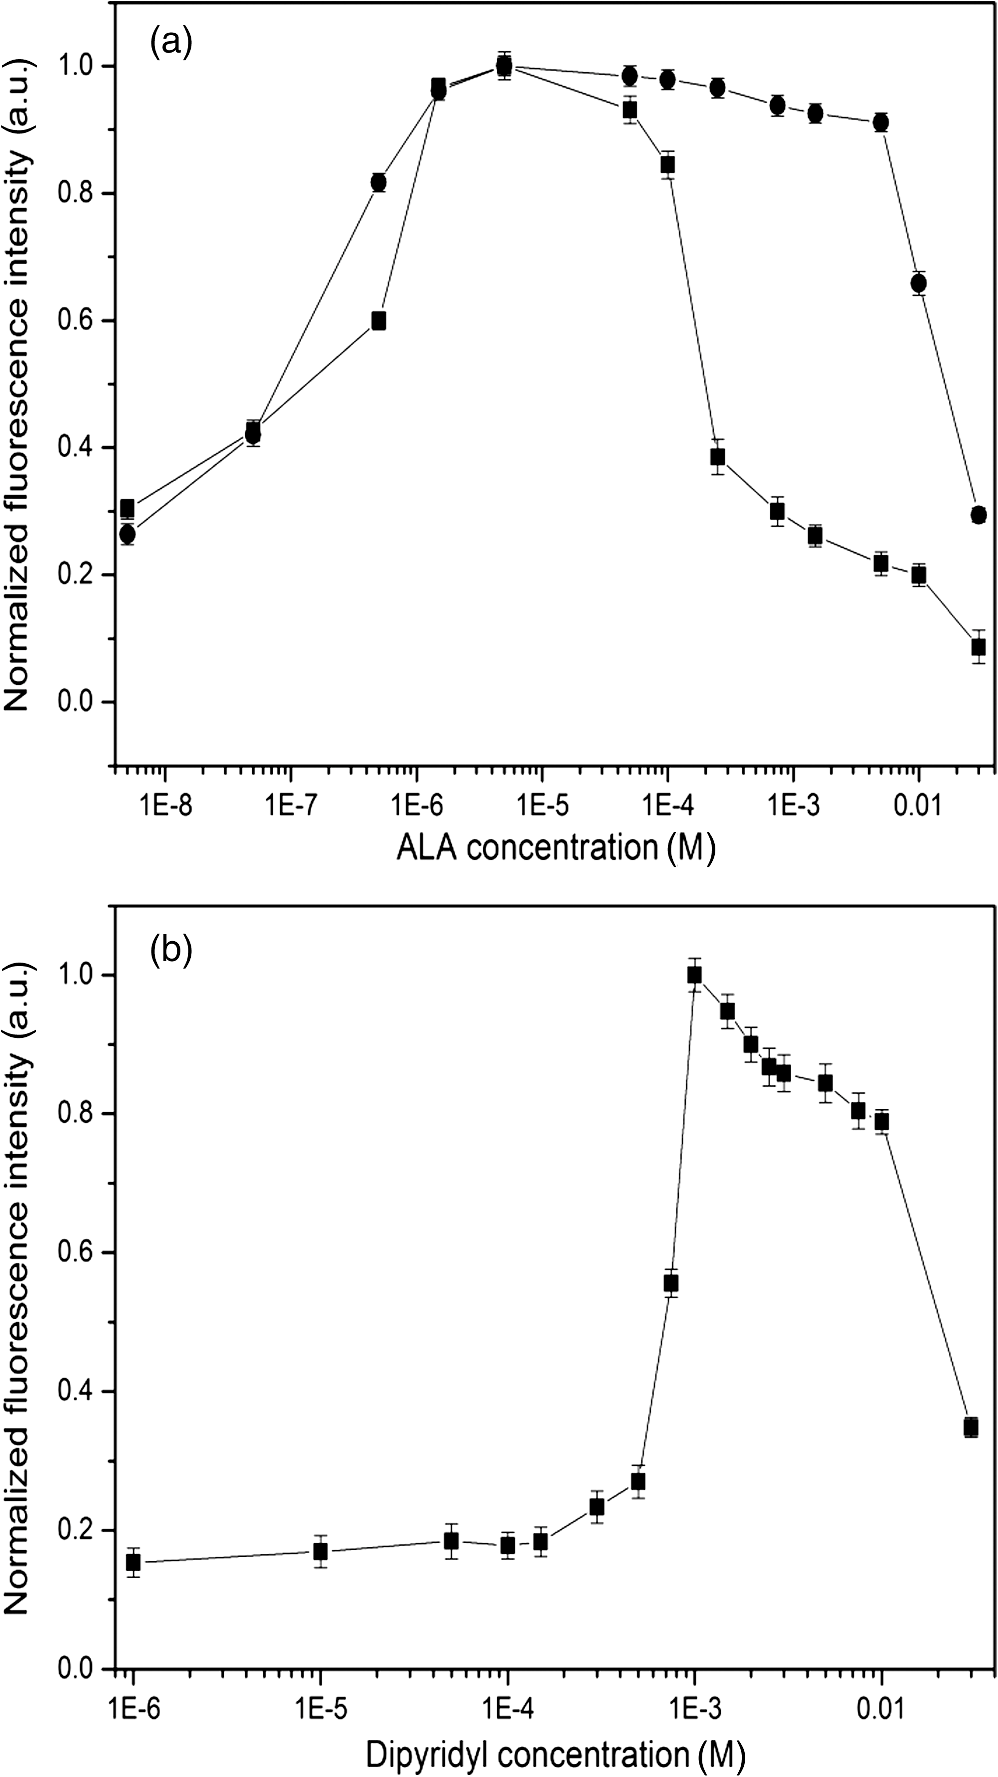 Optimal concentration of 2,2′-bipyridyl determined in this study (1 mM) is higher than that was reported in other papers,22,23,30 where 0.2 mM 2,2′-bipyridyl was shown to be the most effective for maximal endogenous PpIX fluorescence intensity. Higher concentration of 2,2′-bipyridyl led to inhibition of cell respiration and growth.23 In this study, this effect was observed at concentrations higher than 1 mM. Difference in the optimal 2,2′-bipyridyl concentration and essential presence of ALA is probably due to different growth conditions of the yeast. As Fig. 2 shows, there is an ALA and 2,2′-bipyridyl dose-dependent PpIX accumulation in the yeast cells. PpIX fluorescence decreases after reaching the threshold of ALA () or 2,2′-bipyridyl concentration (30 mM). The shape of the ALA dose-dependent curve is in agreement with those reported previously for mammalian cells.7 Optimal ALA concentration at which mammalian cells produce the highest intensity of PpIX is different for various cell lines. 7,35,36 As discussed above when yeast cells are grown in the presence of YPD, addition of 2,2′-bipyridyl alone leads to PpIX fluorescence intensity in the yeast cells with no exogenous addition of ALA. In the growth conditions presented here, 2,2′-bipyridyl itself generates a small endogenous PpIX fluorescence intensity [Fig. 3(a)] albeit much smaller than after incubation with ALA and 2,2′-bipyridyl. It is also interesting to note that in the presence of 2,2′-bipyridyl alone there is significantly higher PpIX fluorescence intensity than when in the presence of ALA alone. Finally, although very weak, a detectable signal corresponding to PpIX is observed in the absence of both ALA and 2,2′-bipyridyl [dashed dotted line in Fig. 3(a)]. Fig. 3(a) Fluorescence emission spectra of endogenous porphyrins measured 3 h after the administration of ALA and 1 mM 2,2′-bipyridyl (solid line), 1 mM 2,2′-bipyridyl (dashed line), and ALA (dotted line). The dashed-dotted line illustrates the yeast autofluorescence in the absence of ALA and 2,2′-bipyridyl; (b) Fluorescence emission spectra of endogenous porphyrins measured 3 h after the synchronous administration of ALA and 1 mM 2,2′-bipyridyl (solid line); ALA administration for 1 h, then 1 mM 2,2′-bipyridyl administration (dashed line); 1 mM 2,2′-bipyridyl administration for 1 h then ALA administration (dotted line). The dashed-dotted line illustrates the yeast autofluorescence in the absence of ALA and 2,2′-bipyridyl. See text for further conditions. 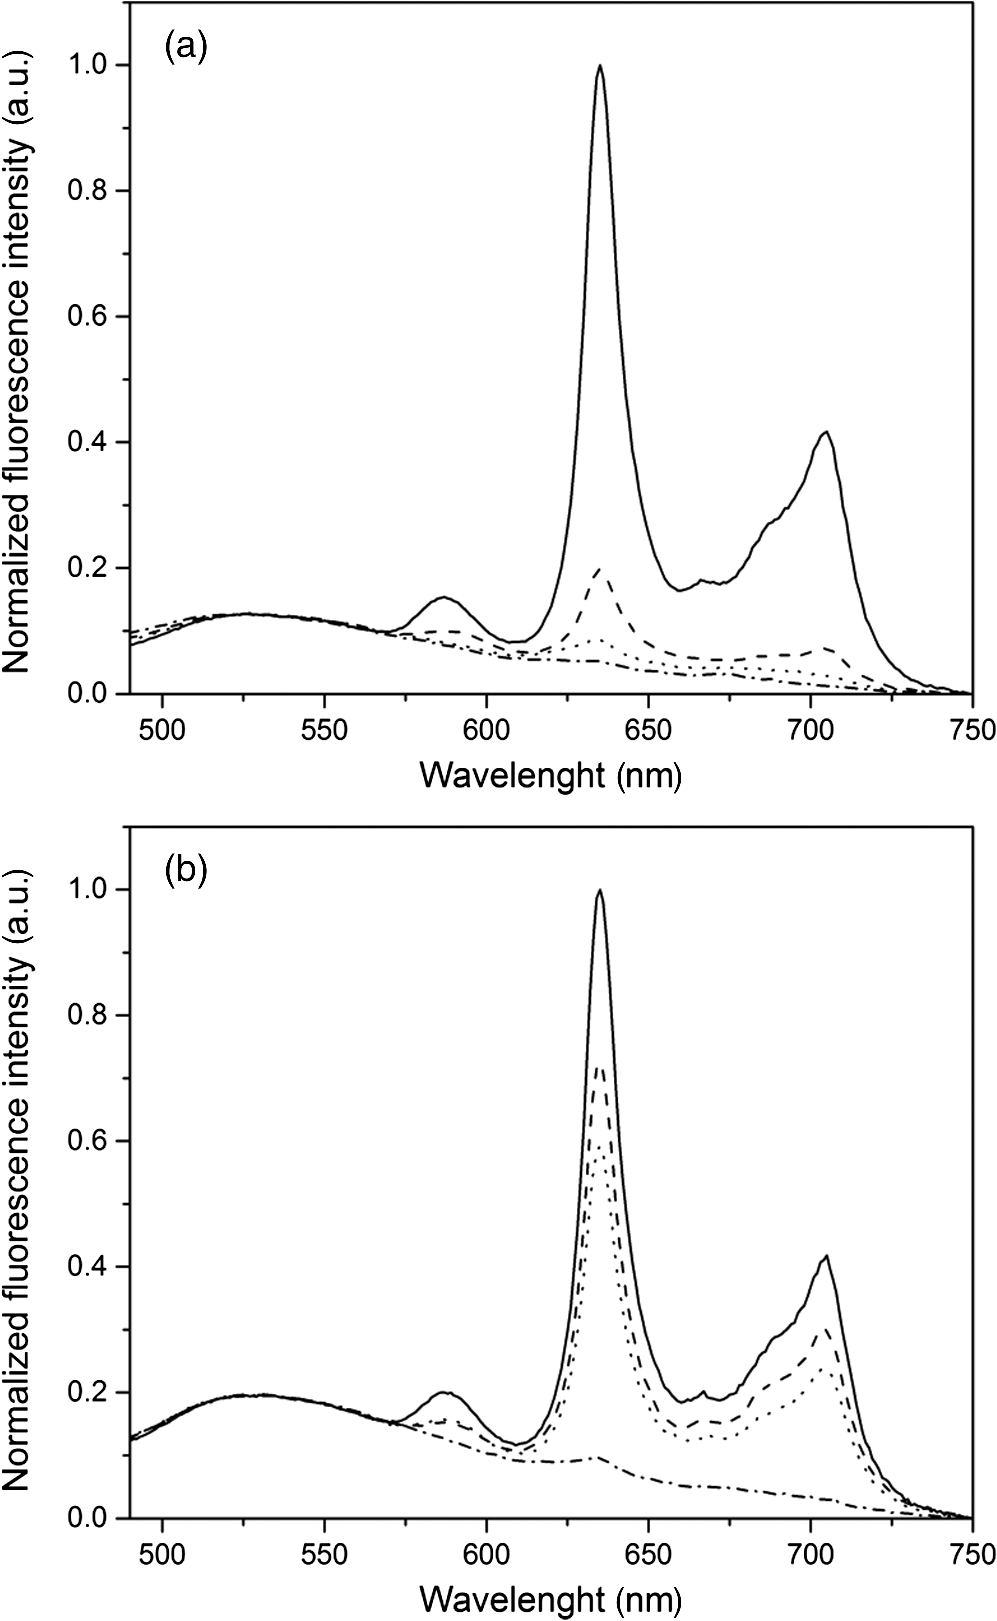 The results presented in Fig. 3(a) demonstrate the strong synergy between ALA and 2,2′-bipyridyl to potentiate the PpIX fluorescence intensity in yeast in the presence of high glucose concentration. Since it cannot be assumed that the internalization and metabolization kinetics of these two compounds are identical, a separate preliminary study was conducted to assess influence of different ALAs and 2,2′-bipyridyl administration on the PpIX fluorescence. Figure 3(b) shows the emission spectra of PpIX fluorescence intensity at various ALA and 2,2′-bipyridyl administration conditions. Surprisingly, it was found that a synchronous administration of ALA () and 2,2′-bipyridyl (1 mM) led to a maximal PpIX fluorescence [Fig. 3(b)]. Incubation of yeast with ALA alone for 1 h with additional 2,2′-bipyridyl administration led to lower PpIX fluorescence. This effect was even lower when yeast cells were first incubated with 2,2′-bipyridyl with following ALA addition. Based on all these results, it was concluded that the optimal conditions leading to maximal endogenous PpIX fluorescence intensity were an incubation of yeast cells for 3 h after synchronous administration of ALA and 1 mM 2,2′-bipyridyl. 3.2.Pharmacokinetics of the PpIX FluorescenceA pharmacokinetics study was carried out to determine how long was PpIX fluorescence present in yeast cells and at what time the highest PpIX fluorescence intensity was reached after ALA and 2,2′-bipyridyl application. Figure 4 shows the curve of the endogenous PpIX fluorescence over time. Fig. 4Pharmacokinetics of the yeast fluorescence at 635 nm after the synchronous administration of ALA () and 2,2′-bipyridyl (1 mM). See text for further conditions. The line is drawn for visual support only. Each point represents the average of three independent measurements, error bars represent the standard deviation of these three independent measurements.  Half the maximal PpIX fluorescence intensity was reached 3 h after ALA and 2,2′-bipyridyl application. The maximal intensity was reached 12 h after ALA and 2,2′-bipyridyl addition and plateaued for . The fluorescence of PpIX then decreased slowly with almost no PpIX present 44 h after ALA and 2,2′-bipyridyl application. This slow decrease may be due to the depletion of glucose in the culture medium and subsequent possible disruption of the yeast cells, which resulted in the leak of PpIX into the solution. Since PpIX is lipophilic, its fluorescence was quenched in the aqueous solution. 3.3.Steady-State and Time-Resolved Fluorescence Spectroscopy of PpIX in Solution or Produced EndogenouslyFigure 5 shows the normalized fluorescence spectrum of 25 nM PpIX dimethyl ester, which was used as a reference to the fluorescence spectrum of PpIX in yeast after 3 h incubation with ALA and 1 mM 2,2′-bipyridyl. Fig. 5Normalized fluorescence spectra of a yeast solution after ALA and 2,2′-bipyridyl administration (solid line), and of PpIX dimethyl ester (25 nM) dissolved in DMSO (dashed line). See text for further conditions.  Fluorescence spectra of PpIX in yeast and PpIX dimethyl ester dissolved in DMSO are similar, with maximum fluorescence intensity at 635 nm for PpIX present in yeast and 632 nm for PpIX dimethyl ester dissolved in DMSO (excitation: 405 nm). The small shift in the fluorescence maximum could be due to environmental/derivation effects.37 It should also be noted that PpIX is not the only porphyrin produced by yeast after ALA and 2,2′-bipyridyl application: coproporphyrin contributes to the fluorescence spectrum with fluorescence maximum at 620 nm.38 Presence of uroporphyrin can be expected as well31 with very similar fluorescence properties to those of coproporphyrin. Nevertheless, the fluorescence lifetime measured in yeasts was very similar () to the fluorescence lifetime of PpIX dimethyl ester in DMSO (). This observation suggests that PpIX produces the most important contribution to the yeast fluorescence in our conditions. The fluorescence spectrum of PpIX in yeast presents a peak at 590 nm. It has been reported that, when ALA is applied to yeast in certain conditions, in particular in combination with iron chelators, it can induce the generation of Zn- and Mg-porphyrins, which present fluorescence maxima at 580 to 605 nm.22–24,31 This effect was consistently observed when iron chelators were coadministered.23 Moreover, it was found that PpIX can be converted to Zn–PpIX.39 However, 2,2′-bipyridyl induces accumulation mainly of PpIX, Zn–PpIX is synthetized enzymatically through Zn–chelatase activity of ferrochelatase.33 Therefore, it can reasonably be hypothesized that the peak which can be observed at 590 nm is due to the endogenous conversion of PpIX to metallo-porphyrins (Zn- and Mg-) and preferential binding of 2,2′-bipyridyl to the bivalent iron. The fluorescence lifetime of Zn-PpIX is in the order of 2.1 ns, as reported in Ref. 40. This value is significantly different than ours () when an excitation wavelength of 405 nm was used. 3.4.Fluorescent Microscopy of the YeastFluorescent microscopy was used to study the mitochondrial membrane potential of yeast in the presence or absence of ALA and 2,2′-bipyridyl (Fig. 6). Yeast cells were stained with Rhodamine 123, a mitochondrial potential-dependent probe. Depolarization of mitochondria induces red spectral shift and intensity quenching of the probe.41–43 Fifteen-hour incubation with ALA and 1 mM 2,2′-bipyridyl did not induce any significant difference in the Rhodamine 123 intensity. In addition, distribution of PpIX in the yeast cells could be observed. PpIX was localized in mitochondria and cytoplasm, which is in agreement with previous descriptions of the PpIX biodistribution.44 The presence of PpIX in mitochondria was confirmed by partial colocalization of PpIX and Rhodamine 123 [Fig. 6(b)]. This observation is of interest since it suggests that the can be determined specifically in this organelle by measuring the PpIX DF lifetime, as described in the following chapter. 3.5.Influence of the on the PpIX Delayed Fluorescence Lifetime in Yeasts and in Solution.The triplet state of the most porphyrin photosensitizers, including endogenous PpIX is quenched by molecular oxygen. Unfortunately, certain porphyrins, such as PpIX, do not emit detectable phosphorescence in vitro or in vivo. Since the inverse intersystem crossing transition takes place between PpIX triplet and singlet states, the measurement of its triplet state’s lifetime can be obtained via the time-resolved detection of its DF. The lifetime of this DF yields information on the surrounding via the Stern–Volmer relationship.12 Endogenous PpIX, which is produced in the mitochondria, can be therefore used as a mitochondrial- probe.25 In order to verify whether these concepts that are well established in mammalian cells are also valid in yeast, the was also measured synchronously with a commercially available thermo-compensated optical oxygen device (Optronix; Oxylab E™; probe: BF/OT/E) where the probe (with tip diameter) was plunged directly into the medium. Measurements were compared with the PpIX DF reciprocal long lifetime obtained in yeast. In Fig. 7, a time series of measurements based on these two approaches were performed during the air bubbling (environmental ) phases. These results indicate that, in our conditions, the consumption of oxygen by yeast is more important than the oxygen delivery due to its limited diffusion and solubilization in the solution. Fig. 7dependence of the PpIX produced endogenously in yeast; comparison between the measured with the Oxylab probe (gray line) and the reciprocal lifetime of the PpIX delayed fluorescence (black line). Inset: correlation between this reciprocal lifetime and the measured with the Oxylab probe. The lines are drawn for visual support only. 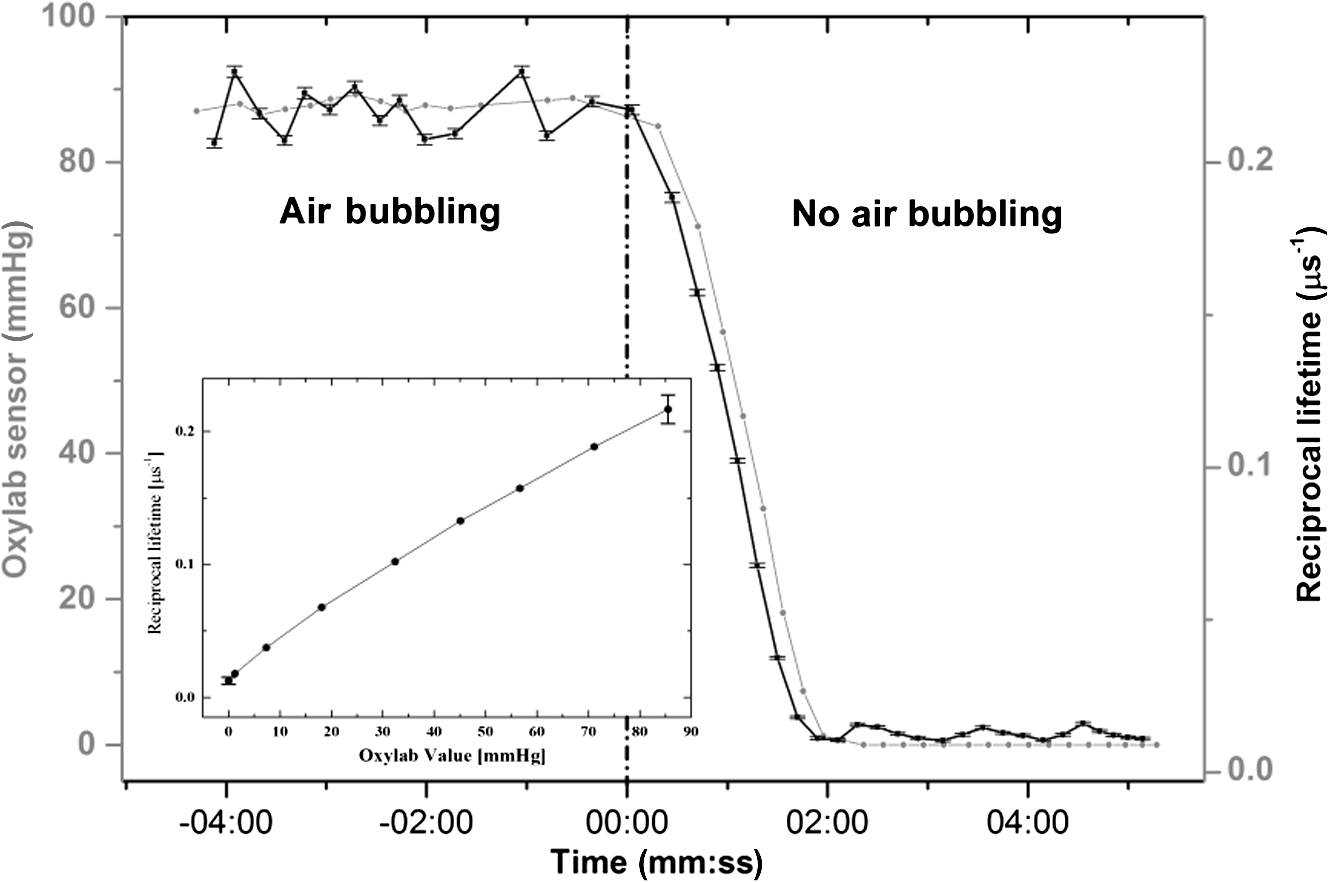 After stopping the air bubbling, yeast depleted the oxygen, which led to hypoxic condition (0 mmHg). As expected, the evolution of the PpIX DF reciprocal lifetime is nicely correlated with the measured with the Oxylab probe. Plotting reciprocal lifetime against values obtained with the Oxylab probe showed a linear correlation (Fig. 7, inset). These measurements enabled to derive the Stern–Volmer quenching constant, as described by Piffaretti et al.13 This derivation resulted in: . The lifetime without oxygen () was determined by purging the residual oxygen with nitrogen bubbling during 5 min. Remaining oxygen traces were removed by the irradiation of the sample ( at 405 nm). was taken when the DF lifetime reached a constant value (). PpIX Stern–Volmer constants reported in the literature differ depending on the calibration protocol and microenvironments. was found to be for HeLa cells and for lung fibroblast cells with around 500 and , respectively.25 The concordance between the values reported by Mik et al. in cells25 and these present values in yeast support the fact that yeast cells produce PpIX and that its microenvironment is similar to that of mammalian cells. A temporal shift of about 10 s is observed between the two curves presented in Fig. 7. This shift can reasonably be assigned to the time response of the Oxylab probe setup since this time is indicated as being “” according to the specifications. This illustrates the advantage of using the PpIX DF to measure the in quasi real time. This approach opens the way to dynamic measurements of the in different tissular and cellular compartments, including mitochondria, to obtain information of fundamental interest regarding their metabolism and respiration. 4.ConclusionOverall, we have established conditions to use Saccharomyces cerevisiae as a reproducible, convenient, and inexpensive model organism to produce PpIX. Because our conditions are characterized by the absence of yeast replication, thus constant , experiments can be performed over several dozen hours. Fluorescence spectroscopy of the endogenous PpIX in yeast resembles that of PpIX in DMSO. In addition, fluorescence lifetime of PpIX in yeast is very similar to that of PpIX in DMSO. This suggests that PpIX is the main fluorescent component produced by yeast after the administration of its precursor in our conditions. The values we have obtained for the Stern–Vollmer constants ( and ) also support the fact that PpIX is endogenously produced in yeast and is responsible for the DF we have observed. Using a yeast model enables focusing on essential mechanisms, without the complexity of a multicellular organism. In addition, such a model is of high interest in PDT and PDD research for optimization and basic mechanistic studies. In particular, a version of this model loaded with appropriate amounts of light absorbing and scattering particles could be used as phantom to mimic tumors containing PpIX, a useful tool to optimize certain cancer photodetection apparatus. AcknowledgmentsThis work was supported by the Swiss National Science Foundation (Grant No. 205320-116556+CR32I3_159746) and funded in part by the J. Jacobi Trust and FP7 EU (CELIM 316310). The authors would like to thank Dr. Katarina Stroffekova and Lenka Koptasikova for providing Rhodamine 123 probe. ReferencesSaccharomyces Genome Database,
“Saccharomyces genome database,”
www.yeastgenome.org/ Google Scholar
J. P. Lasserre et al.,
“Yeast as a system for modeling mitochondrial disease mechanisms and discovering therapies,”
Dis. Models Mech., 8
(6), 509
–526
(2015). http://dx.doi.org/10.1242/dmm.020438 Google Scholar
M. Conrad et al.,
“Nutrient sensing and signaling in the yeast Saccharomyces cerevisiae,”
FEMS Microbiol. Rev., 38
(2), 254
–299
(2014). http://dx.doi.org/10.1111/1574-6976.12065 Google Scholar
D. W. Roberts et al.,
“Glioblastoma multiforme treatment with clinical trials for surgical resection (aminolevulinic acid),”
Neurosurg. Clin. North Am., 23
(3), 371
–377
(2012). http://dx.doi.org/10.1016/j.nec.2012.04.001 Google Scholar
P. J. G. Wagnières et al.,
“Detection of bladder cancer by fluorescence cystoscopy: from bench to bedside—the Hexvix story,”
Handbook of Photomedicine, 411
–426 CRC Press, Taylor & Francis Group, Boca Raton, Florida
(2014). Google Scholar
T. M. Glanzmann et al.,
“Time-resolved autofluorescence spectroscopy of the bronchial mucosa for the detection of early cancer: clinical results,”
Proc. SPIE, 4432 199
(2001). http://dx.doi.org/10.1117/12.447136 Google Scholar
P. Uehlinger et al.,
“5-Aminolevulinic acid and its derivatives: physical chemical properties and protoporphyrin IX formation in cultured cells,”
J. Photochem. Photobiol. B-Biol., 54
(1), 72
–80
(2000). http://dx.doi.org/10.1016/S1011-1344(99)00159-1 Google Scholar
P. Uehlinger et al.,
“In vivo time-resolved spectroscopy of the human bronchial early cancer autofluorescence,”
J. Biomed. Opt., 14
(2), 024011
(2009). http://dx.doi.org/10.1117/1.3088100 Google Scholar
P. Agostinis et al.,
“Photodynamic therapy of cancer: an update,”
CA: Cancer J. Clin., 61
(4), 250
–281
(2011). http://dx.doi.org/10.3322/caac.v61:4 Google Scholar
N. Fotinos et al.,
“5-aminolevulinic acid derivatives in photomedicine: characteristics, application and perspectives,”
Photochem. Photobiol., 82
(4), 994
–1015
(2006). http://dx.doi.org/10.1562/2006-02-03-IR-794 Google Scholar
Q. Peng et al.,
“5-aminolevulinic acid-based photodynamic therapy—clinical research and future challenges,”
Cancer-Am. Cancer Soc., 79
(12), 2282
–2308
(1997). http://dx.doi.org/10.1002/(SICI)1097-0142(19970615)79:12<2282::AID-CNCR2>3.0.CO;2- Google Scholar
F. M. Piffaretti et al.,
“Optical fiber-based setup for in vivo measurement of the delayed fluorescence lifetime of oxygen sensors,”
J. Biomed. Opt., 16
(3), 037005
(2011). http://dx.doi.org/10.1117/1.3558846 Google Scholar
F. Piffaretti et al.,
“Real-time, in vivo measurement of tissular pO(2) through the delayed fluorescence of endogenous protoporphyrin IX during photodynamic therapy,”
J. Biomed. Opt., 17
(11), 115007
(2012). http://dx.doi.org/10.1117/1.JBO.17.11.115007 Google Scholar
J. T. Lathrop and M. P. Timko,
“Regulation by heme of mitochondrial protein-transport through a conserved amino-acid motif,”
Science, 259
(5094), 522
–525
(1993). http://dx.doi.org/10.1126/science.8424176 SCIEAS 0036-8075 Google Scholar
L. Zhang and L. Guarente,
“Heme binds to a short sequence that serves a regulatory function in diverse proteins,”
EMBO J., 14
(2), 313
–320
(1995). EMJODG 0261-4189 Google Scholar
L. Zhang, A. Hach and C. Wang,
“Molecular mechanism governing heme signaling in yeast: a higher-order complex mediates heme regulation of the transcriptional activator HAP1,”
Mol. Cell. Biol., 18
(7), 3819
–3828
(1998). http://dx.doi.org/10.1128/MCB.18.7.3819 Google Scholar
G. Layer et al.,
“Structure and function of enzymes in heme biosynthesis,”
Protein Sci., 19
(6), 1137
–1161
(2010). http://dx.doi.org/10.1002/pro.405 PRCIEI 0961-8368 Google Scholar
J. Mattoon et al.,
“Oxygen and catabolite regulation of hemoprotein biosynthesis in the yeast Saccharomyces cerevisiae,”
Biosynthesis of Heme and Cholorophylls, 421
–435 Academic Press, New York
(1979). Google Scholar
L. Guarente et al.,
“Distinctly regulated tandem upstream activation sites mediate catabolite repression of the CYC1 gene of S-cerevisiae,”
Cell, 36
(2), 503
–511
(1984). http://dx.doi.org/10.1016/0092-8674(84)90243-5 CELLB5 0092-8674 Google Scholar
R. S. Zitomer and C. V. Lowry,
“Regulation of gene-expression by oxygen in saccharomyces-cerevisiae,”
Microbiol. Rev., 56
(1), 1
–11
(1992). Google Scholar
T. Hon et al.,
“A mechanism of oxygen sensing in yeast—multiple oxygen-responsive steps in the heme biosynthetic pathway affect Hap1 activity,”
J. Biol. Chem., 278
(50), 50771
–50780
(2003). http://dx.doi.org/10.1074/jbc.M303677200 Google Scholar
M. G. Strakhovskaya et al.,
“Synthesis of protoporphyrin IX induced by 5-aminolevulinic acid in yeast cells in the presence of 2, 2 ‘-dipyridyl,”
Biochem.-Moscow, 63
(6), 725
–728
(1998). Google Scholar
M. G. Strakhovskaya et al.,
“Endogenous porphyrin accumulation and photosensitization in the yeast Saccharomyces cerevisiae in the presence of 2, 2 ‘-dipyridyl,”
J. Photochem. Photobiol. B: Biol., 49
(1), 18
–22
(1999). http://dx.doi.org/10.1016/S1011-1344(98)00215-2 Google Scholar
P. Uehlinger et al.,
“On the role of iron and one of its chelating agents in the production of protoporphyrin IX generated by 5-aminolevulinic acid and its hexyl ester derivative tested on an epidermal equivalent of human skin,”
Photochem. Photobiol., 82
(4), 1069
–1076
(2006). http://dx.doi.org/10.1562/2005-12-04-RA-745 PHCBAP 0031-8655 Google Scholar
E. G. Mik et al.,
“Mitochondrial PO2 measured by delayed fluorescence of endogenous protoporphyrin IX,”
Nat. Methods, 3
(11), 939
–945
(2006). http://dx.doi.org/10.1038/nmeth940 Google Scholar
N. Shevchenko et al.,
“A high resolution bladder wall map: feasibility study,”
in Annual Int. Conf. of the IEEE Engineering in Medicine and Biology Society (EMBC ‘26),
5761
–5764
(2012). http://dx.doi.org/10.1109/EMBC.2012.6347303 Google Scholar
M. Marois et al.,
“Characterization and standardization of tissue-simulating protoporphyrin IX optical phantoms,”
J. Biomed. Opt., 21
(3), 035003
(2016). http://dx.doi.org/10.1117/1.JBO.21.3.035003 Google Scholar
M. Verhille et al.,
“Modulation of photosensitization processes for an improved targeted photodynamic therapy,”
Curr. Med. Chem., 17
(32), 3925
–3943
(2010). http://dx.doi.org/10.2174/092986710793205453 Google Scholar
A. O. Shumarina et al.,
“Photodynamic damage to yeast subcellular organelles induced by elevated levels of endogenous protoporphyrin IX,”
Microbiology, 72
(4), 434
–437
(2003). http://dx.doi.org/10.1023/A:1025040606056 MIBLAO 0026-2617 Google Scholar
R. M. C. Dawson et al., Data for Biochemical Research, 3rd ed.Clarendon Press, Oxford, United Kingdom
(1989). Google Scholar
P. N. MacDonald, Two-Hybrid Systems: Methods and Protocols, 177 Humana Press, New York
(2001). Google Scholar
R. Labbe-Bois, P. Labbe,
“Tetrapyrrole and heme biosynthesis in the yeast Saccharomyces cerevisiae,”
Biosynthesis of Heme and Chlorophylls, 235
–285 McGraw-Hill, New York
(1990). Google Scholar
K. Berg et al.,
“The influence of iron chelators on the accumulation of protoporphyrin IX in 5-aminolaevulinic acid-treated cells,”
Br. J. Cancer, 74
(5), 688
–697
(1996). http://dx.doi.org/10.1038/bjc.1996.423 Google Scholar
J. Moan et al.,
“Photobleaching of protoporphyrin IX in cells incubated with 5-aminolevulinic acid,”
Int. J. Cancer, 70
(1), 90
–97
(1997). http://dx.doi.org/10.1002/(ISSN)1097-0215 Google Scholar
F. M. Rossi et al.,
“In vitro study on the potential use of 5-aminolevulinic acid mediated photodynamic therapy for gynaecological tumours,”
Br. J. Cancer, 74 881
–887
(1996). http://dx.doi.org/10.1038/bjc.1996.452 BJCAAI 0007-0920 Google Scholar
J. Moan et al.,
“Pharmacology of protoporphyrin IX in nude mice after application of ALA and ALA esters,”
Int. J. Cancer, 103
(1), 132
–135
(2003). http://dx.doi.org/10.1002/(ISSN)1097-0215 Google Scholar
G. Y. Fraikin, M. G. Strakhovskaya and A. B. Rubin,
“The role of membrane-bound porphyrin-type compound as endogenous sensitizer in photodynamic damage to yeast plasma membranes,”
J. Photochem. Photobiol. B-Biol., 34
(2–3), 129
–135
(1996). http://dx.doi.org/10.1016/1011-1344(96)07287-9 Google Scholar
K. Csatorday, R. Maccoll and D. S. Berns,
“Accumulation of protoporphyrin IX and Zn protoporphyrin IX in Cyanidium caldarium,”
Proc. Natl. Acad. Sci. U. S. A., 78
(3), 1700
–1702
(1981). http://dx.doi.org/10.1073/pnas.78.3.1700 Google Scholar
J. Albani and B. Alpert,
“Fluctuation domains in myoglobin—fluorescence quenching studies,”
Eur. J. Biochem., 162
(1), 175
–178
(1987). http://dx.doi.org/10.1111/ejb.1987.162.issue-1 EJBCAI 0014-2956 Google Scholar
R. K. Emaus, R. Grunwald and J. J. Lemasters,
“Rhodamine-123 as a probe of transmembrane potential in isolated rat-liver mitochondria—spectral and metabolic properties,”
Biochim. Biophys. Acta, Bioenerg., 850
(3), 436
–448
(1986). http://dx.doi.org/10.1016/0005-2728(86)90112-X Google Scholar
G. Juan et al.,
“A fast kinetic method for assessing mitochondrial-membrane potential in isolated hepatocytes with rhodamine-123 and flow-cytometry,”
Cytometry, 15
(4), 335
–342
(1994). http://dx.doi.org/10.1002/(ISSN)1097-0320 CYTODQ 0196-4763 Google Scholar
P. Ludovico, F. Sansonetty and M. Corte-Real,
“Assessment of mitochondrial membrane potential in yeast cell populations by flow cytometry,”
Microbiol., 147 3335
–3343
(2001). http://dx.doi.org/10.1099/00221287-147-12-3335 Google Scholar
R. S. Ajioka, J. D. Phillips and J. P. Kushner,
“Biosynthesis of heme in mammals,”
Biochim. Biophys. Acta, Mol. Cell Res., 1763
(7), 723
–736
(2006). http://dx.doi.org/10.1016/j.bbamcr.2006.05.005 Google Scholar
BiographyJaroslava Joniova obtained her double PhD degree in biophysics in 2014 from University of Pavol Jozef Safarik (Kosice, Slovakia) and Université Pierre et Marie Curie, Paris, France. She is currently performing a postdoc at the Swiss Federal Institute of Technology in Lausanne (EPFL), in the field of biomedical optics. Her research involves development and characterization of optical phantoms used for cancer detection, photobiomodulation and optical spectroscopy of photosensitizers. Emmanuel Gerelli obtained his PhD in physics (nano-optics) in 2012 from the Institute of Nanotechnology, Lyon, France. He is currently performing a postdoc at the Swiss Federal Institute of Technology in Lausanne (EPFL), in the field of biomedical optics. His research interests focus on in vivo measurements of tissue oxygen concentration by time-resolved luminescence spectroscopy and imaging; photobiomodulation; tissue characterization based on the imaging of the protoporphyrin IX fluorescence; optical spectroscopy of photosensitizers and fluorochromes. Georges Wagnières obtained his PhD in physics from the Swiss Federal Institute of Technology at Lausanne (EPFL) in 1992 and did a postdoc in the Wellman Laboratories of Photomedicine, Boston, from 1993 to 1994. He obtained a master's degree in management of technology in 2001. He has led a group active in biomedical optics at EPFL since 1994. He has authored more than 220 papers (130 peer-reviewed) and filed 15 patents. |


