
|
|
1.IntroductionThe structure of the vasculature in vertebrates is critical for understanding not only normal development1,2 but also disease processes ranging from cancer2,3 to diabetic retinopathy.4 The ease of genetic manipulation and imaging has made the zebrafish a powerful system for studying the cardiovascular development.5–8 In such studies, the structure of the forming vasculature is highlighted by exogenous labels, such as injected fluorescent dyes9,10 or nanoparticles11–13 that can be imaged by fluorescence microscopy; alternatively, the green fluorescent protein (GFP) can be expressed in the vascular endothelium of transgenic zebrafish to permit high-resolution imaging of the vasculature using confocal laser scanning microscopy.7,8,14 Similar approaches have been used in a variety of experimental animal systems and have even been extended to humans in the form of fluorescein angiography15,16 or indocyanine green angiography.17,18 As powerful as these approaches have been, their requirements for the introduction of an exogenous agent or the expression of a foreign gene are major restrictions. What is needed is a means for imaging microvascular anatomy and functional blood flow without injection of exogenous dyes/particles or genetic manipulation of biological samples. Recent advancements in optical coherence tomography (OCT) technologies have enabled the reflected infrared light to offer far more than conventional structural images. A number of approaches for flow sensitized OCT have been developed, using changes in the intensity of the reflected light,19,20 in its phase,21 or in both22,23 to define locations of blood flow. These OCT angiography techniques can generate label-free images of the vasculature in a variety of settings, ranging from the vasculature in the mouse brain24,25 to the vessels in the human eye26,27 and skin.28,29 Because phase can be measured to higher precision than intensity,21,30,31 we have been refining phase variance optical coherence tomography (pvOCT) as a noninvasive method for determining the three-dimensional (3-D) perfusion map and morphology of retinal vasculature, which is proving useful in studies of age-related macular degeneration and diabetic retinopathy.26,32–34 To image the smallest features of the microvasculature without the need for exogenous labels, we have extended our previous OCT imaging to optical coherence microscopy (OCM). OCM combines the coherence-gated depth discrimination of OCT with the high lateral resolution of confocal microscopy, offering an excellent balance among transverse resolution, axial resolution, and imaging depth.35,36 In imaging the developing vasculature, OCM is required because the vasculature involves features that are smaller than the resolution of conventional OCT (5 to ). We have implemented phase variance optical coherence microscopy (pvOCM) using the temporal variance of the phase in spectral-domain optical coherence microscopy (SD-OCM) signals to provide label-free imaging of the microvasculature in developing zebrafish embryos. This new pvOCM imaging system permits 3-D imaging at more than twice the resolution than our previous system designed for animal study,21 allowing detailed identification of the full microvascular network in small animals. Direct comparisons with fluorescence microscopy of GFP-labeled transgenic animals confirmed pvOCM images, demonstrating that pvOCM is ready to be applied for label-free vascular imaging of other systems. To achieve optimal OCM imaging performance, we have developed an approach for mounting the sample that reduces both the specular reflections from the bottom glass and the mirror term of mountant scattering. Together, these improvements make it possible for biologists and nonexperts in OCM to transition from confocal microscopy to OCM imaging. 2.Methods2.1.Imaging Setup and CharacterizationThe schematic diagram of the SD-OCM system is shown in Fig. 1.37 A broadband superluminescent diode (SLD); T-850-HP, Superlum with a bandwidth of 170 nm and a center wavelength of 845 nm was used as the light source. The actual system bandwidth was reduced to (780 to 870 nm, ) due to the imperfect optics and limited spectral coverage of optical components in the system. In the sample arm, a pair of galvanometer mirrors (8315 K, Cambridge Technology) performed two-dimensional lateral scanning. An objective lens with magnification (LSM02-BB, Thorlabs) focused the light onto the sample. The back aperture of the objective was underfilled, with an effective numerical aperture of 0.11. In the reference arm, a dispersion compensation block (LSM02DC, Thorlabs) matched the dispersion of the objective lens. Polarization controllers in the SLD arm, sample arm, and reference arm were used to optimize the sensitivity of the system. A custom LabVIEW (National Instruments) program controlled the galvanometer scanners and data acquisition from the spectrometer. Fig. 1Schematic diagram of the SD-OCM system for small animal imaging. SLD, superluminescent diode; ISO, isolator; DC, dispersion component.  Backscattered light from the sample arm and reference arm generated interference spectra that were detected by a custom-built spectrometer. The spectrometer data were transferred to the computer through a frame grabber (PCIe-1433, National Instruments). The custom-built spectrometer consisted of a collimating lens (), a volume phase holographic transmission grating (1002-2, Wasatch Photonics), a focusing lens (), and a line scan complementary metal-oxide-semiconductor (CMOS) camera (spL4096-140km, Basler). It was calibrated to determine the wavelength distribution on CMOS pixels. A calibration approach was developed, which combined methods of using spectral phase difference from single-layer reflections38–40 and the spectrum of the light source provided by the manufacturer. This calibration approach was cost-effective, as it did not require extra instruments, such as fiber Bragg gratings and narrowband light sources. The lateral resolution of the system was measured by imaging a United States Air Force (USAF) resolution target (R1DS1P, Thorlabs) in water. In Fig. 2(a), line intensity profiles of elements in group 7 show that the smallest full width at half maximum (FWHM) that was resolved by the SD-OCM system was in element 4 (blue dashed box), which has a line width of . This is the measured lateral resolution in agreement with the theoretical focal spot size of . Fig. 2Characterization of the SD-OCM system. (a) Measurement of the lateral resolution by imaging a USAF resolution target in water. Line intensity profiles over the red dashed line area show that the smallest lines clearly resolvable are in element 4 of group 7, which have the widths of . Scale bars: . (b) Measurement of the axial resolution by determining the width of the axial PSF in water. The FWHM of the axial PSF at a depth of is . (c) Axial PSFs at various depths show a sensitivity roll-off of across depth.  The axial resolution of the system (also referred to as the axial point spread function; axial PSF) was measured by imaging the reflectivity profile of a mirror reflection in water (index of refraction ). Figure 2(b) shows the axial PSF (axial resolution) at a depth of has an FWHM of , which was close to the theoretical value of calculated from the effective system bandwidth.41 Due to finite spectral resolution and finite pixel size in the spectrometer, the sensitivity of the system decreased as the depth increased. Figure 2(c) shows that the sensitivity roll-off over depth is only , indicating that the spectrometer is suitable for imaging zebrafish embryos that are typically thick. 2.2.Sample PreparationLive zebrafish embryos were collected for in vivo imaging. Adult zebrafish and embryos were raised and maintained as described in the guidance book42 and in strict accordance with the recommendations in the Guide for the Care and Use of Laboratory Animals by the University of Southern California, where the protocol was approved by the Institutional Animal Care and Use Committee (permit number: 12007 USC). The transgenic zebrafish line used in our experiments expressed GFP in its vascular endothelial cells: Tg(kdrl:eGFP). Zebrafish embryos were raised in egg water ( of instant ocean and of CaSO4 in milli-Q water) at 28.5°C in an incubator. Most embryos were imaged at developmental stages of 2 to 5 days postfertilization (dpf), because their vasculature is maturing and undergoing remodeling during these stages.7,8,14 Zebrafish embryos were anesthetized with tricaine (0.02%) so that they stayed stationary during imaging experiments. The area of interest was the fish trunk near the tail because it had rich anatomy and a predictable vasculature for both structural and functional imaging with the SD-OCM system [Fig. 5(a)]. For in vivo imaging with confocal laser scanning microscopy, typically low melting point agarose is used to stabilize zebrafish embryos in place inside glass bottom dishes. To avoid image distortion and accommodate short working distances of objective lenses, thin glass bottom dishes are used (thickness ), and the sample is mounted very near to the glass bottom, as shown in Fig. 3(a). For OCM, mounting of the sample must be adjusted for the best imaging:
2.3.Technique of Phase Variance OCMThe phase variance technique was integrated into our SD-OCM system for imaging the microvasculature in zebrafish embryos. In pvOCM, multiple B-scans taken at the same location over time (BM-scan) were used to calculate the phase variance. Regions of blood flow were distinguished from stationary tissues by larger phase variance (motion contrast). The phase variance is a statistical measure and defined as26,32 where is the number of repeated B-scans within a BM-scan, is the ’th B-scan within a BM-scan, is the phase change, and is the time interval between successive B-scans within a BM-scan, and is the phase value at position () and time within a BM-scan.In our pvOCM imaging experiments, four B-scans were taken for the same position as a BM-scan. The B-scan frame rate was , resulting in a BM-scan rate of . In offline data processing, B-scan images of the intensity and phase were generated following standard SD-OCT processing procedures, including background removal,45 spectra interpolation, numerical dispersion compensation,46 spectral reshaping, zero padding,45 and Fourier transforms. B-scan images of phase variance values were then calculated after the bulk motion was removed. The bulk motion was estimated using weighted mean phase changes between aligned successive B-scans at depths within the sample region,21,47 defined as where is the OCM intensity in linear scale at position (), and the summation is performed over depth that contains the sample region.With bulk motion removed, binary masks based on the structural intensity and median filters (3 pixels laterally and 1 pixel axially) were applied. 3-D en face images of blood flow at multiple depths were created for later visualization. General processing procedures of the pvOCM technique are shown in the flowchart of Fig. 4. 3.Results3.1.Structural and Vascular ImagingIn SD-OCM imaging experiments, the system acquired a 3-D volume of B-scan images, or cross-sectional images, as shown in Fig. 5(d). The scan direction within each B-scan was parallel to the zebrafish trunk; each B-scan image contains 800 A-scans spanning a distance of 1.20 mm. En face intensity images were created at multiple depths via average intensity projection of depths from the volumetric set of imaging data to provide a lateral view of the zebrafish structure, as shown in Fig. 5(e). En face images clearly identified the structure of the somites, notochord, spinal cord, yolk, and gut. The aorta and cardinal vein were also resolved. Images of zebrafish embryos were taken with a bright-field microscope (MVX10, Olympus), with a representative image shown in Fig. 5(b). Such bright-field microscopic images served as references for OCM structural images. Fig. 5Structural and vascular imaging of zebrafish embryos. (a) Composite wide-field microscopic image of a 3--dpf zebrafish embryo: Tg(kdrl:eGFP). The red dashed box marks the trunk area of interest for SD-OCM imaging. (b) Bright-field microscopic image of the structure of a 3-dpf zebrafish trunk. (c) Fluorescence microscopic image of the GFP-labeled vascular endothelium in the trunk. (d) OCM B-scan intensity images at roughly the same area. The yellow dashed line represents one example plane for creating an en face image. (e) En face OCM intensity images at various depth layers. (f) En face pvOCM images of the vasculature at various depth layers. In both (e) and (f), each en face image was created from average intensity projection of depth and spanned an area of . The depth was relative to the top surface of the zebrafish trunk. Scale bars: . 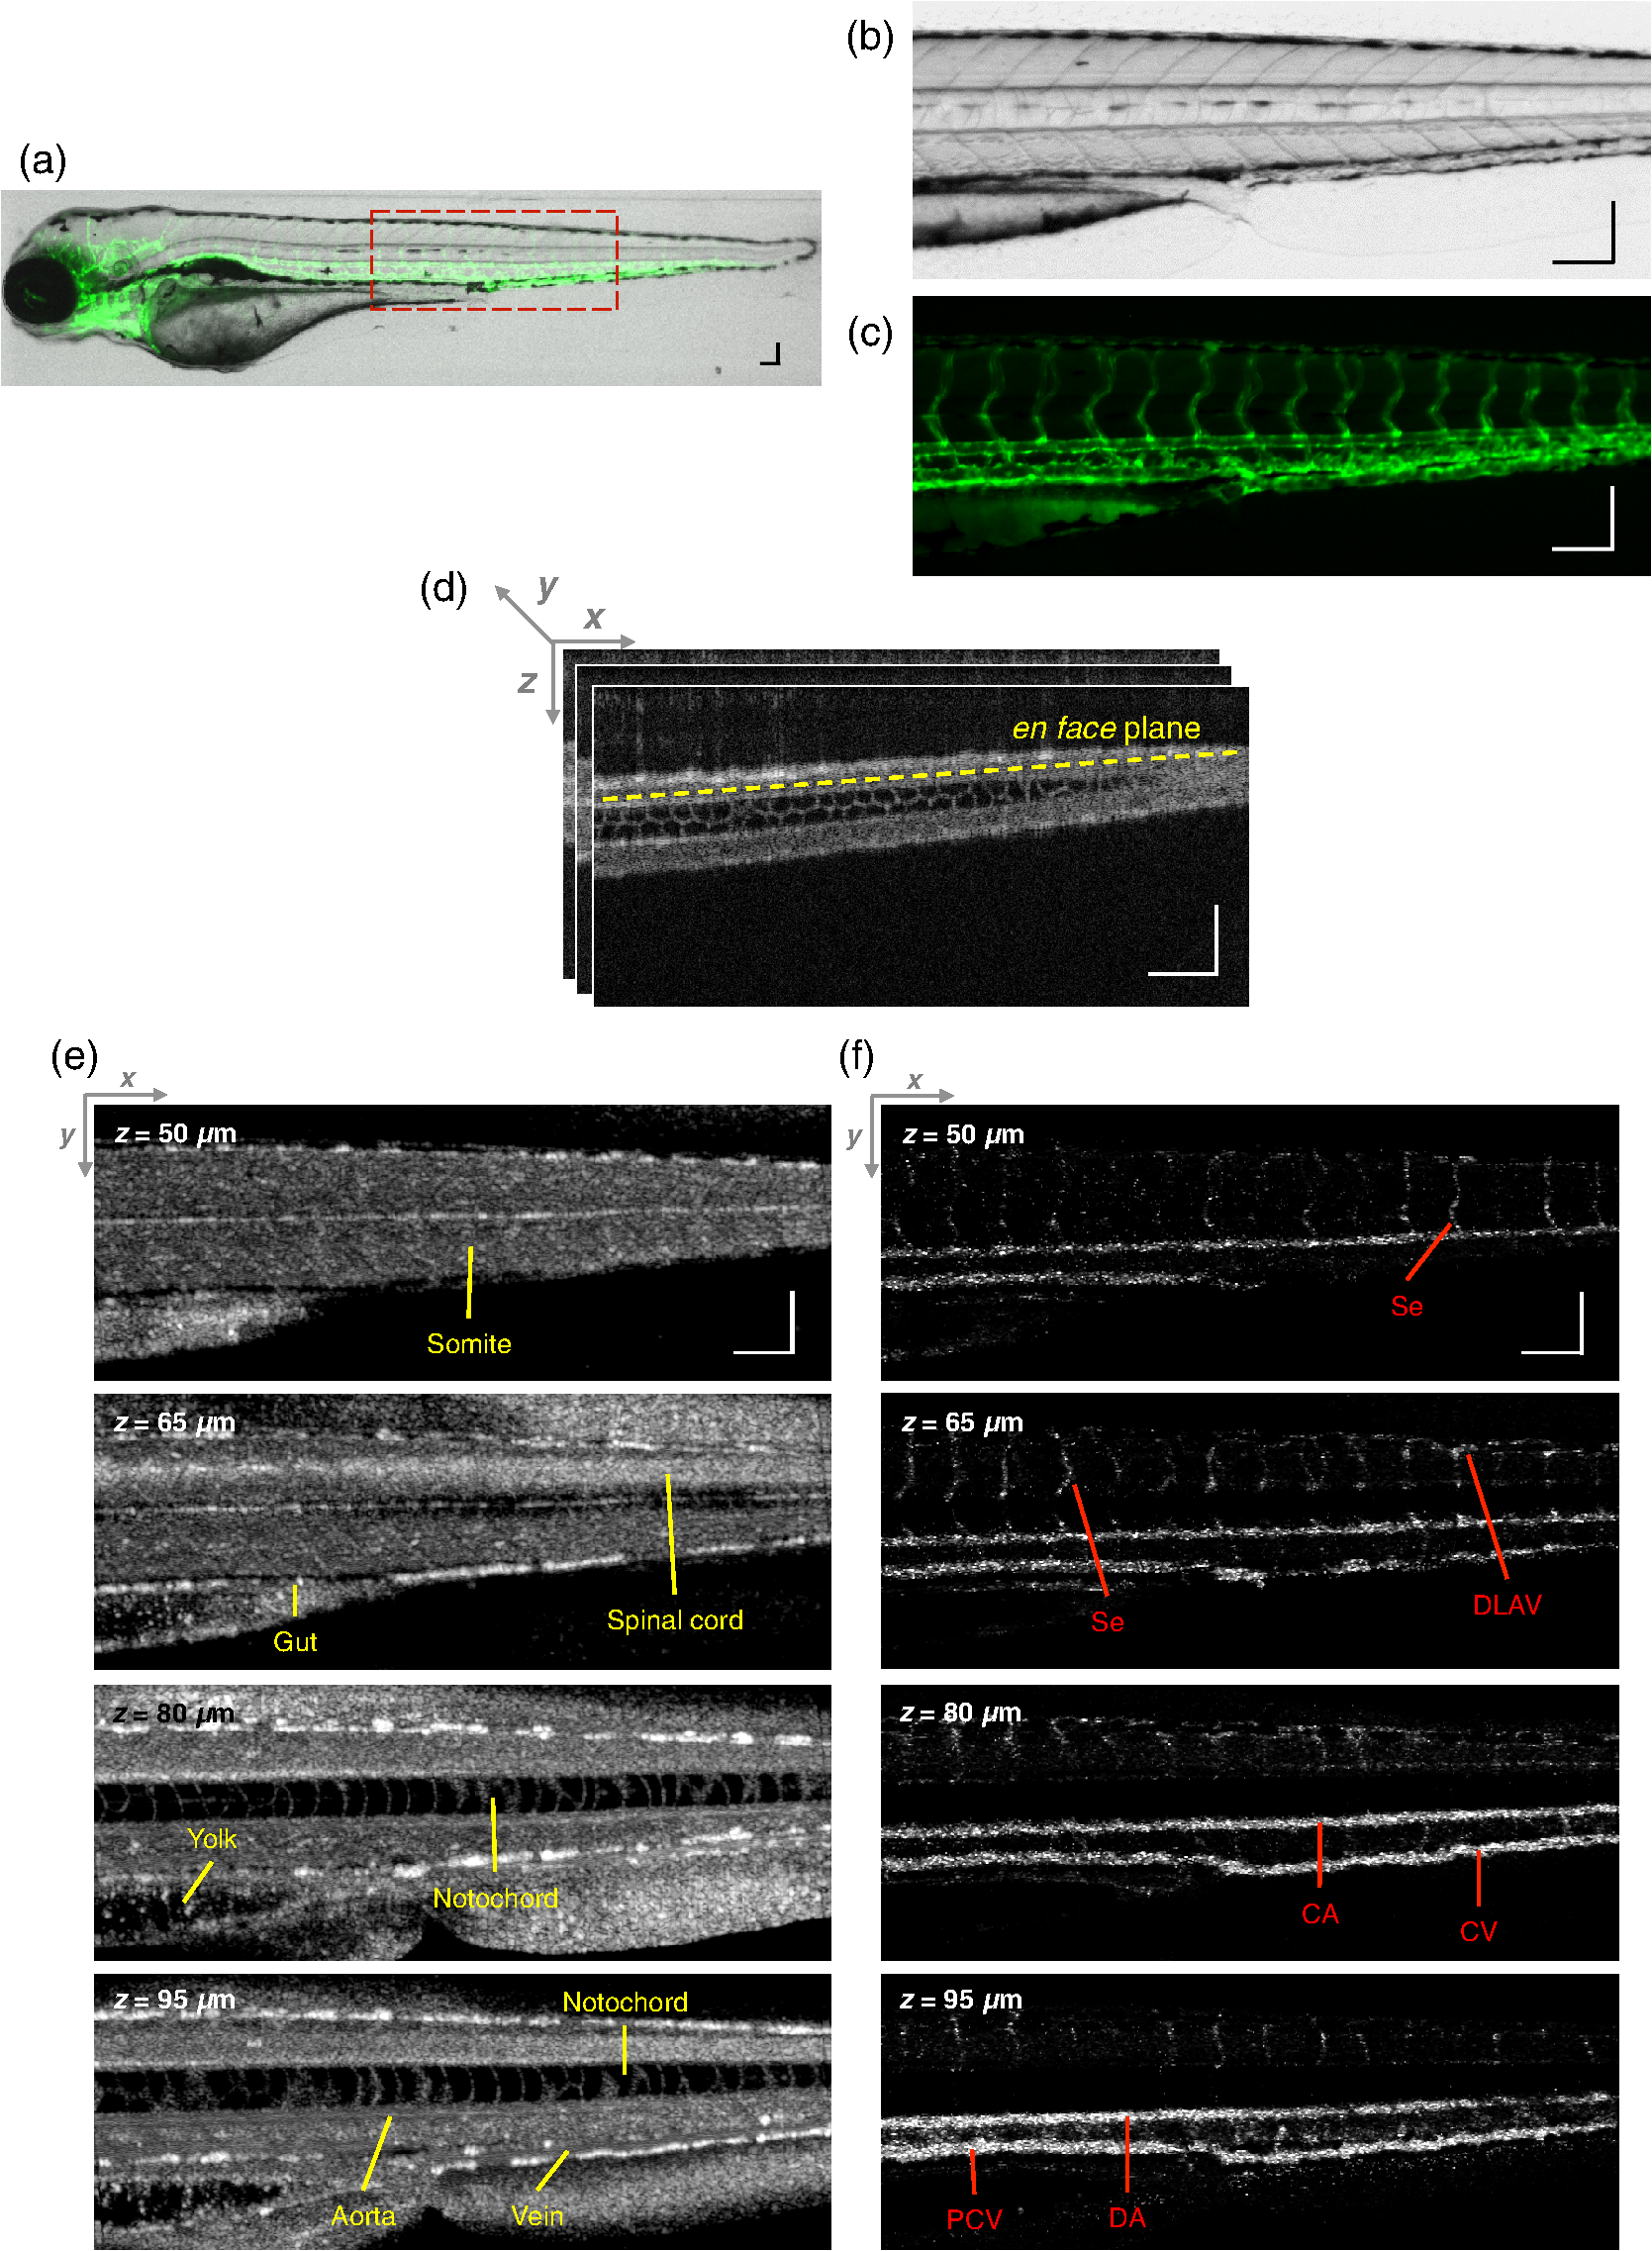 Imaging of the vasculature in zebrafish embryos was implemented by the pvOCM technique, and en face pvOCM images were created at multiple depths, by averaging the intensity from slabs within the volumetric data set, as shown in Fig. 5(f). The intersegmental vessels (Se), dorsal aorta (DA), caudal artery (CA), posterior cardinal vein (PCV), caudal vein (CV), and dorsal longitudinal anastomotic vessel (DLAV) were clearly visualized in these datasets. Fluorescence images of the GFP-labeled vasculature were taken with a wide-field fluorescence microscope (MVX10, Olympus) for comparison, with a representative image shown in Fig. 5(c). 3.2.Visualization of the Vascular NetworkTo visualize the vasculature at all depths of the sample in a single image, en face projection pvOCM image was created via average intensity projection over depths ranging from 30 to below the top surface of the zebrafish trunk, as shown in Fig. 6(a). Features present in the projection pvOCM image corresponded well to the vasculature image obtained by fluorescence microscopy shown in Fig. 5(c). Color coding of the rendering, based on depth, reveals the 3-D organization of the microvascular network, as shown in Fig. 6(b). The vasculature on the ipsilateral half of the embryo (closer to the objective lens in the experiment, depths 30 to ) was coded as green, and the vasculature on the contralateral half of the embryo (further away from the objective lens in the experiment, depths 100 to ) was coded as red. This is especially helpful for distinguishing the intersegmental vessels (Se) on two sides of the embryo. Interestingly, in some segments (white arrows), Se blood flow was detected by pvOCM only on one side of the embryo. Such differences in the flow did not follow a fixed pattern, reminiscent of the randomness of the arterial–venous identity of the Se along the trunk of zebrafish embryos.7 These differences in blood flow may result from the Se remodeling process because some Se had not yet formed functional connections with the CA and CV.14 If an Se had no blood flow, it would not be visualized in pvOCM images. Fig. 6Visualization of the microvascular network by pvOCM. (a) Projection pvOCM image, created by average intensity projection over the depth range of 30 to below the top surface of the zebrafish trunk. (b) Depth color-coded projection pvOCM image, with green denoting the vasculature on the ipsilateral half and red denoting the vasculature on the contralateral half of the embryo. (b’) Sagittal views of pvOCM images are shown for two white dashed box areas in (b). White arrows mark projection artifacts below strong flow regions of the aorta and vein. Scale bars: . 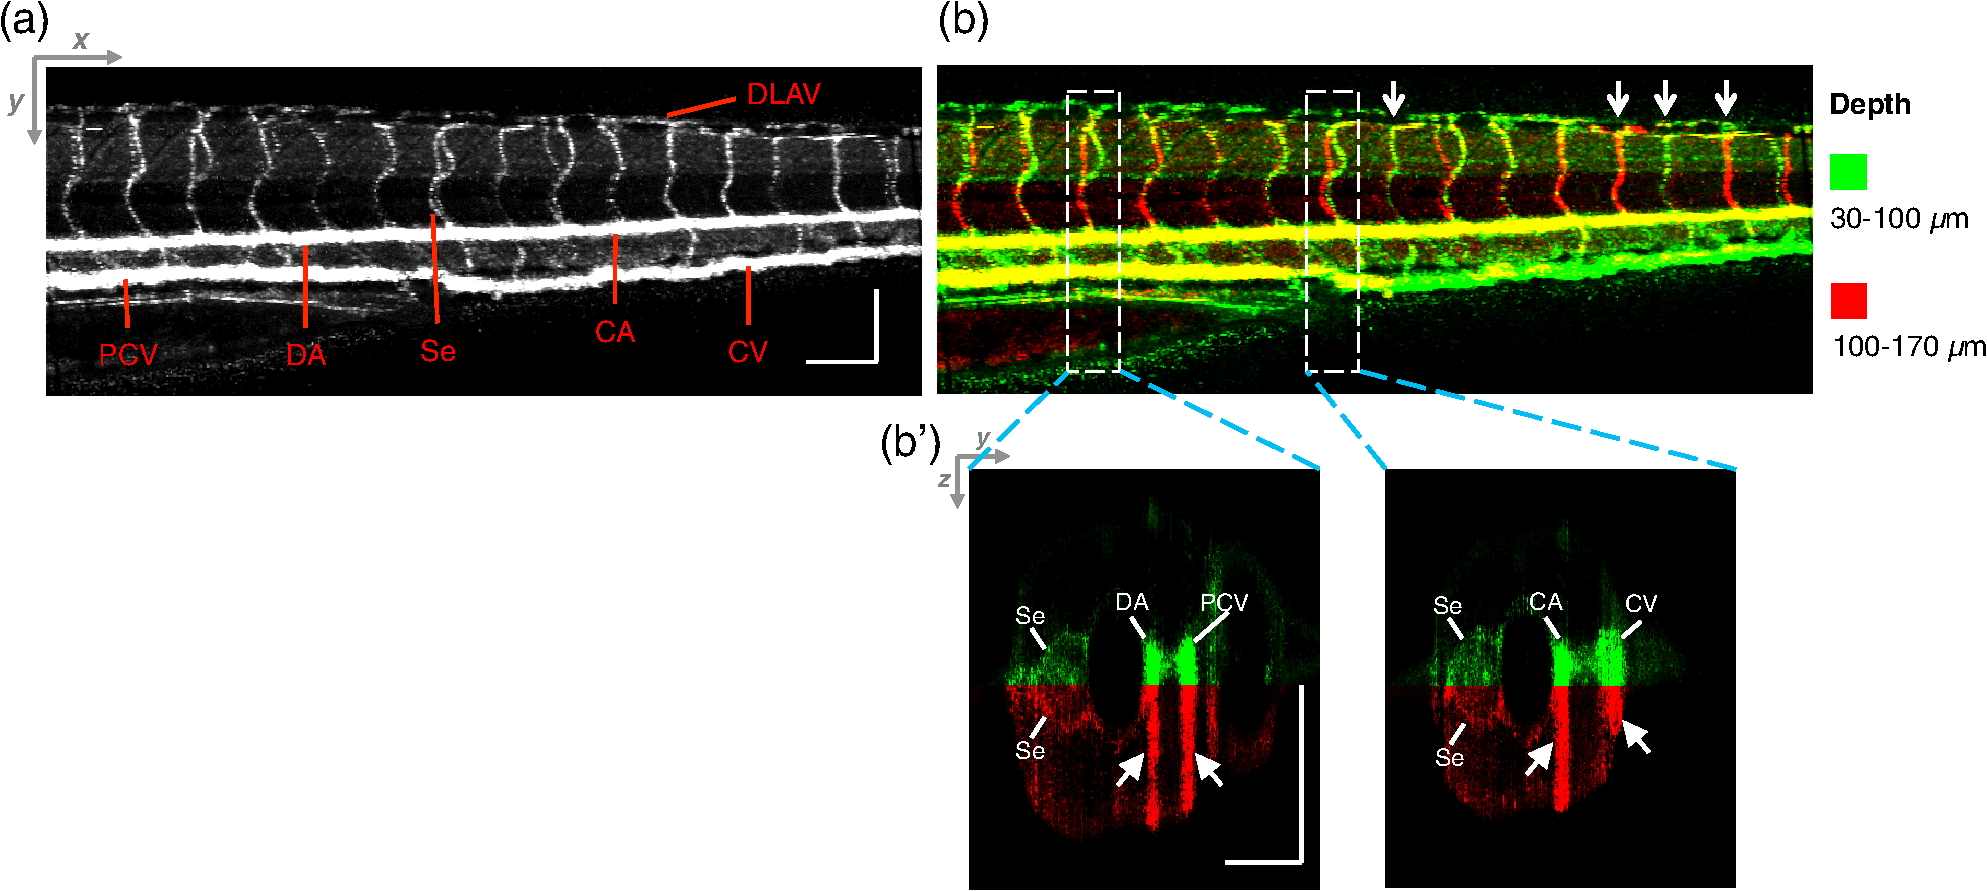 In Fig. 6(b), sagittal views of pvOCM images at selected white dashed box areas display high-phase variance contrast that corresponds to major vessels, the DA, PCV, CA, and CV. Note that there are inevitable projection artifacts, marked by white arrows (depths ). These artifacts resulted from the large phase variance of overlying regions of strong flow in the aorta and veins.21,32,33 Artifacts in regions outside of sample areas were removed by applying binary masks according to the procedure shown in Fig. 4. In Fig. 6(b), projection artifacts made the depth color-coded blood flow of the aorta and vein (DA, CA, and PCV) have a mix of green and red colors that appears to be yellow. These vessels appear as if they covered the entire contralateral half of the embryo. 3.3.Imaging the Developing Vascular SystemImages of the developing vascular system were taken using the pvOCM technique at a range of developmental stages (2 to 5 dpf; Fig. 7). The pvOCM images were compared with corresponding fluorescence microscopic images of the GFP-labeled vascular endothelial cells. These projection pvOCM images provide both anatomical and functional information on vasculature, which is important in the study of vascular development. Fig. 7pvOCM images of the developing vascular system. Projection pvOCM images of zebrafish embryos at developmental stages of (a) 2 dpf, (b) 3 dpf, (c) 4 dpf, and (d) 5 dpf. All images were created by average intensity projection over entire depths across samples. Corresponding fluorescence microscopic images are shown on the right column for comparison. Yellow dashed boxes represent areas for analysis in Fig. 8. Scale bars: .  Regional differences in the phase variance contrast values suggest that not all vessels present in embryos had the same magnitude of flow. Enlarged views in Fig. 8 highlight some bright regions in fluorescence images of the vasculature with little or no pvOCM contrast (red arrows). The absence of phase variance signals in these regions suggests that there were regions of the vasculature with little or no blood flow, offering valuable functional information that is unavailable in fluorescence images of labeled endothelial cells. In addition, in some small regions, the absence of phase variance signal was an artifact of the pulsatile nature of blood flow. Given that the BM-scan rate () was much faster than the heart rate () of a zebrafish embryo, some BM-scans should be recorded during the phase of peak blood flow (resulting in high-phase variance), whereas the others were recorded at the phase of slowest blood flow (resulting in low or no phase variance). This is responsible for the flow that appears to be discontinuous in some Se (yellow asterisks, Fig. 7), in which there are alternating regions of high and low/no phase variance contrast along the same vessel. Furthermore, in the smallest vessels, a discontinuous pvOCM signal could correspond to locations of individual blood cells since the majority of reflections that contributed to the phase variance contrast came from the highly reflective blood cells and not the plasma. Fig. 8Enlarged views of pvOCM images of developing zebrafish embryos, corresponding to yellow dashed box areas in (a–d) of Fig. 7. Red arrows highlight some parts of the vasculature that appear in fluorescent images but are absent in pvOCM images. The absence of phase variance signals is related to the pulsatile nature of blood flow. Blue arrows highlight veins that had no blood flow detected after vascular junctions that are denoted by yellow arrows. Scale bars: . 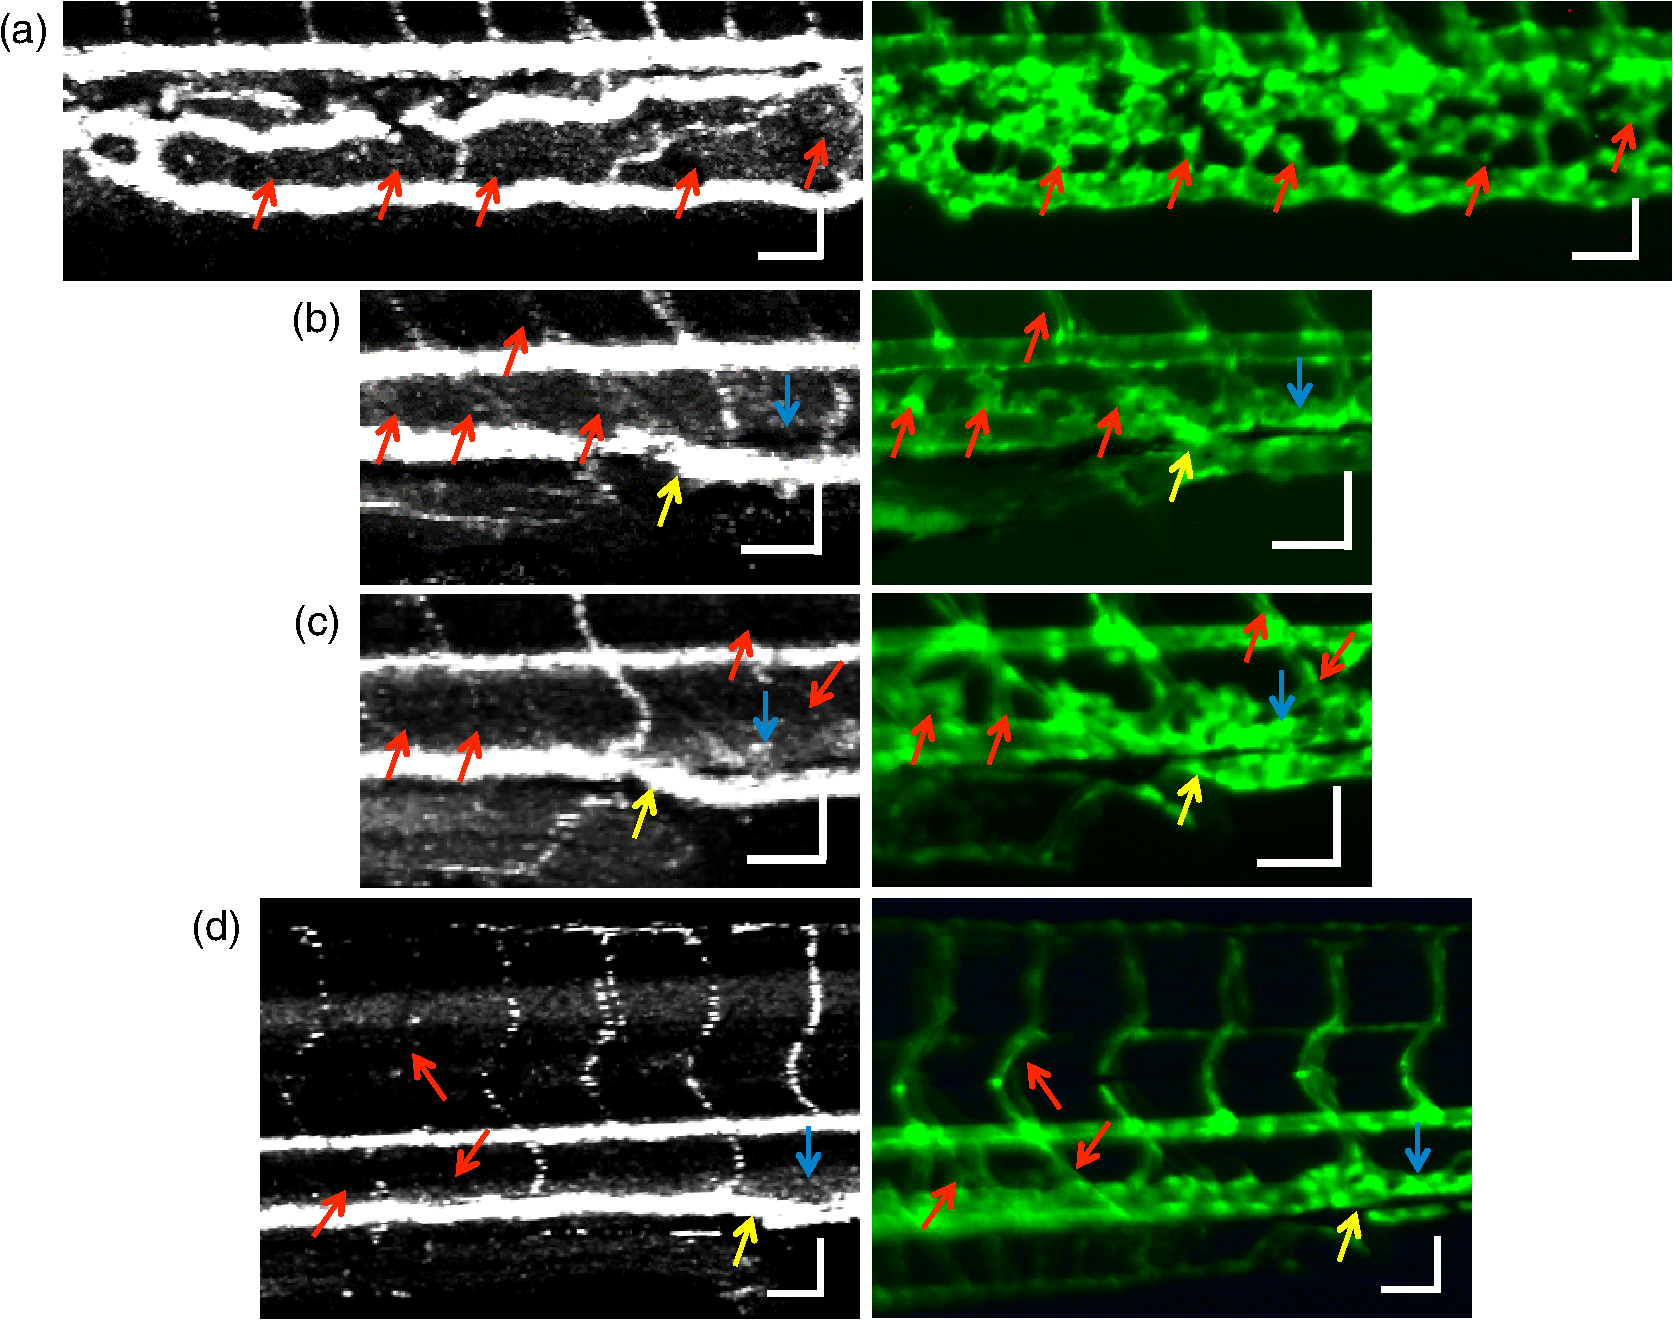 Remodeling processes were observed by pvOCM as shown in Figs. 8(b)–8(d). At some vascular junctions (yellow arrows), one path of the bifurcation had blood flow, whereas the other path (blue arrows) did not. This suggests that at these developmental stages remodeling processes were occurring in CV areas, where one of the veins (blue arrows) was not functional for blood circulation. In these areas, the blood flow circulated only through the more ventral veins that would eventually develop into CV. 4.DiscussionThis paper presents a pvOCM system for label-free imaging of the microvasculature in developing zebrafish embryos with better than resolution (both axial and lateral) and more than imaging depth. The temporal variance in the phase of SD-OCM signals generated by the motion of blood flow permits the pvOCM system to image the microvasculature without relying on any exogenous label. This combination of good resolution, large field of view, and good penetration depth is well suited to studies of the fine structure of tissue and the vasculature in zebrafish embryos. This pvOCM system achieved comparable or better results than the conventional fluorescence microscopy in detecting the vascular structure. More importantly, pvOCM is a functional imaging technique that provides meaningful physiological information that is complementary to regular structural imaging approaches. One potential limitation of pvOCM is that the motion contrast becomes smaller in regions of very slow flow or at periods in the cardiac cycle when there is little or no flow. For example, in Figs. 7 and 8, there are notable regions of low or missing contrast in pvOCM images of Se areas. By lowering the BM-scan rate or by increasing the number of B-scans per BM-scan, we could improve pvOCM detection. Although these approaches raise the chance of detecting slowly moving blood cells, they are not without their own complications, including an increased sensitivity to the phase noise from the sample motion or ambient vibrations during longer acquisition time. Moreover, the imaging speed will be sacrificed. An alternative solution to regions of missing or reduced motion contrast is to combine data from sequential pvOCM scans without synchronizing them to the heartbeat.48 Figure 9 shows two pvOCM images acquired sequentially over exactly the same trunk area, separated in time by . Red arrows mark locations that have the phase variance contrast in one image but not the other, validating our speculation that the missing contrast was caused by the intrinsic pulsatile nature of blood flow. Combining data from two or more pvOCM images (either a maximum or an average value rendering for each pixel in the images) resulted in a more complete rendering of the blood flow. Fig. 9Combination of two pvOCM images of a 2-dpf zebrafish embryo acquired sequentially over the same area, separated in time by . Red arrows mark locations of the phase variance contrast appearing in one image but not the other. The combined image was generated by choosing either the maximum or the mean value for each corresponding pixel in these two images. Scale bars: .  The other limitation of pvOCM is that images of blood flow suffer from projection artifacts. For example, in Fig. 6(b’), there is false duplicated contrast of the flow beneath DA and PCV, which can lead to inaccurate interpretation of the 3-D microvascular network. In retinal OCT angiography, different methods were proposed to suppress such artifacts. In some commercial OCT systems, a slab-subtraction algorithm subtracts the vascular pattern of a top layer (e.g., inner retinal slab) from the bottom layer (e.g., outer retinal slab) that has projection artifacts.49,50 People also implemented a method of step-down exponential filtering to attenuate the magnitude of flow signals below the overlying vasculature.51 Recently, a projection-resolved algorithm was developed based on the observation that signals of projection artifacts were weaker than real flow signals in most situations.50 However, none of these approaches fully removed projection artifacts in our pvOCM images without introducing other artifacts, as shown in Fig. 10. Although the slab-subtraction algorithm [Fig. 10(b)] and step-down exponential filtering [Fig. 10(c)] strongly reduced projection artifacts [yellow arrows, Fig. 10(a)], signals of Se in the bottom were also decreased. Moreover, some regions of noise [yellow dashed boxes, Figs. 10(b) and 10(c)] were amplified since they were not attenuated accordingly. The projection-resolved algorithm [Fig. 10(d)] worked better as it kept most signals from the Se and reduced the noise [yellow dashed box, Fig. 10(d)]. However, the visualization of DA and PCV was still not perfect and their images appear to be asymmetric in depth because the algorithm underrepresented weaker signals from the far side of vessels [blue arrows, Fig. 10(d)]. Therefore, approaches that can better suppress projection artifacts and take into account both strong and weak signals of blood flow in embryos are needed in the future. Fig. 10Suppression of projection artifacts in (a) the sagittal view of the pvOCM image of a 3-dpf zebrafish embryo, using methods of (b) slab-subtraction algorithm, (c) step-down exponential filtering, and (d) projection-resolved algorithm. Yellow arrows mark projection artifacts beneath flow regions of DA and PCV. Blue arrows mark underrepresented weaker signals from the far side of vessels. Yellow dashed boxes denote a region of phase variance noise. Scale bars: .  5.ConclusionWe have demonstrated a high-resolution SD-OCM system for label-free and live 3-D imaging, employing zebrafish embryos as a model organism. This system was capable of capturing the detailed anatomical structure of zebrafish embryos across large depths and wide areas, almost sufficient to capture samples in their entirety. Label-free imaging of blood flow in the arteries, veins, and capillaries was achieved with the pvOCM technique, detecting not only the vascular structure that corresponded to fluorescence microscopic images but also the functional information on blood flow. Because phase variance contrast-based images detected blood flow that was absent in morphological images from conventional light microscopy, our pvOCM technology has established a powerful functional approach for studying the vascular development in zebrafish embryos and possibly other settings in the basic and clinical research. DisclosuresY. C. and L. A. T. declared no conflicts of interests, financial or otherwise. J. F. and S. E. F. have financial interests in Varocto, Inc., which, however, did not support this work. AcknowledgmentsThis work was funded by the Translational Imaging Center and the Alfred Mann Institute for Biomedical Engineering at the University of Southern California. We thank Matt Jones for helpful discussions and Colleen Paquette and Marcela Artiga for zebrafish care. ReferencesG. Oliver,
“Lymphatic vasculature development,”
Nat. Rev. Immunol., 4
(1), 35
–45
(2004). http://dx.doi.org/10.1038/nri1258 NRIABX 1474-1733 Google Scholar
K. Alitalo, T. Tammela and T. V. Petrova,
“Lymphangiogenesis in development and human disease,”
Nature, 438
(7070), 946
–953
(2005). http://dx.doi.org/10.1038/nature04480 Google Scholar
S. Bao et al.,
“Stem cell-like glioma cells promote tumor angiogenesis through vascular endothelial growth factor,”
Cancer Res., 66
(16), 7843
–7848
(2006). http://dx.doi.org/10.1158/0008-5472.CAN-06-1010 Google Scholar
T. W. Gardner et al.,
“Diabetic retinopathy: more than meets the eye,”
Surv. Ophthalmol., 47
(Suppl. 2), S253
–S262
(2002). http://dx.doi.org/10.1016/S0039-6257(02)00387-9 SUOPAD 0039-6257 Google Scholar
D. Y. Stainier,
“Zebrafish genetics and vertebrate heart formation,”
Nat. Rev. Genet., 2
(1), 39
–48
(2001). http://dx.doi.org/10.1038/35047564 1471-0056 Google Scholar
S. W. Jin et al.,
“Cellular and molecular analyses of vascular tube and lumen formation in zebrafish,”
Development, 132
(23), 5199
–5209
(2005). http://dx.doi.org/10.1242/dev.02087 Google Scholar
S. Isogai, M. Horiguchi and B. M. Weinstein,
“The vascular anatomy of the developing zebrafish: an atlas of embryonic and early larval development,”
Dev. Biol., 230 278
–301
(2001). http://dx.doi.org/10.1006/dbio.2000.9995 DEBIAO 0012-1606 Google Scholar
A. V. Gore et al.,
“Vascular development in the zebrafish,”
Cold Spring Harbor Perspect. Med., 2
(5), a006684
(2012). http://dx.doi.org/10.1101/cshperspect.a006684 Google Scholar
E. Chaigneau et al.,
“Two-photon imaging of capillary blood flow in olfactory bulb glomeruli,”
Proc. Natl. Acad. Sci. U. S. A., 100
(22), 13081
–13086
(2003). http://dx.doi.org/10.1073/pnas.2133652100 Google Scholar
C. B. Schaffer et al.,
“Two-photon imaging of cortical surface microvessels reveals a robust redistribution in blood flow after vascular occlusion,”
PLoS Biol., 4
(2), e22
(2006). http://dx.doi.org/10.1371/journal.pbio.0040022 Google Scholar
J. Rao, A. Dragulescu-Andrasi and H. Yao,
“Fluorescence imaging in vivo: recent advances,”
Curr. Opin. Biotechnol., 18
(1), 17
–25
(2007). http://dx.doi.org/10.1016/j.copbio.2007.01.003 CUOBE3 0958-1669 Google Scholar
J. D. Lewis et al.,
“Viral nanoparticles as tools for intravital vascular imaging,”
Nat. Med., 12
(3), 354
–360
(2006). http://dx.doi.org/10.1038/nm1368 1078-8956 Google Scholar
G. R. Reddy et al.,
“Vascular targeted nanoparticles for imaging and treatment of brain tumors,”
Clin. Cancer Res., 12
(22), 6677
–6686
(2006). http://dx.doi.org/10.1158/1078-0432.CCR-06-0946 Google Scholar
N. D. Lawson and B. M. Weinstein,
“In vivo imaging of embryonic vascular development using transgenic zebra fish,”
Dev. Biol., 248 307
–318
(2002). http://dx.doi.org/10.1006/dbio.2002.0711 DEBIAO 0012-1606 Google Scholar
R. J. Antcliff et al.,
“Comparison between optical coherence tomography and fundus fluorescein angiography for the detection of cystoid macular edema in patients with uveitis,”
Ophthalmology, 107
(3), 593
–599
(2000). http://dx.doi.org/10.1016/S0161-6420(99)00087-1 OPANEW 0743-751X Google Scholar
A. Manivannan et al.,
“Ultra-wide-field fluorescein angiography of the ocular fundus,”
Am. J. Ophthalmol., 140
(3), 525
–527
(2005). http://dx.doi.org/10.1016/j.ajo.2005.02.055 AJOPAA 0002-9394 Google Scholar
J. S. Slakter et al.,
“Indocyanine-green angiography,”
Curr. Opin. Ophthalmol., 6
(3), 25
–32
(1995). http://dx.doi.org/10.1097/00055735-199506000-00005 COOTEF Google Scholar
L. A. Yannuzzi,
“Indocyanine green angiography: a perspective on use in the clinical setting,”
Am. J. Ophthalmol., 151
(5), 745
–751
(2011). http://dx.doi.org/10.1016/j.ajo.2011.01.043 AJOPAA 0002-9394 Google Scholar
A. Mariampillai et al.,
“Speckle variance detection of microvasculature using swept-source optical coherence tomography,”
Opt. Lett., 33
(13), 1530
–1532
(2008). http://dx.doi.org/10.1364/OL.33.001530 OPLEDP 0146-9592 Google Scholar
J. Enfield, E. Jonathan and M. Leahy,
“In vivo imaging of the microcirculation of the volar forearm using correlation mapping optical coherence tomography (cmOCT),”
Biomed. Opt. Express, 2
(5), 1184
–1193
(2011). http://dx.doi.org/10.1364/BOE.2.001184 BOEICL 2156-7085 Google Scholar
J. Fingler et al.,
“Mobility and transverse flow visualization using phase variance contrast with spectral domain optical coherence tomography,”
Opt. Express, 15
(20), 12636
–12653
(2007). http://dx.doi.org/10.1364/OE.15.012636 OPEXFF 1094-4087 Google Scholar
L. An, J. Qin and R. K. Wang,
“Ultrahigh sensitive optical microangiography for in vivo imaging of microcirculations within human skin tissue beds,”
Opt. Express, 18
(8), 8220
–8228
(2010). http://dx.doi.org/10.1364/OE.18.008220 OPEXFF 1094-4087 Google Scholar
A. S. Nam et al.,
“Complex differential variance algorithm for optical coherence tomography angiography,”
Biomed. Opt. Express, 5
(11), 3822
(2014). http://dx.doi.org/10.1364/BOE.5.003822 BOEICL 2156-7085 Google Scholar
E. Jonathan, J. Enfield and M. J. Leahy,
“Correlation mapping method for generating microcirculation morphology from optical coherence tomography (OCT) intensity images,”
J. Biophotonics, 4
(9), 583
–587
(2011). http://dx.doi.org/10.1002/jbio.201000103 Google Scholar
R. K. Wang and L. An,
“Doppler optical micro-angiography for volumetric imaging of vascular perfusion in vivo,”
Opt. Express, 17
(11), 8926
–8940
(2009). http://dx.doi.org/10.1364/OE.17.008926 OPEXFF 1094-4087 Google Scholar
J. Fingler et al.,
“Volumetric microvascular imaging of human retina using optical coherence tomography with a novel motion contrast technique,”
Opt. Express, 17
(24), 22190
–22200
(2009). http://dx.doi.org/10.1364/OE.17.022190 OPEXFF 1094-4087 Google Scholar
R. K. Wang et al.,
“Depth-resolved imaging of capillary networks in retina and choroid using ultrahigh sensitive optical microangiography,”
Opt. Lett., 35
(9), 1467
–1469
(2010). http://dx.doi.org/10.1364/OL.35.001467 OPLEDP 0146-9592 Google Scholar
Y. M. Liew et al.,
“In vivo assessment of human burn scars through automated quantification of vascularity using optical coherence tomography,”
J. Biomed. Opt., 18
(6), 061213
(2013). http://dx.doi.org/10.1117/1.JBO.18.6.061213 JBOPFO 1083-3668 Google Scholar
J. Xu et al.,
“Scalable wide-field optical coherence tomography-based angiography for in vivo imaging applications,”
Biomed. Opt. Express, 7
(5), 1905
(2016). http://dx.doi.org/10.1364/BOE.7.001905 BOEICL 2156-7085 Google Scholar
M. S. Mahmud et al.,
“Review of speckle and phase variance optical coherence tomography to visualize microvascular networks,”
J. Biomed. Opt., 18
(5), 050901
(2013). http://dx.doi.org/10.1117/1.JBO.18.5.050901 JBOPFO 1083-3668 Google Scholar
A. Zhang et al.,
“Methods and algorithms for optical coherence tomography-based angiography: a review and comparison,”
J. Biomed. Opt., 20
(10), 100901
(2015). http://dx.doi.org/10.1117/1.JBO.20.10.100901 JBOPFO 1083-3668 Google Scholar
D. Y. Kim et al.,
“In vivo volumetric imaging of human retinal circulation with phase-variance optical coherence tomography,”
Biomed. Opt. Express, 2
(6), 1504
–1513
(2011). http://dx.doi.org/10.1364/BOE.2.001504 BOEICL 2156-7085 Google Scholar
D. Y. Kim et al.,
“Optical imaging of the chorioretinal vasculature in the living human eye,”
Proc. Natl. Acad. Sci. U. S. A., 110
(35), 14354
–14359
(2013). http://dx.doi.org/10.1073/pnas.1307315110 Google Scholar
D. M. Schwartz et al.,
“Phase-variance optical coherence tomography: a technique for noninvasive angiography,”
Ophthalmology, 121
(1), 180
–187
(2014). http://dx.doi.org/10.1016/j.ophtha.2013.09.002 OPANEW 0743-751X Google Scholar
R. A. Leitgeb et al.,
“Extended focus depth for Fourier domain optical coherence microscopy,”
Opt. Lett., 31
(16), 2450
–2452
(2006). http://dx.doi.org/10.1364/OL.31.002450 OPLEDP 0146-9592 Google Scholar
H.-C. Lee et al.,
“Ultrahigh speed spectral-domain optical coherence microscopy,”
Biomed. Opt. Express, 4
(8), 1236
–1254
(2013). http://dx.doi.org/10.1364/BOE.4.001236 BOEICL 2156-7085 Google Scholar
Y. Chen et al.,
“Label-free imaging of developing vasculature in zebrafish with phase variance optical coherence microscopy,”
Proc. SPIE, 9716 97160A
(2016). http://dx.doi.org/10.1117/12.2209653 PSISDG 0277-786X Google Scholar
T. J. Eom et al.,
“Calibration and characterization protocol for spectral-domain optical coherence tomography using fiber Bragg gratings,”
J. Biomed. Opt., 16
(3), 030501
(2011). http://dx.doi.org/10.1117/1.3552602 JBOPFO 1083-3668 Google Scholar
S. Makita, T. Fabritius and Y. Yasuno,
“Full-range, high-speed, high-resolution 1 microm spectral-domain optical coherence tomography using BM-scan for volumetric imaging of the human posterior eye,”
Opt. Express, 16
(12), 8406
–8420
(2008). http://dx.doi.org/10.1364/OE.16.008406 OPEXFF 1094-4087 Google Scholar
R. Leitgeb et al.,
“Ultrahigh resolution Fourier domain optical coherence tomography,”
Opt. Express, 12
(10), 2156
–2165
(2004). http://dx.doi.org/10.1364/OPEX.12.002156 OPEXFF 1094-4087 Google Scholar
Optical Coherence Tomography: Technology and Applications, Springer-Verlag, Berlin Heidelberg
(2008). Google Scholar
M. Wsterfield, The Zebrafish Book, University of Oregon Press, Eugene, Oregon
(1994). Google Scholar
A. G. Podoleanu,
“Optical coherence tomography,”
J. Microsc., 247
(3), 209
–219
(2012). http://dx.doi.org/10.1111/j.1365-2818.2012.03619.x JMICAR 0022-2720 Google Scholar
A. Maizel et al.,
“High-resolution live imaging of plant growth in near physiological bright conditions using light sheet fluorescence microscopy,”
Plant J., 68
(2), 377
–385
(2011). http://dx.doi.org/10.1111/j.1365-313X.2011.04692.x Google Scholar
N. Nassif et al.,
“In vivo high-resolution video-rate spectral-domain optical coherence tomography of the human retina and optic nerve,”
Opt. Express, 12
(3), 367
–376
(2004). http://dx.doi.org/10.1364/OPEX.12.000367 OPEXFF 1094-4087 Google Scholar
M. Wojtkowski et al.,
“Ultrahigh-resolution, high-speed, Fourier domain optical coherence tomography and methods for dispersion compensation,”
Opt. Express, 12
(11), 2404
–2422
(2004). http://dx.doi.org/10.1364/OPEX.12.002404 OPEXFF 1094-4087 Google Scholar
B. White et al.,
“In vivo dynamic human retinal blood flow imaging using ultra-high-speed spectral domain optical coherence tomography,”
Opt Express, 11
(25), 3490
–3497
(2003). http://dx.doi.org/10.1364/OE.11.003490 Google Scholar
J. Fingler et al.,
“Phase-contrast OCT imaging of transverse flows in the mouse retina and choroid,”
Invest. Ophthalmol. Visual Sci., 49
(11), 5055
–5059
(2008). http://dx.doi.org/10.1167/iovs.07-1627 IOVSDA 0146-0404 Google Scholar
L. Liu et al.,
“Automated choroidal neovascularization detection algorithm for optical coherence tomography angiography,”
Biomed. Opt. Express, 6
(9), 3564
(2015). http://dx.doi.org/10.1364/BOE.6.003564 BOEICL 2156-7085 Google Scholar
M. Zhang et al.,
“Projection-resolved optical coherence tomographic angiography,”
Biomed. Opt. Express, 7
(3), 816
(2016). http://dx.doi.org/10.1364/BOE.7.000816 BOEICL 2156-7085 Google Scholar
B. J. Vakoc et al.,
“Three-dimensional microscopy of the tumor microenvironment in vivo using optical frequency domain imaging,”
Nat. Med., 15
(10), 1219
–1223
(2009). http://dx.doi.org/10.1038/nm.1971 1078-8956 Google Scholar
BiographyYu Chen is a doctoral candidate in biomedical engineering at the University of Southern California (USC). He received his BS and MS degrees in biomedical engineering from Zhejiang University in 2011 and USC in 2013, respectively. He is a student member of SPIE. Le A. Trinh is a senior research scientist at USC in the Department of Molecular and Computational Biology. She received her PhD in genetic and developmental biology from the University of California, San Francisco, and her BS in molecular, cell and development biology and sociology from the University of California, Los Angeles. Jeff Fingler is a PhD graduate from the California Institute of Technology, where he was the original inventor of pvOCT. He has developed pvOCT in the academic environments at Caltech and USC, and as a co-founder of Varocto, a start-up company focusing on ophthalmic diagnostic technologies. He currently works as an independent contractor and continues to work in the field of OCT and non-invasive vascular imaging. Scott E. Fraser is a provost professor of biological sciences and biomedical engineering at USC, where he serves as the director of Science Initiatives and Translational Imaging Center. He received his BS degree in physics from Harvey Mudd College, and PhD in biophysics from Johns Hopkins University. He is a member of SPIE. |


