|
|
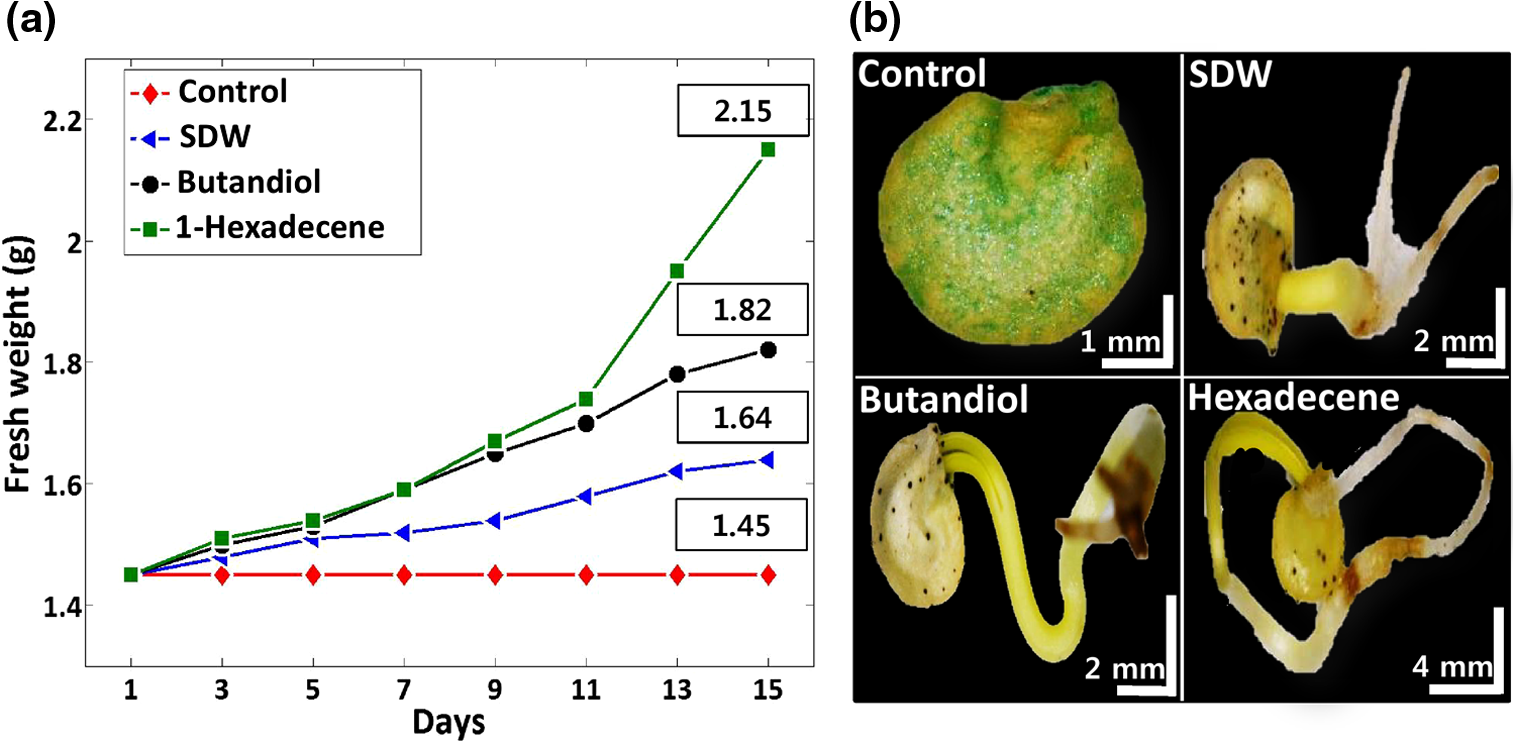
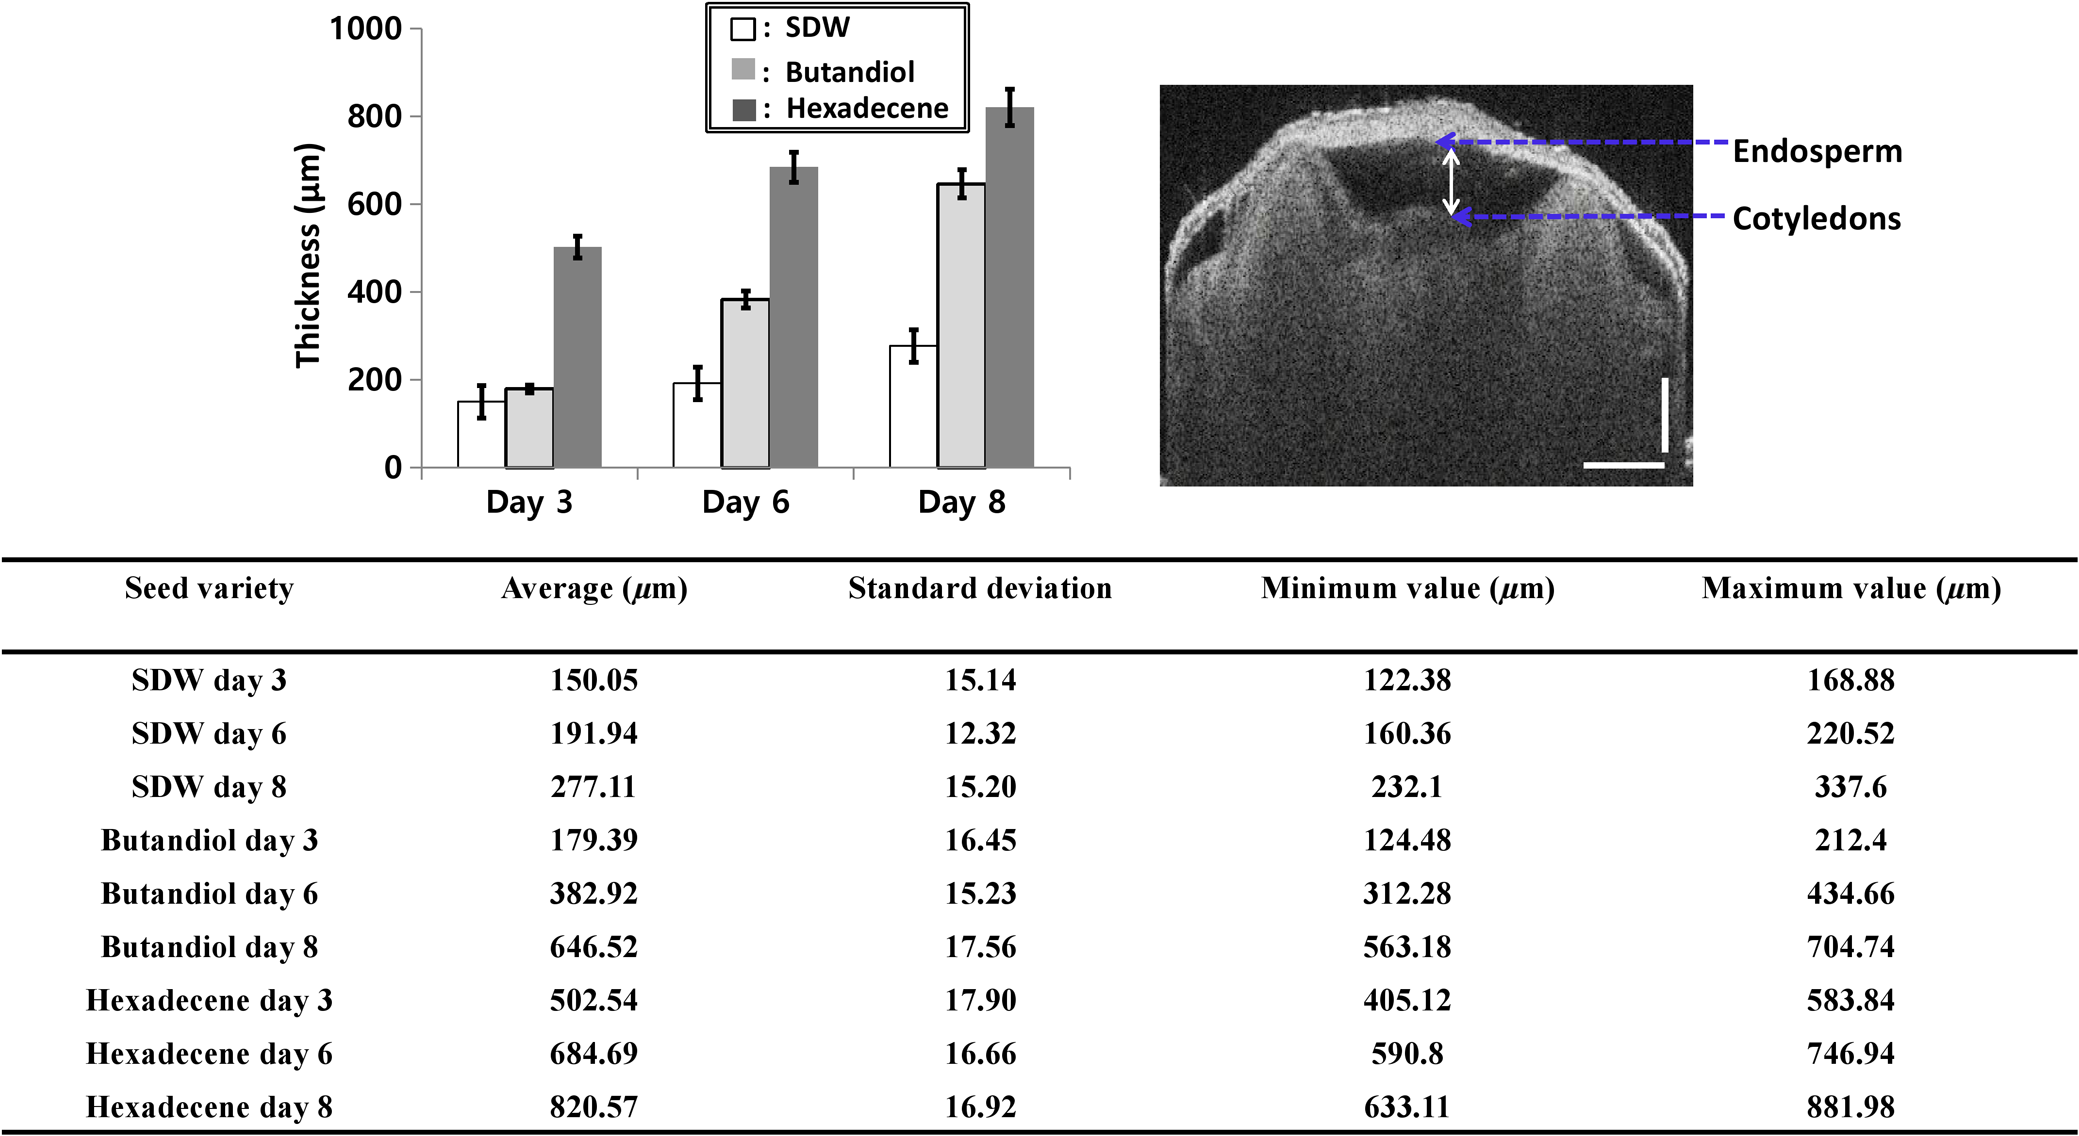
1.IntroductionSeed germination is a natural biological process in plant growth, and the rate of seed germination is important for commercial seed companies and seedling industries. The germination rate is controlled by dormancy such as thickness of testa (seed coat) and plant hormones.1–4 Many destructive gold standard efforts have been made to improve seed germination, since growth-promoting techniques are essential for accelerating the germination speed during ideal seeding and germination periods. Among the reported methods, the effect of distillery effluents at various concentrations on seed germination speed has been studied. The visible protrusion of the radicle from the seed coat was expressed in percentage to analyze the germination rate.5 The number of basal and lateral roots per seed and the length of the taproot were compared among chemically treated, untreated, and pregerminated seeds to analyze the germination rate.6 Seeds were primed under various salt concentrations to investigate the radicle-inhibiting salt concentration and evaluate whether this inhibition influenced subsequent germination.7,8 The effect of lubricating oil on seed germination speed was investigated to demonstrate how contamination of the soil affects plant growth.9,10 Such methods describe the effects of external factors, such as temperature, mechanical stress, and permanent magnetic fields, for analyzing the germination rate. The process of seed germination includes various inner structural changes such as testa and endosperm rupture.3 As a consequence, microscopic analysis is the only way to observe the process of germination by measuring the length and fresh weight of seedlings and seeds, which is a time-consuming process. Thus, optical sensing technologies-based rapid, rigorous, and nondestructive cross-sectional analysis is a crucial requirement to overcome the aforementioned important barriers of monitoring seed germination speed in agriculture. Optical coherence tomography (OCT) is a noninvasive, high-resolution, and purely optical method, which provides depth-resolved imaging data through two-dimensional (2-D) and three-dimensional (3-D) images.11–13 OCT has received a lot of interest in biomedical areas, such as ophthalmology,14–16 dermatology,17 dentistry,18,19 and otolaryngology,20–22 and also in industrial applications as well.23 However, OCT applications in the field of agriculture and plant photonics have not been reported frequently. The first OCT application related to agriculture demonstrated a morphological analysis and plant tissue regeneration under different water supply conditions.24 Further, OCT has been implemented to analyze the hull thickness of lupin seeds and microstructural formation of apple peel to confirm various morphological layers.25,26 Moreover, OCT-based several plant disease inspection studies were performed by our group for cucumber seeds, melon seeds, and apple leaves, confirming the capability of the imaging modality for viral inspection.27–31 An alternative optical imaging method called optical coherence microscopy (OCM) was used to visualize plant tissues owing to its high lateral resolution. However, because of the lack of depth penetration and image acquisition speed, OCT is more appropriate than OCM for imaging in the field of agriculture.32,33 The aim of this study was to introduce an application of OCT to investigate the germination rate of chemically treated seeds by considering the speed of morphological changes in seeds. Such capabilities make it a potentially useful tool in the field of agriculture for enhancing the productivity. To the best of our knowledge, this is the first demonstration of OCT in analyzing the acceleration of the germination rate of seeds according to various chemical conditions. 2.Materials and Methods2.1.Preparation of Seed SamplesCapsicum annum seeds were obtained from the Institute for Microorganism, Kyungpook National University, Daegu, South Korea, to ensure high-seed viability and homogeneity. The seeds were germinated using petri dishes with tissue papers. The seeds were dried at room temperature (27°C) prior to the germination process. The OCT experiment was conducted under laboratory conditions (; relative humidity, 80%), and the expected results were obtained within 8 consecutive days. The experiment was performed with 60 seed samples in triplicate (), divided into three experimental groups. All the selected seeds had an equal initial fresh weight of 1.45 g. The first group of 20 seeds was treated with 1-hexadecene. The second group was treated with butandiol, and the remaining 20 seeds were germinated in sterile distilled water (SDW) medium. To ascertain the optimal chemical concentration, the corresponding two growth-promoting chemicals (1-hexadecene and butandiol) were evaluated initially. Seed samples with an equivalent fresh weight (1.45 g) were germinated for 15 consecutive days according to the gold standard method (fresh weight or length variation analysis) under various concentrations, such as 0.1, 1, 10, 100, 1000, and , for 1-hexadecene and butandiol. 2.2.Optical Coherence Tomography System DescriptionFigure 1 depicts the schematic diagram of the customized swept source OCT (SS-OCT) system used for the experiment. A high-speed 1310-nm swept source (Axsun Technology, USA) with a sweep bandwidth of 110 nm, sweeping rate of 50 kHz, and average output power of 20 mW was used as the swept laser source. The light beam from the laser source was passed into the input port of an 80:20 optical fiber coupler (Gooch & Housego, UK). A few parts (20%) of the incident beam were connected to the input port of a circulator. Simultaneously, the remaining 80% of the beam was connected to another circulator. Both of these corresponding circulators were connected to the reference and sample arms. The backscattered light from both the reference and sample arms was propagated through the output terminals of the circulators. This backscattered light of the two arms was interfered in the 50:50 optical fiber coupler (Gooch & Housego). The two output terminals of the fiber coupler were connected to a balanced photodetector (Thorlabs, USA). This obtained signal was digitized using a data acquisition card (Alazar Technologies Inc., Canada). A software-based data processing method was used for image construction. The maximum imaging depth and the imaging width of the customized SS-OCT system were 12 and 10 mm, respectively. The applied refractive index of plant cells, which affects the depth scale of 2-D OCT images, was 1.42. All of the seed specimens were scanned with a scanning range. The axial resolution of our system was (in air), and the 2-D and 3-D OCT images were generated by scanning the laser beam through a scan lens, achieving transverse resolution of in air and in plant tissues. 3.Results and Discussion3.1.Fresh Weight Fluctuation Analysis According to the Gold Standard MethodFor this experiment, we selected 1-hexadecene and butandiol, along with SDW, since the seed samples treated with 1-hexadecene and butandiol attained the maximum fresh weight.34,35 Prior to OCT image acquisition, we performed gold standard methods to measure the increase in physical fresh weight and lengthening of the sprout of the chemically treated seeds for 15 consecutive days. Figure 2(a) depicts the physical fresh weights, while Fig. 2(b) outlines the monitored maximum length of the seed sprouts of the three chemically treated samples and the untreated sample. All the samples had an initial fresh weight of 1.45 g. The results revealed that the 1-hexadecene sample had the highest fresh weight of 2.15 g as well as the longest seed sprout. 3.2.Consecutively Monitored Seed Morphological Changes Based Germination RateFigure 3 shows the SS-OCT images of seed morphology variations that occurred along with seed germination. Figures 3(a), 3(e), and 3(i) represent the 2-D OCT images of initial seed samples treated with SDW, butandiol (), and 1-hexadecene (), respectively. The results were obtained within 8 consecutive days. The speed of the morphological changes monitored using 2-D images was compared to evaluate the germination speed as well as to verify the growth-promoting chemical compound that led to the optimal increase in germination rate. Both testa and endosperm could be visualized in all three samples at the initial stage. Seed sprouting was observed with the progress of germination after 8 days. Morphological variations, such as the formation of cotyledons and embryonic regions, and the structural changes of the micropylar endosperm region were detected between the initial and final steps of germination. The samples treated with 1-hexadecene showed more rapid morphological changes compared with the samples treated with butandiol and SDW. Figure 3(c) shows a structural change of the micropylar endosperm in the SDW-treated sample on the sixth imaging day; this was observed on the third imaging day for the samples treated with butandiol and 1-hexadecene [Figs. 3(f) and 3(j)]. Similarly, Fig. 3(d) shows the initial stage of the embryonic form on the eighth imaging day [Fig. 3(d)], a stage that was identified on the sixth [Fig. 3(g)] and third [Fig. 3(j)] imaging days for the samples treated with butandiol and 1-hexadecene, respectively. However, the region of the micropylar endosperm in Fig. 3(j) was slightly disappeared, and the thickness of the seed coat was reduced because of rapid germination relative to that observed in Fig. 3(f). Therefore, the samples treated with 1-hexadecene showed a significant acceleration in the germination rate when compared with the samples treated with SDW and butandiol, which correlates with the gold standard results. Additionally, to gain a better understanding about the accelerated germination rate, the duration of the aforementioned embryonic formation in each corresponding seed sample was emphasized using a blue color dashed circular region to highlight the efficacy of 1-hexadecene, which is two times faster than butandiol and more than 2.5 times faster than SDW. Fig. 3Day-to-day morphological changes in the chemically treated seeds from the initial stage to the sprouting stage. (a)–(d) Seed germinated in SDW, (e)–(h) butandiol-treated seed, and (i)–(l) 1-hexadecene-treated seed. C, cotyledons; E, endosperm; EM, embryo; ME, micropylar endosperm; SC, storage cotyledons; T, testa (seed coat). The horizontal scale bars: and vertical scale bars: .  3.3.A-Scan Depth Profile Analysis Based Total Signal Intensity FluctuationWe performed an A-scan depth profile analysis to identify the total signal intensity fluctuation of seed cross-sectional OCT images on the basis of germination speed. For a precise evaluation of intensity fluctuation, a program was coded using MATLAB (Mathworks, USA) to analyze the total pixel intensity of the image in depth direction. In the A-scan process, 2-D OCT image was loaded and the intensity signals belonging to the entire seed cross-section (approximately 300 A-scan lines) were applied. The algorithm detects the maximum intensity in individual A-scan line sequentially. Then all the peak positions in all intensity signals were rearranged while matching the peak intensity index in A-scans to flatten the image. Owing to the physical structure of the seed, the acquired cross-sectional images are nonflattened images containing maximum intensity index positions at different positions. Therefore, the index positions with high intensity should be rearranged and matched linearly to acquire a flattened image. To normalize the A-scan lines, the intensities of the A-scans were divided by the maximum intensity values. Finally, the intensities of all the rearranged, flattened, and normalized A-scan lines were summed up and averaged to obtain the required total intensity fluctuation in depth direction. The evaluated total intensity fluctuations of days 1, 3, 6, and 8 are shown in Figs. 4(a) and 4(d). There was not much intensity fluctuation identified between SDW (blue dotted curve), butandiol (black dashed curve), and 1-hexadecene (red solid curve) on the first day of the experiment, as shown in Fig. 4(a). However, due to the formation of cotyledons and embryonic regions of butandiol- and 1-hexadecene-treated samples, a reduction of the intensity than SDW-treated samples (blue dotted curve) was identified in the A-scans of butandiol (black dashed curve) and the least intensity was identified in 1-hexadecene (red solid curve), as shown in Fig. 4(b). Similar behavior to Fig. 4(b) was identified in the total signal intensity fluctuations on the remaining experimental days [Figs. 4(c) and 4(d)] due to the formation of internal regions such as a large embryonic region and storage cotyledons. As a result of the accelerated seed germination rate of 1-hexadecene and secondly butandiol, internal seed regions, such as embryo, micropylar endosperm, and storage cotyledons, are formed by clearing the internal solid structure of seed. Due to the less germination rate of SDW-treated samples, clearing rate of the solid seed structure and the formation rate of the aforementioned internal seed regions were less than the other growth-promoting chemicals, which leads to a change of refractive index of the internal seed structure. Therefore, owing to the remaining internal solid seed structure, SDW-treated samples have a higher scattering coefficient and perform a higher normalized total intensity compared with butandiol and 1-hexadecene. Hence, this analysis plays a vital role by confirming the higher germination speed through the detection of less total intensity of an A-scan depth profile. Although a reduction of total intensity due to the morphological changes could be identified in all three samples, the samples treated with 1-hexadecene showed the intensity reduction earlier than the other samples, which confirms the highest germination rate. 3.4.Thickness Quantification Based Germination Rate AnalysisAccording to the obtained morphological analysis, a gradual expansion of the distance between endosperm layer and cotyledons layer was identified along with the progress of germination. To gain a better understanding and a rigorous confirmation about the efficacy of the applied growth-promoting chemicals, we quantified the thickness between endosperm layer and cotyledons layer. The selection of the exact location to measure the thickness between endosperm and cotyledons layers was a challenging task due to the unflattened biological nature of the seed morphology. Therefore, to increase the accuracy of the measurements, we developed a program-based cropped window with 50 intensity signals (A-scan lines) to select the region of interest. The cropped window selects the intensity signals of the region of interest and detects the maximum intensity positions to linearly index the positions and average, which flattens the entire unflattened region of interest. Owing to the detection capability of the cropped window, distinguishable peak information representing endosperm and cotyledons layers was clearly identified. Thus, for each single sample, thickness was measured by considering the distance between averaged peak information. To increase the accuracy of the peak detection method and to verify the exact location, we obtained multiple 2-D OCT images (six images) from a single seed and averaged the measurements. Then we analyzed the thickness for all 20 seed specimens per each seed category and averaged to obtain precise thickness information. The table shown in Fig. 5 shows the statistical values such as averaged thickness, standard deviations errors, and minimum and maximum thickness fluctuation range of three seed categories, which were obtained on the third, sixth, and eighth experimental days. The bar graph shown in Fig. 5 clearly verifies the thickness increase between the aforementioned two seed internal layers in all three seed categories, and the maximum thickness was identified in 1-hexadecene-treated samples, which confirms the accelerated germination rate compared with the other two categories. As a consequence, the results can be implemented as a thickness threshold range to obtain a rapid confirmation about the germination state of a seed by only measuring the thickness difference between the endosperm layer and cotyledons layer, which will be beneficial to select the most appropriate growth-promoting chemical for plant seeds. Therefore, the efficacy of the proposed method can be enhanced by analyzing the internal physical state of the seed at an initial stage using the performed precise quantification method. 3.5.Three-Dimensional Optical Coherence Tomography Image AnalysisTo evaluate the proposed method more rigorously and to emphasize the influence of each chemical component for the fluctuation of 3-D morphological structures with respect to the germination, we concluded the monitoring process by obtaining 3-D OCT images after 12 days of the chemical treatments. Figure 6 shows the 3-D top view, enface view of the seed middle region, and orthosliced cross-sectional view of the seeds along with the monitored morphological changes. The obtained enface images revealed the morphological changes that occurred owing to the growth-promoting chemicals. In particular, additional structural layers and morphological changes were observed in the samples treated with 1-hexadecene, such as in the embryo, storage cotyledons, radicle, and micropylar endosperm. Moreover, an obvious long sprout was identified in the sample treated with 1-hexadecene, confirming the suitability of 1-hexadecene as the optimal growth-promoting chemical to enhance the germination speed. Fig. 63-D OCT images of seed morphology variations that occurred owing to germination. (a)–(c) 3-D, enface, and cross-sectional OCT images of an SDW-treated seed. (d)–(f) 3-D, enface, and cross-sectional OCT images of a seed treated with butandiol. (g)–(i) 3-D, enface, and cross-sectional OCT images of a seed treated with 1-hexadecene. C, cotyledons; E, endosperm; EM, embryo; H, hypocotyl; ME, micropylar endosperm; R, radicle; SC, storage cotyledons; SP, sprout; T, Testa (seed coat). The horizontal scale bars: and vertical scale bars: . 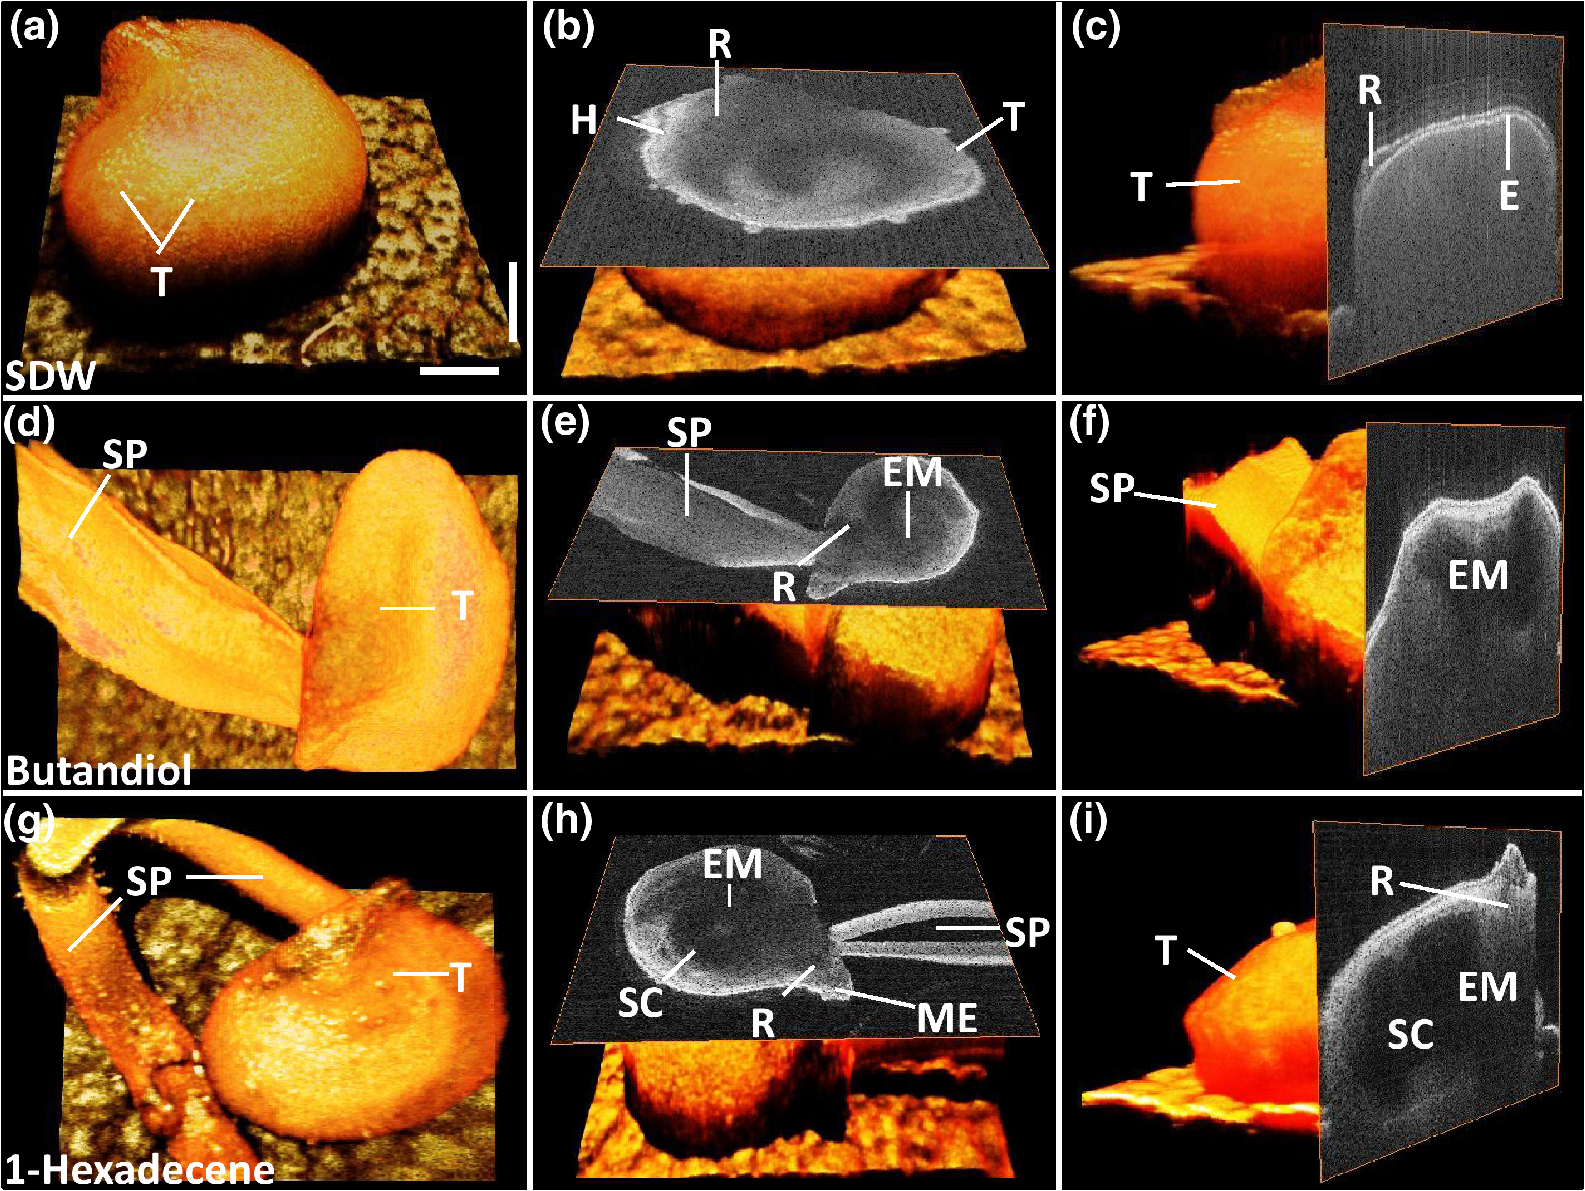 4.DiscussionHere, we demonstrated an implementation of OCT to confirm the applicability of the proposed method in agriculture and enhance the harvesting speed by evaluating the enhanced germination rate of the chemically treated seeds. The competency of imaging the seed microstructure and morphological variations during germination suggests that the proposed method has various agricultural applications that could be used to improve the process of harvesting by selecting the most ideal growth-promoting chemical. In fact, the germination rate of seeds has been studied previously by measuring seedling length and fresh weight of the seed; however, these methods are time consuming. The nondestructive OCT imaging modality was used here for the first time and was found to have considerable merits over conventional methods. To the best of our knowledge, analysis of the efficacy of growth-promoting chemicals to increase the germination rate by using OCT has not been performed. Generally, mean germination time (MGT) is confirmed once the seedling emerges from the seed. MGT is measured when the fresh weight of the seed has a nonnegligible weight fluctuation, but this measure lacks accuracy. However, OCT is capable of visualizing initial changes in the microstructures and morphology underneath the seed surface. Moreover, it decreases the germination analyzing time and minimizes the time required to confirm the most optimal growth-promoting chemical that would increase the harvesting speed. Most notably, OCT could be used to visualize the morphological changes of micropylar endosperm and formation of cotyledons, embryo, and storage cotyledons in all three treated samples with different germination rates. Furthermore, the obtained 2-D and 3-D OCT images, A-scan depth profiles, and the thickness quantifications revealed the accelerated germination rate of the seeds according to the applied specific growth-promoting chemical, which can be identified comparatively with a day-to-day morphology-varying rate. Therefore, the most probable germination concluding state of SDW- and butandiol-treated samples was identified at a more prior germination stage of 1-hexadecene-treated sample within a short duration. 5.ConclusionIn conclusion, we introduced an optical sensing method to determine the most optimal growth-promoting chemical for seeds by performing an initial experiment to monitor the germination speed of C. annum seeds using OCT. The seeds were treated with three growth-promoting chemicals: SDW, butandiol (), and 1-hexadecene (). The results successfully illustrated the potential merits of our proposed method as well as consistency with the gold standard results. Such a method can be described as an essential necessity in the fields of agriculture and agronomy and seedling industries. Harvesting speed can be enhanced through the accelerated germination rate caused by the use of the optimal growth-promoting chemical determined using the proposed method. AcknowledgmentsThis research was supported by Advanced Production Technology Development Program (No. 314031-3) Ministry for Food, Agriculture, Forestry and Fisheries, Republic of Korea. Moreover, we specially thank the Institute of Optics Image Diagnostic Technology (Oz-tec) for providing the customized optical imaging modality and also we thank the Institute for Microorganism of Kyungpook National University for providing the sample materials of the research work. ReferencesR. D. Amen,
“A model of seed dormancy,”
Bot. Rev., 34
(1), 1
–31
(1968). http://dx.doi.org/10.1007/BF02858619 BOREA4 0006-8101 Google Scholar
S. Groot and C. Karssen,
“Gibberellins regulate seed germination in tomato by endosperm weakening: a study with gibberellin-deficient mutants,”
Planta, 171
(4), 525
–531
(1987). http://dx.doi.org/10.1007/BF00392302 PLANAB 1432-2048 Google Scholar
F. E. Martínez-Maldonado, D. Miranda-Lasprilla and S. Magnitskiy,
“Sugar apple (Annona squamosa L., Annonaceae) seed germination: morphological and anatomical changes,”
Agron. Colomb., 31
(2), 176
–183
(2013). Google Scholar
A. Pandey and S. Tamta,
“Effect of pre-sowing treatments on seed germination in Quercus serrata Thunb. and Quercus semecarpifolia Sm,”
Int. J. Biodiversity Conserv., 5
(12), 791
–795
(2013). http://dx.doi.org/10.5897/IJBC2013.0605 Google Scholar
S. Ramana et al.,
“Effect of distillery effluent on seed germination in some vegetable crops,”
Bioresour. Technol., 82
(3), 273
–275
(2002). http://dx.doi.org/10.1016/S0960-8524(01)00184-5 BIRTEB 0960-8524 Google Scholar
P. J. Stoffella et al.,
“Seedling root morphology and shoot growth after seed priming or pregermination of bell pepper,”
HortScience, 27
(3), 214
–215
(1992). HJHSAR 0018-5345 Google Scholar
P. T. Smith and B. G. Cobb,
“Accelerated germination of pepper seed by priming with salt solutions and water,”
HortScience, 26
(4), 417
–419
(1991). HJHSAR 0018-5345 Google Scholar
P. V. Yadav, M. Kumari and Z. Ahmed,
“Seed priming mediated germination improvement and tolerance to subsequent exposure to cold and salt stress in capsicum,”
Res. J. Seed Sci., 4 125
–136
(2011). http://dx.doi.org/10.3923/rjss.2011.125.136 Google Scholar
G. Anoliefo and D. Vwioko,
“Effects of spent lubricating oil on the growth of Capsicum annum L. and Lycopersicon esculentum Miller,”
Environ. Pollut., 88
(3), 361
–364
(1995). http://dx.doi.org/10.1016/0269-7491(95)93451-5 Google Scholar
V. Nimmi and G. Madhu,
“Effect of pre-sowing treatment with permanent magnetic field on germination and growth of chilli (Capsicum annum L.),”
Int. Agrophys., 23
(2), 195
–198
(2009). INAGEX 0236-8722 Google Scholar
S.-M. Kim et al.,
“Destruction of cucumber green mottle mosaic virus by heat treatment and rapid detection of virus inactivation by RT-PCR,”
Mol. Cells, 16
(3), 338
–342
(2003). Google Scholar
W. Jung et al.,
“Handheld optical coherence tomography scanner for primary care diagnostics,”
IEEE Trans. Biomed. Eng., 58
(3), 741
–744
(2011). http://dx.doi.org/10.1109/TBME.2010.2096816 Google Scholar
D. Cui et al.,
“Dual spectrometer system with spectral compounding for 1-μm optical coherence tomography in vivo,”
Opt. Lett., 39
(23), 6727
–6730
(2014). http://dx.doi.org/10.1364/OL.39.006727 OPLEDP 0146-9592 Google Scholar
W. Drexler et al.,
“Ultrahigh-resolution ophthalmic optical coherence tomography,”
Nat. Med., 7
(4), 502
–507
(2001). http://dx.doi.org/10.1038/86589 1078-8956 Google Scholar
M. Wojtkowski et al.,
“Three-dimensional retinal imaging with high-speed ultrahigh-resolution optical coherence tomography,”
Ophthalmology, 112
(10), 1734
–1746
(2005). http://dx.doi.org/10.1016/j.ophtha.2005.05.023 OPANEW 0743-751X Google Scholar
N. Nassif et al.,
“In vivo high-resolution video-rate spectral-domain optical coherence tomography of the human retina and optic nerve,”
Opt. Express, 12
(3), 367
–376
(2004). http://dx.doi.org/10.1364/OPEX.12.000367 OPEXFF 1094-4087 Google Scholar
J. Welzel,
“Optical coherence tomography in dermatology: a review,”
Skin Res. Technol., 7
(1), 1
–9
(2001). http://dx.doi.org/10.1034/j.1600-0846.2001.007001001.x Google Scholar
K. H. Chan et al.,
“Use of 2D images of depth and integrated reflectivity to represent the severity of demineralization in cross‐polarization optical coherence tomography,”
J. Biophotonics, 8
(1–2), 36
–45
(2015). http://dx.doi.org/10.1002/jbio.201300137 Google Scholar
R. C. Lee et al.,
“Automated assessment of the remineralization of artificial enamel lesions with polarization-sensitive optical coherence tomography,”
Biomed. Opt. Express, 5
(9), 2950
–2962
(2014). http://dx.doi.org/10.1364/BOE.5.002950 BOEICL 2156-7085 Google Scholar
N. H. Cho et al.,
“In vivo imaging of middle-ear and inner-ear microstructures of a mouse guided by SD-OCT combined with a surgical microscope,”
Opt. Express, 22
(8), 8985
–8995
(2014). http://dx.doi.org/10.1364/OE.22.008985 OPEXFF 1094-4087 Google Scholar
N. H. Cho et al.,
“Evaluation of the usefulness of three-dimensional optical coherence tomography in a guinea pig model of endolymphatic hydrops induced by surgical obliteration of the endolymphatic duct,”
J. Biomed. Opt., 20
(3), 036009
(2015). http://dx.doi.org/10.1117/1.JBO.20.3.036009 JBOPFO 1083-3668 Google Scholar
J. Lee et al.,
“Decalcification using ethylenediaminetetraacetic acid for clear microstructure imaging of cochlea through optical coherence tomography,”
J. Biomed. Opt., 21
(8), 081204
(2016). http://dx.doi.org/10.1117/1.JBO.21.8.081204 JBOPFO 1083-3668 Google Scholar
N. H. Cho et al.,
“Quantitative assessment of touch-screen panel by nondestructive inspection with three-dimensional real-time display optical coherence tomography,”
Opt. Lasers Eng., 68 50
–57
(2015). http://dx.doi.org/10.1016/j.optlaseng.2014.12.013 OLENDN 0143-8166 Google Scholar
V. V. Sapozhnikova et al.,
“In vivo monitoring of seeds and plant-tissue water absorption using optical coherence tomography and optical coherence microscopy,”
Proc. SPIE, 5316 408
(2004). http://dx.doi.org/10.1117/12.528515 PSISDG 0277-786X Google Scholar
J. Clements et al.,
“Optical coherence tomography as a novel tool for non‐destructive measurement of the hull thickness of lupin seeds,”
Plant Breed., 123
(3), 266
–270
(2004). http://dx.doi.org/10.1111/pbr.2004.123.issue-3 PLABED 1439-0523 Google Scholar
P. Verboven et al.,
“Optical coherence tomography visualizes microstructure of apple peel,”
Postharvest Biol. Technol., 78 123
–132
(2013). http://dx.doi.org/10.1016/j.postharvbio.2012.12.020 PBTEED Google Scholar
S.-Y. Lee et al.,
“Application of optical coherence tomography to detect cucumber green mottle mosaic virus (CGMMV) infected cucumber seed,”
Hortic., Environ. Biotechnol., 53
(5), 428
–433
(2012). http://dx.doi.org/10.1007/s13580-012-0071-x Google Scholar
C. Lee et al.,
“Optical sensing method for screening disease in melon seeds by using optical coherence tomography,”
Sensors, 11
(10), 9467
–9477
(2011). http://dx.doi.org/10.3390/s111009467 SNSRES 0746-9462 Google Scholar
C.-H. Lee et al.,
“The application of optical coherence tomography in the diagnosis of Marssonina blotch in apple leaves,”
J. Opt. Soc. Korea, 16
(2), 133
–140
(2012). http://dx.doi.org/10.3807/JOSK.2012.16.2.133 1226-4776 Google Scholar
R. E. Wijesinghe et al.,
“Optical inspection and morphological analysis of diospyros kaki plant leaves for the detection of circular leaf spot disease,”
Sensors, 16
(8), 1282
(2016). http://dx.doi.org/10.3390/s16081282 SNSRES 0746-9462 Google Scholar
N. K. Ravichandran et al.,
“In vivo monitoring on growth and spread of gray leaf spot disease in Capsicum annum leaf using spectral domain optical coherence tomography,”
J. Spectrosc., 2016 1093734
(2016). http://dx.doi.org/10.1155/2016/1093734 JOSPEW Google Scholar
I. Kutis et al.,
“Study of the morphological and functional state of higher plant tissues by optical coherence microscopy and optical coherence tomography,”
Russ. J. Plant Physiol., 52
(4), 559
–564
(2005). http://dx.doi.org/10.1007/s11183-005-0083-9 RJPPE2 1021-4437 Google Scholar
A. Reeves et al.,
“In vivo three‐dimensional imaging of plants with optical coherence microscopy,”
J. Microsc., 208
(3), 177
–189
(2002). http://dx.doi.org/10.1046/j.1365-2818.2002.01086.x JMICAR 0022-2720 Google Scholar
C.-M. Ryu et al.,
“Bacterial volatiles promote growth in Arabidopsis,”
Proc. Natl. Acad. Sci. U. S. A., 100
(8), 4927
–4932
(2003). http://dx.doi.org/10.1073/pnas.0730845100 Google Scholar
M. Sumayo, M.-S. Hahm and S.-Y. Ghim,
“Determinants of plant growth-promoting Ochrobactrum lupini KUDC1013 involved in induction of systemic resistance against Pectobacterium carotovorum subsp. carotovorum in tobacco leaves,”
Plant Pathol. J., 29
(2), 174
–181
(2013). http://dx.doi.org/10.5423/PPJ.SI.09.2012.0143 Google Scholar
BiographyRuchire Eranga Wijesinghe received his BSc degree in electrical engineering from Kyungpook National University, Daegu, Republic of Korea. Currently, he is a PhD researcher in the Electronics Engineering Department of Kyungpook National University, since 2014. His research interests are in the development of novel biomedical and biological imaging techniques based on optical coherence tomography and optical coherence microscopy for medical, agricultural, industrial, and entomological applications. Mansik Jeon received his PhD in electrical engineering from Kyungpook National University, Daegu, Republic of Korea, in 2011. Currently, he is an assistant professor in the School of Electronics Engineering at Kyungpook National University. His research interests are in the development of nonionizing and noninvasive novel biomedical imaging techniques, including photoacoustic tomography, optical coherence tomography, ultrasonic imaging, handheld scanners, and their clinical applications. |