|
|
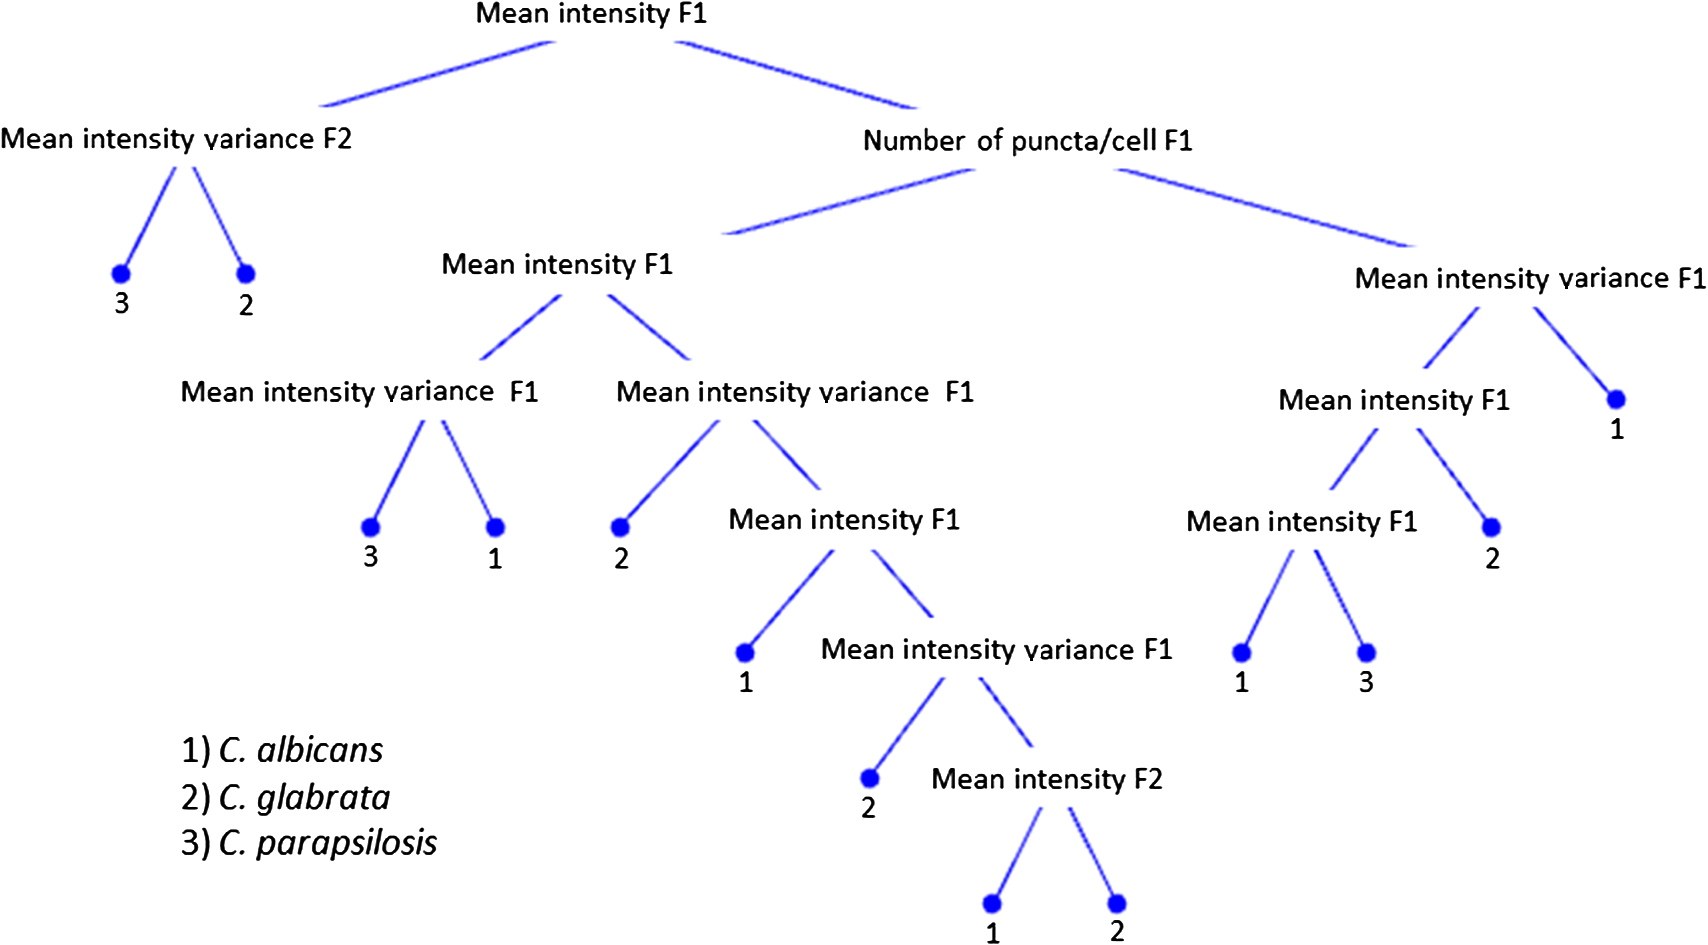
1.IntroductionCandida species are commensal pathogens that usually reside on mucosal surfaces. If given the opportunity, the fungus will transition from a commensal organism to become a pathogen, which can create infections that range from superficial to systemic. Candida species are the most common fungal pathogens, with C. albicans arising the most often followed by C. glabrata and C. parapsilosis, respectively.1–4 Not only is there a high mortality rate associated with candidiasis but there is also a healthcare cost that can exceed billions of dollars annually.1,5–7 To reduce mortality associated with fungal infections, early and accurate identification is essential. Studies have shown that late and incorrect diagnosis of Candida species leads to a significant increase in mortality.8,9 There are multiple clinical diagnostic methods used to support candidiasis diagnoses. Regardless of the detection method (e.g., mass spectrometry and polymerase chain reaction), a microbiological culture step is usually required prior to pathogen identification. This culture step can take between 2 and 5 days from receipt of a clinical sample (e.g., blood, catheter tip, sputum, and urine) for microbiological identification. This long time-to-identification can lead to delays in initiation of optimal antimicrobial chemotherapy. Previous studies have shown relatively poor sensitivity of clinical diagnostics for candidiasis, with a 30% to 50% false negative rate for blood cultures in patients with autopsy-confirmed cases of candidiasis.10,11 This demonstrates the limitations of both time and reliability of diagnosis for common existing diagnostic approaches for candidiasis. Cellular autofluorescence has demonstrated potential as a clinical diagnostic method because it is noninvasive and label-free and has the ability to supply morphological and biochemical information. Studies have shown that autofluorescence emission can be used to detect microbial pathogens, such as Mycobacterium tuberculosis12 and some pathogenic fungi,13 whereas other studies have exploited autofluorescence emission to detect cancer cells.14,15 Utilizing autofluorescence is possible due to the differences in both structure and biochemistry of the pathogen and/or the biochemical changes in cells and tissue resulting from disease. Recently, fungal pathogens have been shown to emit autofluorescence in the visible spectrum using blue/green excitation wavelengths.16 We hypothesize that the autofluorescence emission can be used as a means of rapid identification and can be used parallel to traditional methods to provide a guide for appropriate care at an earlier time. In this study, we use hyperspectral confocal fluorescence microscopy (HCFM) and multivariate spectral analysis methods to resolve multiple autofluorescence spectra in three Candida species pathogens. Utilizing these methods, we were able to identify two independent autofluorescence emission spectra in Candida species grown under physiologically relevant conditions. The relative abundance of these spectral factors, together with intracellular spatial distribution features, was sufficient to yield species level differentiation in laboratory experiments. 2.ResultsWe grew lab strain yeasts of C. albicans, C. glabrata, and C. parapsilosis described in Materials and Methods for the purpose of ascertaining if the individual Candida species have unique autofluorescence characteristics. In these studies, we initially used three different growth media: yeast extract peptone dextrose (YPD) (a rich fungal medium), Roswell Park Memorial Institute medium (RPMI 1640) with 3-(N-morpholino)propanesulfonic acid (MOPS), and pooled human serum. The human serum growth condition was chosen for continued experimentation because of its similarity to the growth condition of fungal pathogens in peripheral blood. We detected autofluorescence emission from all of the Candida species in all growth media. However, there were no significant differences between species grown in YPD and RPMI when looking at the number of spectral factors detected, the shape of the spectral factor, their wavelength of maximum emission, or their relative abundances throughout the fungal cells. In human serum, however, samples exhibited differences in autofluorescence depending on the species. Because this condition most closely matches the nature of clinical samples, we focused our further investigations on autofluorescence components for Candida in human serum. The multivariate curve resolution (MCR) analysis resulted in two different emission factors for all species [Figs. 1(a)–1(c)]. Factor 1’s spectral shape and peak (550 nm) are very similar across all species, leading to the idea that the three species investigated share a set of common autofluorescent molecules that emit around 550 nm. In contrast, factor 2’s spectral shape and peak (600 to 650 nm) vary depending on which species are being observed [Figs. 1(a)–1(c)]. For example, C. albicans factor 2 peak is found at 600 nm, C. parapsilosis factor 2 peak is found at 650 nm, and, interestingly, C. glabrata factor 2 peak is broad (the peak encompasses 600 to 650 nm). When we examined autofluorescent emission from human serum alone, it did not match either factor found in the Candida samples and is not an obvious linear combination of the two factors [Fig. 1(d)]. Fig. 1MCR identified emission spectra of Candida species. (a–c) Two emission spectra that were derived from MCR analysis after 16 h of incubation with Candida species. (d) Emission spectra of human serum at 0 h incubation and 18 h of incubation to demonstrate that emission factors found in Candida samples are not due to emission of human serum. (a–c) Fungal emission spectra are composed from and (d) serum emission spectra composed from 1 sample at 0 h of incubation and 18 h of incubation.  Along with the spectral factors, the MCR analysis also returns concentration maps that indicate the relative abundance of each spectral factor. To determine if the spatial localizations of autofluorescence emissions were similar, these concentration maps were overlaid to create composite images, where the green and red color channels correspond to the independent concentration map corresponding to spectral factor 1 and 2, respectively. The composite images were then examined to see if the individual factor’s emission came from similar spatial localizations. We found that C. albicans factors were mostly spatially separated, whereas both C. glabrata and C. parapsilosis factors were found to be localized in the same general area within the cells. Next, we compared the spatial localization patterns between species and found unique patterns for each species (Fig. 2). In the case of C. albicans, we found very small features mostly composed of factor 1 that were on average around . For C. parapsilosis, we observed large features primarily composed of factor 2 that are on average around . However, features in C. glabrata images contained both factor 1 and factor 2 with an average area around 0.27 and , respectively. Remarkably, the majority of autofluorescence from C. parapsilosis comes from factor 2. Mean factor 2 intensity of the C. parapsilosis features was twofold greater than C. glabrata features and tenfold greater than C. albicans features. Similar trends are also observed when quantifying the other characteristics of C. parapsilosis autofluorescence. These differences in autofluorescence emission geometry as well as other autofluorescence characteristics allowed us to create a classifier from the spatial and spectral features of the autofluorescence emission that are unique to individual species. Fig. 2Representative R-G composite images of two autofluorescence factors of Candida species. The green channel reflects factor 1 signal and the red channel reflects factor 2 signal. Red boxes are to highlight autofluorescent feature within the fungal cells. Color channels in each image are scaled independently of each other, using a minimum to maximum scale to enhance visualization. Image size and magnification are the same for all images.  To create an image diagnostic algorithm based on the autofluorescence emission, we quantified multiple spatial and spectral characteristics of each of the autofluorescence signatures from the feature within the hyperspectral fluorescence images. To validate the accuracy of the classification tree, we measured three statistics for six levels of pruning using the training set (described in Materials and Methods) and plotted the accuracy of both the training set and test set [Figs. 3(a) and 3(b)]. The statistics and accuracy plot revealed some of the less pruned classification trees (i.e., larger classification trees) have a lower true predictive error, demonstrating that the full classification tree may have been overfitting and that the predictions reflected noise or outliers. The accuracy plot also depicted the pruning level (i.e., size of the classification tree) where the training set and test set diverged. Based on these results, we selected level 4 as the optimal pruning level. From the pruned tree, we were able to achieve 84% accurate species identification from the test set of data [Fig. 3(b)]. We were also able to observe which autofluorescent characteristics were used to construct the classification tree (Fig. 4). Interestingly, in this predictive model, factor 1 autofluorescent characteristics are more important than factor 2 characteristics for predicting the Candida species. We then calculated the predictive accuracy for identifying each species in the independent test set. The classification tree was able to predict 75% of C. albicans samples accurately, 88% of C. glabrata accurately, and 83% of C. parapsilosis accurately. On closer inspection of the results, it was found that C. albicans was misidentified twice, once with C. glabrata and once with C. parapsilosis. Whereas C. glabrata was found to only be misidentified with C. parapsilosis and C. parapsilosis misidentified with C. glabrata. Fig. 3Classification tree pruning. (a) Overfitting decreases the accuracy of the classification tree for the test set. Pruning level for classification tree was chosen by the divergence of the test set and training set, which corresponds with pruning level 4 (i.e., a 12 node classification tree). (b) Table displaying statistics for the different pruning levels of the classification tree. Bold statistics indicate chosen level for prediction analysis of the test set. 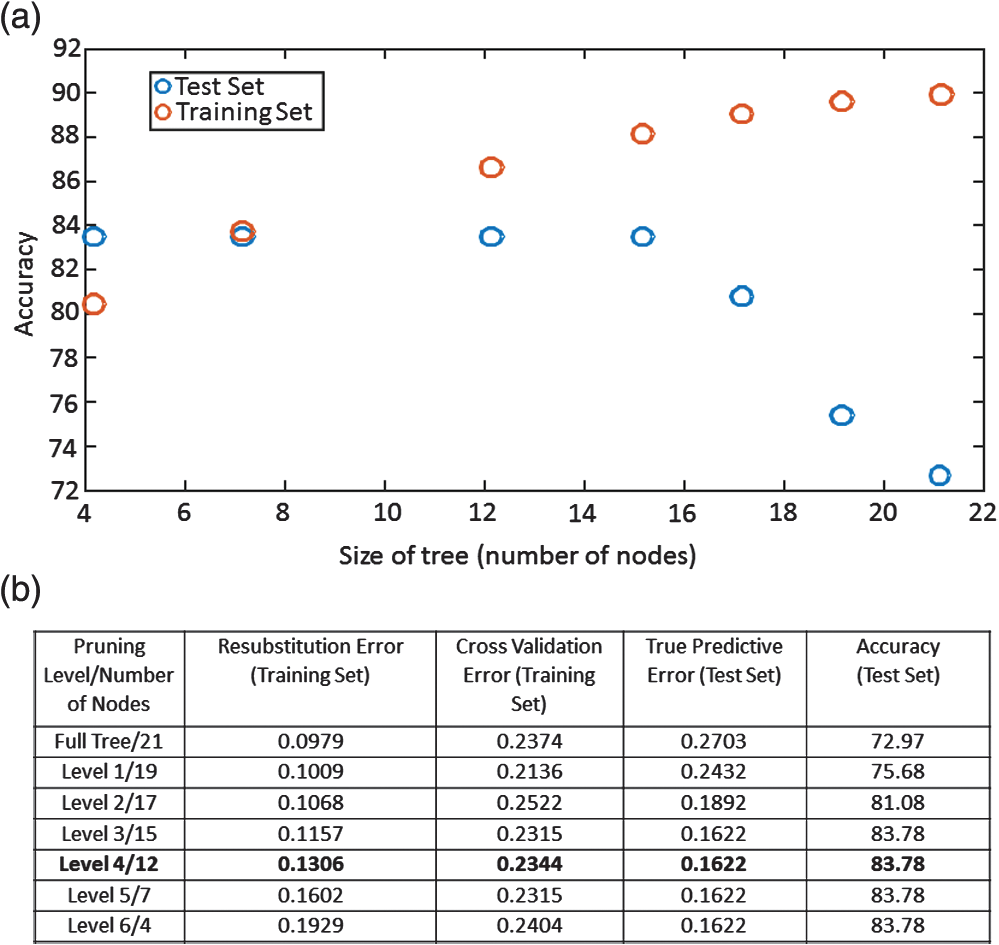 3.DiscussionCandida species are well known for their ability to cause morbidity and mortality. It is also known that some species, such as C. glabrata, have intrinsic resistances to azole-based antifungal drugs.17,18 Due to this, it is important to be able to quickly and accurately identify the pathogenic fungal species prior to administering treatment. The method we describe in this study takes advantage of the spatial and spectral resolution of HCFM. The ability to characterize the unique autofluorescence spectra in the different Candida species coupled with their spatial localizations has allowed for species level identification of Candida species yeasts grown in conditions that closely mimic pathological conditions and commonly available clinical specimen types. The serum growth condition was chosen and designed to be a model of growth conditions in blood. Most of the samples assayed for Candida in diagnostic reference laboratories are peripheral blood ( of specimens in our clinical isolate library) and the remainder are mostly medical devices in intimate contact with central circulation. Serum is a reasonable and tractable model for blood in that it contains all noncellular blood components except clotting factors. It is commonly used to study the response of Candida to growth in conditions that mimic growth in systemic circulation. Indeed, Candida species are known to respond to growth in serum with significant physiological changes, such as alterations of cell wall components19 as well as germination of filamentous cells in C. albicans. Therefore, we designed this condition to test whether growth in conditions mimicking those of clinical specimens would induce physiological changes in Candida that might alter its autofluorescence. These conditions would be more representative of the autofluorescence spectrum of Candida to be detected in clinical specimens relative to standard fungal culture medium growth conditions. Continuation of these studies into whole blood and direct visualization on catheter tips would be productive and promising ways to extend this work in the future. Emission of autofluoresence in fungi is commonly due to native fluorophores, such as flavins.20 Flavins and flavoproteins likely contribute to the fungal autofluorescence that we observed. Flavin compounds emit around 530 nm from 460 nm excitation,21 which match closely with our factor 1 peak wavelength and our excitation line. Flavin molecules also associate with the plasma membrane, intracellular granules, and mitochondria.22 We did not observe any autofluorescent signatures around the plasma membrane, but we did observe intracellular signatures for factor 1. For both C. albicans and C. glabrata, we detected small features for factor 1 leading to the possibility that we observed flavin molecules either in intracellular granules or mitochondria. Interestingly, when observed, factor 1 tended to be smaller in size than factor 2. Also, factor 1 tended to be located inside areas that also contained factor 2, leading us to speculate that factor 2 may be another native fluorophore, yet to be described, that occupies a similar subcellular compartment. By utilizing autofluorescent emission characteristics, the classification tree is able to accurately predict the Candida species, demonstrating the robustness of the procedure as a quick and accurate identification method. Under current conditions, the classification tree can identify 84% of samples accurately. It is generally appreciated that cell size varies in the Candida genus. For example, C. parapsilosis is on average 2 to 4 times larger than C. glabrata.23 However, in this current experiment, it was not possible to measure the area of the fungal cells with accuracy in an automated fashion. Future experiments with a membrane-specific contrast agent added to the medium just prior to imaging could improve the accuracy by incorporating information on the size of the cells. Previous studies have shown that by utilizing a single excitation source coupled with a monochromator and correlating microbial sample type with the intensity of emission at several wavelengths, it was possible to discriminate bacterial and fungal species.16 In contrast, our approach uses the entire emission spectrum from 500 to 850 nm to identify multiple component spectra in the specimens. Our results also extend earlier approaches by measuring autofluorescence events at the individual cell level, whereas other methods use a population-based approach and measure the overall autofluorescence signature of a population of cells. Finally, our approach utilizes identifying information from the subcellular spatial distribution of autofluorescence signals. Other molecular methods, such as fluorescent in situ hybridization (FISH), have been described both as quick and accurate.24 However, utilizing FISH requires that each species needing identification has its own unique probe as well as preparing the sample in such a way that the probe can enter the cell and a culture step to generate enough sample to work with. Because our method does not require large numbers of cells and is a label-free method, it may be usable on a minimally processed clinical specimen, perhaps even as a point of care diagnostic. As a potential method for identifying fungal pathogens, we provide comparisons to published data on performance of other diagnostic methods currently in use. These comparisons illustrate the advantages, primarily in terms of speed of diagnosis, of our method over certain current limitations with commonly used methods. However, we also point out that detection of fungi by autofluorescence is best thought of as an adjunctive diagnostic test to classical microbiology. These methods will still be required to confirm microbiological identification and to measure drug sensitivities. We think that as the autofluorescence method matures, more detailed effectiveness comparisons with other technologies would be a worthy subject of future investigation. In summary, currently deployed fungal species identification methods based on culture can range from 2 to 5 days depending on the method being used, which can cause complications related to delays in treatment. The laboratory investigation conducted demonstrates a 75% prediction accuracy for C. albicans, 88% prediction accuracy for C. glabrata, and 83% prediction accuracy for C. parapsilosis in clinically relevant media. The next step to determine robustness of this method will be to include clinical samples. Our work represents the first step toward developing a label-free method for rapid, culture-free identification of fungal species. If used parallel with traditional methods it could provide a guide for appropriate care at an earlier time and could reduce morbidity and mortality. 4.Methods4.1.Yeast Growth/PreparationC. albicans (ATCC, MYA-2876), C. glabrata (ATCC, 2001), and C. parapsilosis (ATCC, 22019) were grown from glycerol stock, stored at . Samples were grown in YPD, RPMI-1640 + 0.165M MOPS, or human serum (EMD Millipore, S1) for 16 h at 37°C in an orbital shaker at 250 rpm. Yeast were then put on microscope slides and sealed with nail polish. 4.2.Hyperspectral Confocal Fluorescence MicroscopyA custom built HCFM was used to acquire the autofluorescent emissions from the samples. Previous work describes the methodology for image acquisition using the custom built microscope.25 In summary, a 488-nm laser (Coherent, Inc. Sapphire) and a apochromat objective (Olympus Plan Apochromat, NA 1.4) were used to excite fluorescence from a diffraction-limited spot. The laser power was at the entrance to the microscope and the integration time was . To detect fluorescent emissions, a prism spectrometer coupled to an electron multiplying charged-coupled device camera (Andor Technologies, Inc., iXon) was used. 4.3.Spectral AnalysisAll images were preprocessed to remove known spectral artifacts introduced by the imaging system (cosmic ray spikes, detector offset, and structured dark noise),26 as well as to calibrate the wavelength axis. The resulting individual spectral images were combined into three composite image data sets, one for each Candida species. MCR was performed on each of these composite data sets to develop a spectral model that described more than 98% of the spectral variance. The MCR algorithm has been described previously27,28 and has demonstrated success in exploratory analysis to identify underlying spectral components from multicomponent biological systems.29,30 The MCR results identified near-identical spectral components regardless of the yeast species; therefore, a combined spectral model for all three species was deemed appropriate. This combined model was generated by performing MCR on a combined set of images from all three species and described of the spectral variance in the data. Classical least squares prediction was used to determine the location and abundance of each spectral component in the spectral images. Images corresponding to the location and abundance of individual spectral components were exported as Tif files for subsequent image processing. 4.4.ClassificationFiji (ImageJ) was used to threshold and quantify features. A threshold of three standard deviations above background intensity was used to extract features for all emission factors. Quantification of features was measured for total and average intensity per feature, average intensity variance per feature, total and average number of features per cell, and total and average area of features describing the nature of the autofluorescence in the cells. The characteristics were then compiled and input into a binary classification tree algorithm. A classification tree analysis was developed in MATLAB® using the statistics, and a machine learning toolbox (Mathworks, version 2015a) was then used to create the classification tree and accuracy statistics. To test the performance of the classifier, we divided the data into a training group of 337 cells and a test group of 37 cells (composed of 10% of each species population). To validate the accuracy of the classification tree, we measured three statistics: cross validation error, resubstitution error, and the true predictive error for six levels of tree pruning using the training set. To calculate the true error of prediction, the number of misclassifications in the test set was divided by the total number of samples in the training set. All data presented were pooled from triplicate biological replicates of samples. AcknowledgmentsWe appreciate the contributions of Michael Wester and the members of the Neumann lab. We also thank Michael Sinclair for use and maintenance of the hyperspectral confocal microscope and Howland D.T. Jones for the MCR software package. This work was supported by National Institutes of Health (NIH) Grant AI007538 (M.S.G), NIH Grant P50GM085273 supporting the Center for Spatiotemporal Modeling of Cell Signaling, NIH Grant R01AI116894 (A.K.N.), and NIH Director’s New Innovator Award Program 1-DP2-OD006673-01 (J.A.T.). Sandia National Laboratories is a multiprogram laboratory that is managed and operated by Sandia Corporation, a wholly owned subsidiary of Lockheed Martin Corporation, for the US Department of Energy’s National Nuclear Security Administration (contract No. DE-AC04-94AL85000). ReferencesS. Magill et al.,
“Multistate point-prevalence survey of health care-associated infections,”
N. Engl. J. Med., 370 1198
–1208
(2014). http://dx.doi.org/10.1056/NEJMoa1306801 NEJMAG 0028-4793 Google Scholar
N. Yapar,
“Epidemiology and risk factors for invasive candidaiasis,”
J. Ther. Clin. Risk Manage., 10 95
–105
(2014). http://dx.doi.org/10.2147/TCRM Google Scholar
S. R. Lockhart,
“Current epidemiology of Candida infection,”
Clin. Microbiol. Newsl., 36
(17), 131
–136
(2014). http://dx.doi.org/10.1016/j.clinmicnews.2014.08.001 CMNEEJ 0196-4399 Google Scholar
M. Pfaller and D. Diekema,
“Epidemiology of invasive candidiasis: a persistent public health problem,”
Clin. Microbiol. Rev., 20
(1), 133
–163
(2007). http://dx.doi.org/10.1128/CMR.00029-06 CMIREX 0893-8512 Google Scholar
O. Gudlaugsson et al.,
“Attributable mortality of nosocomial candidemia, revisited,”
Clin. Infect. Dis., 37
(9), 1172
–1177
(2003). http://dx.doi.org/10.1086/378745 IDIEL 1058-4838 Google Scholar
F. G. De Rosa et al.,
“Invasive candidiasis and candidemia: new guidelines,”
Minerva Anestesiol., 75
(7–8), 453
–458
(2009). MIANAP Google Scholar
R. P. Wenzel and M. B. Edmond,
“The impact of hospital-acquired bloodstream infections,”
Emerg. Infect. Dis., 7 174
–177
(2001). http://dx.doi.org/10.3201/eid0702.010203 Google Scholar
M. Morrell, V. Fraser and M. Kollef,
“Delaying the empiric treatment of Candida bloodstream infection until positive blood results are obtained: a potential risk factor for hospital mortality,”
Antimicrob. Agents Chemother., 49
(9), 3640
–3645
(2005). http://dx.doi.org/10.1128/AAC.49.9.3640-3645.2005 Google Scholar
K. Garey et al.,
“Time to initiation of flucanazole therapy impacts mortality in patients with candidemia: a multi-institutional study,”
Clin. Infect. Dis., 43
(1), 25
–31
(2006). http://dx.doi.org/10.1086/cid.2006.43.issue-1 CIDIEL 1058-4838 Google Scholar
M. Kami et al.,
“Effect of fluconazole prophylaxis on fungal blood cultures: an autopsy-based study involving 720 patients with haematological malignancy,”
Br. J. Haematol., 117
(1), 40
–46
(2002). http://dx.doi.org/10.1046/j.1365-2141.2002.03414.x BJHEAL 0007-1048 Google Scholar
J. Berenguer et al.,
“Lysis-centrifugation blood cultures in the detection of tissue-proven invasive candidiasis disseminated versus single-organ infection,”
Diagn. Microbiol. Infect. Dis., 17
(2), 103
–109
(1993). http://dx.doi.org/10.1016/0732-8893(93)90020-8 DMIDDZ 0732-8893 Google Scholar
S. Patino et al.,
“Autofluorescence of mycobacteria as a tool for detection of Mycobacterium tuberculosis,”
J. Clin. Microbiol., 46
(10), 3296
–3302
(2008). http://dx.doi.org/10.1128/JCM.02183-07 JCMIDW 1070-633X Google Scholar
C. Margo and T. Bombardier,
“The diagnostic value of fungal autofluorescence,”
Surv. Ophthalmol., 29
(5), 374
–376
(1985). http://dx.doi.org/10.1016/0039-6257(85)90114-6 SUOPAD 0039-6257 Google Scholar
I. Miranada-Lorenzo et al.,
“Intracellular autofluorescence: a biomarker for epithelial cancer stem cells,”
Nat. Methods, 11
(11), 1161
–1169
(2014). http://dx.doi.org/10.1038/nmeth.3112 1548-7091 Google Scholar
V. Jayaprakash et al.,
“Autofluorescence-guided surveillance for oral cancer,”
Cancer Prev. Res., 2
(11), 966
–974
(2009). http://dx.doi.org/10.1158/1940-6207.CAPR-09-0062 Google Scholar
J. D. Walsh et al.,
“Rapid intrinsic fluorescence method for direct identification of pathogens in blood cultures,”
MBio, 4
(6), e00865
(2013). http://dx.doi.org/10.1128/mBio.00865-13 Google Scholar
Z. Khan et al.,
“Emergence of resistance to amphotericin B and triazoles in Candida glabrata vaginal isolates,”
J. Chemother., 20 488
–491
(2008). http://dx.doi.org/10.1179/joc.2008.20.4.488 Google Scholar
A. Panackal et al.,
“Clinical significance of azole antifungal drug cross-resistance in Candida glabrata,”
J. Clin. Microbiol., 44
(5), 1740
–1743
(2006). http://dx.doi.org/10.1128/JCM.44.5.1740-1743.2006 JCMIDW 1070-633X Google Scholar
D. Lowman et al.,
“Mannan structural complexity is decreased when Candida albicans is cultivated in blood or serum at physiological temperature,”
Carbohydr. Res., 346
(17), 2752
–2759
(2011). http://dx.doi.org/10.1016/j.carres.2011.09.029 CRBRAT 0008-6215 Google Scholar
S. Siano and R. Mutharasan,
“NADH and flavin fluorescence responses to starved yeast cultures to substrate additions,”
Biotechnol. Bioeng., 34
(5), 660
–670
(1989). http://dx.doi.org/10.1002/(ISSN)1097-0290 BIBIAU 0006-3592 Google Scholar
H. Bhatta and E. M. Goldys,
“Characterization of yeast strains by fluorescence lifetime imaging microscopy,”
FEMS Yeast Res., 8
(1), 81
–87
(2008). http://dx.doi.org/10.1111/j.1567-1364.2007.00340.x Google Scholar
A. Kindzelskii and H. R. Petty,
“Fluorescence spectroscopic detection of mitochondrial flavoprotein redox oscillations and transient reduction of the NADPH oxidase-associated flavoprotein in leukocytes,”
Eur. Biophys. J., 33
(4), 291
–299
(2004). http://dx.doi.org/10.1007/s00249-003-0361-4 EBJOE8 0175-7571 Google Scholar
S. Silva et al.,
“Candida glabrata, Candida parapsilosis and Candida tropicalis: biology, epidemiology, pathogenicity and antifungal resistance,”
FEMS Microbiol. Rev., 36
(2), 288
–305
(2012). http://dx.doi.org/10.1111/j.1574-6976.2011.00278.x FMREE4 0168-6445 Google Scholar
G. Borekci et al.,
“Identification of Candida species from blood cultures with fluorescent in situ hybridization (FISH), polymerase chain reaction-restriction fragment length polymorphism (PCR-RFLP) and conventional methods,”
Med. J. Trak. Univ., 27
(2), 183
–191
(2009). http://dx.doi.org/10.5174/tutfd.2009.01700.1 Google Scholar
M. B. Sinclair et al.,
“Hyperspectral confocal microscope,”
Appl. Opt., 45
(24), 6283
–6291
(2006). http://dx.doi.org/10.1364/AO.45.006283 APOPAI 0003-6935 Google Scholar
H. D. T. Jones et al.,
“Preprocessing strategies to improve MCR analyses of hyperspectral images,”
Chemom. Intell. Lab. Syst., 117 149
–158
(2012). http://dx.doi.org/10.1016/j.chemolab.2012.01.011 Google Scholar
J. Ohlhausen et al.,
“Multivariate statistical analysis of time-of-flight secondary ion mass spectrometry images using axsia,”
Appl. Surf. Sci., 231–232 230
–234
(2004). http://dx.doi.org/10.1016/j.apsusc.2004.03.020 ASUSEE 0169-4332 Google Scholar
J. Schoonover, R. Marx and S. Zhang,
“Multivariate curve resolution in the analysis of vibrational spectroscopy data files,”
Appl. Spectrosc., 57
(5), 154A
–170A
(2003). http://dx.doi.org/10.1366/000370203321666461 APSPA4 0003-7028 Google Scholar
R. Davis et al.,
“Accurate detection of low levels of fluorescence emission in autofluorescent background: Francisella infected macrophage cells,”
Microsc. Microanal., 16
(4), 478
–487
(2010). http://dx.doi.org/10.1017/S1431927610000322 MIMIF7 1431-9276 Google Scholar
W. Vermass et al.,
“In vivo hyperspectral confocal fluorescence imaging to determine pigment localization and distribution in cyanobacterial cells,”
Proc. Natl. Acad. Sci. U. S. A., 105
(10), 4050
–4055
(2008). http://dx.doi.org/10.1073/pnas.0708090105 Google Scholar
BiographyMatthew S. Graus is a doctoral candidate at the University of New Mexico, School of Engineering in the Department of Nanoscience and Microsystems Engineering. He received his Bachelor of Science degree in biology and his Master of Science degree in nanoscience and microsystems engineering from the University of New Mexico in 2008 and 2012, respectively. His doctoral work involves imaging and quantifying the nanoscale architecture of cell wall components of the pathogenic fungus Candida. Aaron K. Neumann received his PhD in immunology from the University of Pennsylvania, Philadelphia, Pennsylvania in 2005 and has been an assistant professor of pathology at the University of New Mexico, School of Medicine, Albuquerque, New Mexico, since 2012. He investigates host pathogen interactions between innate immunocytes and Candida species fungal pathogens, focusing on the biophysics of cell wall organization and receptor signaling using a variety of quantitative fluorescence approaches. Jerilyn A. Timlin received her PhD in analytical chemistry from the University of Michigan, Ann Arbor, Michigan, in 2000. She is a distinguished member of the Technical Staff in the Bioenergy and Defense Technologies Department at Sandia National Laboratories, Albuquerque, New Mexico. Her research uses fluorescence, Raman, and FTIR spectral imaging, multivariate image analysis, and super-resolution techniques to elucidate complex spatial–temporal relationships of a variety of biomolecules that drive key biological processes. |