
|
|
1.IntroductionInvasive cancer of the uterine cervix (ICC) represents one of the most frequent malignancies in women accounting for 10% of all cancer-related deaths. Worldwide, women are newly diagnosed with ICC every year and women die from the disease.1,2 Cervical intraepithelial neoplasia (CIN) precedes invasive cancer of the uterine cervix and its detection and treatment can prevent the progression toward ICC. The implementation of screening programs has led to a decline in the number of cervical cancer related deaths.3,4 Screening is usually performed by obtaining cervical cytology with the intention to discriminate between mild dysplasia like low-grade squamous intraepithelial lesions (LSIL) and high-grade squamous intraepithelial lesions (HSIL) that require active treatment. However, a definite distinction between LSIL and HSIL can only be made histologically. Therefore, women with cervical cytology suspicious for HSIL are invited to undergo a colposcopic examination combined with biopsies and histologic evaluation. Colposcopy offers a sensitivity between 61% and 95% and a specificity of 50% to 85% resulting in a high number of unnecessary biopsies and overtreatment.5,6 Therefore, the implementation of advanced colposcopy techniques that allow a rapid and noninvasive evaluation of the cervix would be a vast improvement in the prevention of ICC. Optical coherence tomography (OCT) is an imaging technique that uses near-infrared light interferometry to measure the intensity of backscattered light. By providing cross-sectional subsurface images in real time with high spatial resolution, OCT permits the characterization of microarchitectural features and fills an important gap between established imaging modalities.7,8 Even though the imaging depth of OCT is limited to a few millimeters due to optical attenuation from tissue scattering and absorption, its resolution is 10 to 100 times higher than standard ultrasound. As the imaging depth is in the same scale as typically covered by conventional biopsy, OCT has the potential to act as a type of optical biopsy to guide interventional procedures and thus reduce sampling errors or even replace surgical biopsy, where it is impracticable.9–11 The research groups of James G. Fujimoto, Rebecca Richards-Kortum, and Jerome L. Belinson have led the way for OCT imaging of the female reproductive tract. Pitris et al.12 examined normal and neoplastic cervical tissue in vitro and concluded that an intact basement membrane optically dividing epithelium and stroma can be seen as the main feature of healthy tissue. The first in vivo study was published by Escobar et al.,13,14 who confirmed an intact basement membrane dividing epithelium and stroma as a marker for healthy epithelium.13,14 Furthermore, they defined criteria to distinguish between moderate and severe dysplasia, invasive carcinoma, and inflammation. Zuluaga et al.15 examined the backscattering intensity of normal and abnormal cervical epithelium and found that the average epithelial brightness increased with the degree of dysplasia. Lee et al.16 applied a polarization sensitive OCT technique in vitro and found that the degree of circular polarization decayed faster in progressed CIN. Quantifying this decay allowed to differentiate between low-grade and high-grade lesions with a sensitivity and specificity of 95% and 71%, respectively.16 In an attempt to replace visual image interpretation, Kang et al.17 developed an automated algorithm to extract OCT image features in order to differentiate between mild and severe dysplasia.17 Wulan et al.18 and Liu et al.19 presented cross-sectional comparative trials carried out in rural China using real-time OCT imaging as an adjunct to colposcopy and unaided visual inspection using acetic acid. By combining OCT and colposcopy, the sensitivity for CIN2 or higher decreased from 60% to 29% while the specificity increased from 83% to 93%. Almost all investigations refer to the squamous epithelium of the ectocervix and the transformation zone. The latter is defined as the area bounded by the original and the active squamocolumnar junctions. In this area, the columnar epithelium has been replaced and/or is being replaced by new metaplastic squamous epithelium. Once the metaplasic epithelium is mature, its aspect will be identical to original squamous epithelium. Evaluating the transformation zone is of great importance, as this is the site of origin for more than 90% of precancerous lesions. The columnar epithelium of the endocervix rests on an inconspicuous layer of reserve cells and has complex infoldings that resemble glands or clefts on cross section. Even when using an endoscopic probe, OCT imaging of the narrow endocervical canal is difficult and inconsistent. Depending on their resolution, OCT images of normal squamous epithelium reveal either a two-layer architecture with a sharp interface between epithelium and stroma or a three-layer architecture with two epithelial layers and the stroma. The basement membrane itself is not visible but causes the sharp interface between epithelium and stroma. In contrast, HSIL (CIN3) are characterized by an increasing irregularity of the epithelial layer and the loss of layer architecture (Fig. 1). Fig. 1(a) Histological image of normal cervical squamous epithelium. The cervix consists of epithelium (EP) and underlying stroma (ST). The nonkeratinizing stratified squamous epithelium is composed of several layers (basal, parabasal, intermediate, and superficial layer). The basal layer consists of a single row of cells and rests on a thin basement membrane (BM). Mitosis occurs in this layer (hematoxylin and eosin staining, magnification x100). (b) OCT image of normal cervical squamous epithelium taken with the Niris® imaging system using an endoscopic probe with direct contact to the epithelial surface. It shows a well organized three-layer architecture consisting of two epithelial layers (bright superficial layer, darker basal layer) and the stroma (optical structure). The thin basement membrane (BM) separating epithelium (EP) and stroma (ST) cannot be resolved by OCT but causes a sharp interface between the two layers (length of the white bar: 1 mm). (c) Histological image of HSIL (CIN3). Immature hyperchromatic cells involve almost the entire thickness of the epithelium. There is a complete disorganization of growth pattern and lack of stratification. The epithelium is variable in thickness, the junction between the epithelium and the underlying stroma is regular. (d) OCT image of HSIL (CIN 3) lesion. The intensity of the epithelial layer increases with less-organized layer architecture. The cells seem to attempt to push their way toward the surface as vertical columns. The basement membrane separating epithelium and stroma cannot be recognized anymore.  In recent years, we investigated OCT imaging in vivo as an adjunct to colposcopy and were able to demonstrate the accuracy and reproducibility of this technique in the characterization of CIN.20,21 The Niris® imaging system (Imalux Corporation, Cleveland, Ohio) used at that time provided a reusable fiber-optic probe with a diameter of 2.7 mm and a lateral scanning range of 1.6 to 2.4 mm. The probe had to be used in direct contact with the tissue and was well tolerated by all patients. However, in the routine colposcopy setting, the Niris® system with its endoscopic probe did not allow to systematically investigate larger tissue areas, such as the complete transformation zone or to define borders between dysplastic and normal epithelium. Integration of OCT into a surgical microscope or for gynecological purposes into a colposcope may have the advantage of providing cross-section imaging of larger tissue areas within the range of the microscope’s magnification without interrupting the workflow. The simultaneous evaluation of large tissue areas would become possible and OCT imaging could be focused on microscopically conspicuous epithelium in order to estimate the grade of dysplasia, to define its edges, and to guide biopsies. The combination of spectral domain optical coherence tomography (SD-OCT) with a surgical microscope has been used to identify laryngeal epithelial dysplasia.22 During microlaryngoscopy, OCT-guided biopsies were taken from microscopically suspicious areas and the OCT images compared to the corresponding histology. OCT allowed to differentiate between benign laryngeal lesions and dysplasia with a sensitivity of 88% and a specificity of 89%. Another study assessed microscope based SD-OCT in order to detect microanatomical changes of the tympanic membrane in chronic myringitis.23 Following neurosurgical tumor resection, it has been shown that overlaying microscopy images with subsurface information from OCT could lead to improved detection of residual tumor cells in the resection cavity.24 The purpose of this study was to evaluate the feasibility of a surgical microscope-based OCT device to detect and characterize CIN. 2.Material and MethodsThis prospective single-institution ex vivo study was approved by the local institutional ethical review committee. Informed written consent was obtained from all patients. 2.1.Optical Coherence Tomography MicroscopyOCT imaging was carried out using an OCT-camera (OptoMedical Technologies GmbH, Lübeck, Germany) integrated in a surgical microscope optimized for light transmission in the near-infrared spectral range (HS Hi-R1000G, Haag-Streit Surgical GmbH, Wedel, Germany).25 Figure 2 illustrates that the OCT is handled like a normal CCD camera. Like a conventional CCD camera, the OCT camera uses microscope optics and its handling is optimized for intraoperative use. The OCT working distance and focus is motorized and calibrated to be the same as for the surgical microscope. Therefore, the change of the working distance and the magnification is conveniently handled via the surgical microscope handle switch. Like the CCD camera image, the OCT image is displayed in real time. The OCT scan position and the OCT image is injected as a transparent overlay in the microscope view for both eyes (marked “d” in Fig. 2). If the OCT is not needed, the OCT image injection can easily be switched off by the microscope handle switch. Using the microscope handle switch, the microscope with its OCT can simply be brought into the region of interest. In addition, the OCT is imaged on a small touch screen monitor (marked “c” in Fig. 2). The MIOS5 archive (Haag-Streit Surgical GmbH, Wedel, Germany) shows and records synchronous videos and snapshots of the CCD and the OCT camera, which are assigned to each patient (marked “e” in Fig. 2). Therefore, it is easy to assign corresponding images of the OCT and conventional CCD camera in retrospect. Fig. 2Photo of (a) OCT-camera head connected to the camera port of the (b) surgical microscope, with a (c) small touch screen monitor to handle the OCT, with (d) OCT image injection in the microscope view for both eyes, and an (e) archive device to save synchronious CCD camera and OCT camera images.  The OCT-camera head (marked “a” in Fig. 2) is specially designed with a two-axis scanner and an optical aperture, which is optimized to the optical specifications of the operating microscope and its side view. The OCT camera consists of a light source at a central wavelength of 840 nm with a spectral bandwidth of 55 nm, a SD-OCT detector, and a motorized OCT reference optics. The system enables 10 OCT pictures per second with 1000 OCT A scans per OCT picture. The reference optics permits to use the OCT at different working distances ranging from 220 to 500 mm. The OCT camera provides an optical window depth of 4.2 mm. The measured axial resolution is in air and about inside tissue. The lateral scan width depends on the magnification of the microscope and varies from 5 mm up to 37 mm [Fig. 3(a)]. The lateral resolution ranges from up to at a working distance of 232 mm depending on the microscope magnification. The shorter the working distance, the better is the lateral iOCT resolution [Fig. 3(b)]. In OCT, a high lateral resolution leads to a small depth of field, and hence a small window depth.25,26 In order to achieve an OCT window depth of 4.2 mm, the lateral resolution in our device is larger than . Tissue surfaces are usually uneven and the small tissue structures and layers will be averaged within the focus diameter. As with conventional CCD cameras, the OCT camera provides an overview and an indication of the interesting region at a lower magnification. For details in the region of interest, it is necessary to switch to a higher microscope magnification. In this study, we used a working distance between 220 and 260 mm at a magnification between zoom value and Fig. 3(a) Calculated lateral OCT scan range depending on the magnification of the surgical microscope HS Hi-R1000G at a working distance of 232 mm and (b) lateral OCT resolution depending on the working distance at highest magnification of the surgical microscope HS Hi-R1000. 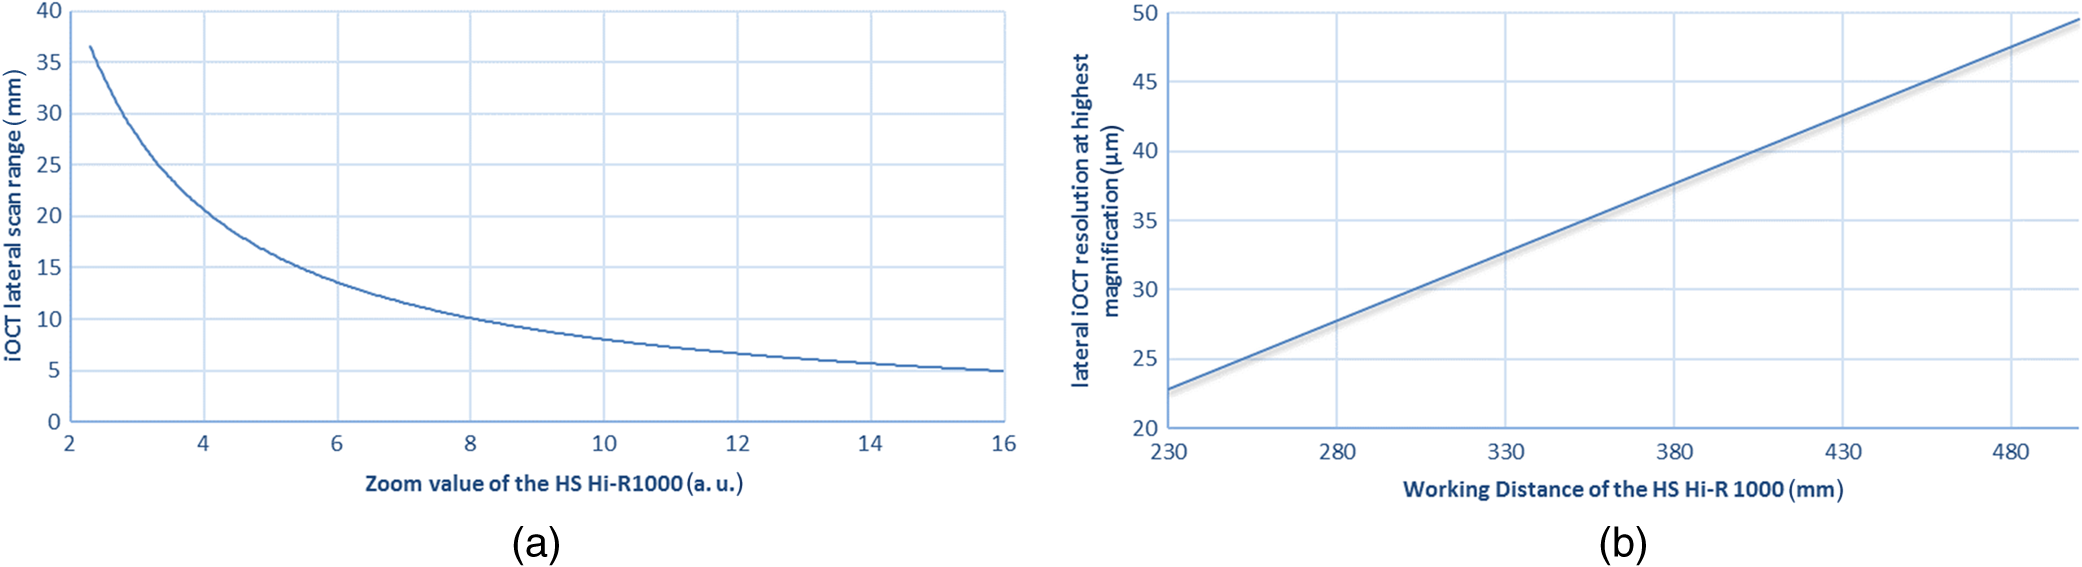 The OCT images in real time. It is possible to perform a three-dimensional (3-D) volume scan, which consists of 30 single OCT pictures and takes about 3 s. In this study, the 3-D OCT volume scan was used to identify the best imaging position. Out of a scan, the OCT image with the best image quality was selected and then used for further analysis. The saved single OCT image consists of 1000 pixels (lateral) by 1024 pixels (axial). Therefore, the axial pixel distance is in air and inside tissue with an index of refraction of 1.34. The lateral pixel distance depends on the magnification of the surgical microscope [Fig. 3(a)]. 2.2.Sample PreparationsLoop electrosurgical excision procedure (LEEP) specimens between 1.6 and 2.3 cm in diameter were obtained from 20 women with a mean age of 37.8 years (24 to 72 years). Sixteen women were premenopausal while 18 women were human papillomavirus high risk positive. The indication for conization was based upon a histologically proven CIN3. The specimens had a size between 1.8 and 2.6 cm in diameter depending on the size of the portio. OCT microscopy was carried out immediately after the operation. All specimens were marked at 12 o’clock and divided into four quadrants. A total of 160 OCT images were taken under microscopic guidance, two in each quadrant. Figure 4 shows a conization sample, in which the radial alignment of the scanned areas is indicated. The exact positioning depended on pathological findings within the quadrant. All images were specified according to the number of the specimen (1 to 20), the quadrant (1 to 4), and the localization within the quadrant (e.g., 1 o’clock, 2 o’clock). The histological examination was carried out systematically in knowledge of the scanned areas and comprised all four quadrants. Fig. 4Example of the scanned areas of a LEEP specimen. All specimens were marked at 12 o’clock and divided into four quadrants. In each quadrant, two radially aligned areas were scanned. The exact positioning depended on pathological findings within the quadrant. All images were specified according to the number of the specimen (1 to 20), the quadrant (1 to 4), and the localization within the quadrant (e.g., 1 o’clock, 2 o’clock).  First, 60 OCT images were randomly chosen to define reproducible criteria in order to distinguish between normal epithelium, mild dysplasia (LSIL), and HSIL. The remaining 100 images were blinded with respect to their origin and analyzed independently by two investigators using the previously defined criteria. The OCT findings were later compared with the corresponding histology. 2.3.StatisticsSensitivity and specificity with regard to the correct identification of HSIL were calculated as TP (true positive)/TP + FN (false negative) and TN (true negative)/TN + FP (false positive), respectively. TP results were defined as OCT images of HSIL that were correctly identified. TN results were defined as OCT images that were correctly identified as normal epithelium or mild dysplasia (LSIL). FP results were defined as OCT images of normal epithelium or LSIL that were identified as HSIL. FN results were defined as OCT images of HSIL that were not identified as such. The combination of normal findings and LSIL is reasonable as minor dysplastic changes have no therapeutic consequence while HSIL require further diagnostic and therapeutic assessment. The interinvestigator agreement was assessed by using Cohen’s kappa statistics.27 Unweighted kappa was estimated by comparing all diagnostic categories. The kappa value was interpreted as specified by Malpica et al.28 (0.0 to 0.2 indicates slight agreement, 0.2 to 0.4 fair agreement, 0.4 to 0.6 moderate agreement, 0.6 to 0.8 substantial agreement, and 0.8 to 1.0 almost perfect agreement). 3.ResultsFirst, 60 randomly chosen images were used to define reproducible criteria to determine the different grades of cervical dysplasia. The established criteria defined for the Niris® imaging system with its endoscopic probe being in direct tissue contact could not be applied as the images of the new OCT microscope were generated at working distances ranging from 220 to 260 mm. Depending on the magnification of the microscope, the lateral scan width ranged from 5 to 20 mm with direct influence on the lateral resolution. It quickly became apparent that a sharp interface between epithelium and stroma representing the basement membrane was the only criterion but was also a well reproducible and clinically important criterion to distinguish between LSIL and HSIL (CIN2 or worse). Therefore, we defined two groups:
Fig. 5(a) OCT image of normal epithelium generated with the OCT microscope. There is a well-organized two layer architecture with a sharp interface between epithelium and stroma representing the thin basement membrane (length of the bar: 1 mm). (b) The corresponding histology shows the typical pattern of normal squamous cervical epithelium [see also Fig. 1(a)]. (c) OCT image of CIN3. The sharp interface separating epithelium and stroma cannot be visualized anymore. Irregularity of the epithelial layer can be observed (length of the bar: 1 mm). (d) Histological image of HSIL (CIN3). Immature cells involve almost the entire thickness of the epithelium. There is a complete disorganization of growth pattern and lack of stratification.  In a second step, the remaining 100 OCT images were blinded with respect to their origin to preclude identification. Two investigators blinded for the histologic diagnosis evaluated each OCT image independently applying the criteria defined. The results were compared to the corresponding histology. The results are presented in the contingency Table 1. With 50 (48) TP, 11 (12) FP, 7 (9) FN, and 24 (22) TN results, the sensitivity calculates to 88% (84%) and the specificity to 69% (65%), respectively. Table 1Correlation between OCT findings and corresponding histology (n=100). The results of investigator 2 are shown in brackets. The investigators were unable to assess 8 (9) OCT images due to their poor quality.
The two investigators were unable to reasonably evaluate 8 (9) OCT images due to artifacts, incomplete scanning, and technical problems in focusing the epithelial surface. Most of these problems occurred in the early phase of the study and the quality of the images improved as our experience increased. The unweighted kappa comparing all diagnostic categories (normal epithelium/LSIL, HSIL, no evaluation possible) was 0.85 (0.95 confidence interval 0.75 to 0.95), indicating a substantial agreement between both investigators (Table 2). Table 2The interinvestigator agreement was assessed by calculating the Kappa (κ) coefficient from the ratings of each investigator for each OCT image seen.
Note: Unweighted Kappa 0.85 (0.95 confidence interval 0.75 to 0.95). 4.DiscussionPrevious studies using the Niris® imaging system with its endoscopic probe in direct contact to the epithelial surface have shown that the OCT microstructure associated with normal cervical squamous epithelium shows a well-organized three-layer architecture consisting of two epithelial layers and the stroma [Fig. 1(a)].13,20,21 The basement membrane itself is too thin to be resolved by OCT but is responsible for the sharp interface between epithelium and stroma. In the case of mild dysplasia (CIN1), the optical boundary between epithelium and stroma is still intact but may be less clear. With dysplasia progressing, irregularity of the epithelial layer can be observed and the cells appear to push their way toward the surface as vertical columns. The tissue microstructure is no longer organized and a basement membrane cannot no longer be defined [Fig. 1(c)].13,20,21 These previously defined criteria were not all seen with the SD OCT microscope used in the present study. Normal squamous epithelium was characterized by a two-layer architecture with the basement membrane dividing epithelium and stroma. Different layers within the epithelium were not seen. It was impossible to differentiate between normal epithelium and LSIL (CIN1). However, in the majority of cases, we were able to identify HSIL (CIN2/CIN3) by the disappearance of the basement membrane and loss of structure. This is of great importance in a clinical setting. Furthermore, in several cases, we were able to identify the boundary between normal and dysplastic epithelium, which could improve the accuracy of biopsies during colposcopy (Fig. 6). Fig. 6OCT image showing the boundary between normal epithelium or mild dysplasia (left) and moderate to severe dysplasia (right). The arrow shows the intact basement membrane (B) which is dissolved on the right. In normal squamous epithelium the basement membrane causes a sharp interface between epithelium (poorer scattering) and stroma (brighter scattering). This can be well seen in the middle part of the image. The leftmost 20% of the image does not present this sharp interface. This is due to the uneven surface of the specimen and poor focusing in this area. The rightmost 40% does not have a layered structure with a sharp interface distinguishing between less scattering epithelium and highly scattering stroma. The tissue appears as a homogenous highly backscattering region as can also be seen in Fig. 5(b). Therefore, per developed rules, this image would be classified as normal squamous epithelium on the left side and HSIL on the right side (length of the bar: 1 mm).  The interpretation of OCT images largely depends on the investigator’s experience and is subject to a learning curve similar to that of interpreting other imaging techniques. The present evaluation carried out by two experienced investigators showed a sensitivity of 88% (84%) and a specificity of 69% (65%) in detecting high-grade dysplasia. These results are similar to those of previous studies.6,7 However, with only 100 OCT images included, the calculation of sensitivity and specificity should be judged with caution. Regarding the inter-rater reliability, there has been substantial agreement between both investigators. A kappa of 0.85 confirms a good reproducibility of the criteria to evaluate the OCT images.28 These results are unremarkable as both investigators defined the criteria to differentiate between mild and severe dysplasia. The present study has several limitations. The large number of FP results leading to a low specificity 69% (65%) is most likely caused by overinterpreting the OCT images. Although blinded to colposcopy and histology results, both investigators were aware that the LEEP procedures had been carried out for severe dysplasia. As we gained our results from a very selected group of patients, the percentage of histologically normal findings was only 38%. Furthermore, there were no specimens with carcinoma in the group. However, as we know from previous studies, invasive carcinoma is characterized by a complete lack of layer architecture. Similar to CIN3, the basement membrane cannot be defined optically. The 7(9) FN cases are a matter of concern. Even presuming that there may have been a mismatch between OCT image and corresponding histology in particular cases, the number remains high and could have a negative impact on a wider implementation of the technique. The images were reanalyzed, but in only 2(3) cases did the investigators reconsidered their initial opinion. We observed similar FN rates in our previous studies without being able to identify the reasons. However, in a clinical setting with an OCT microscope/colposcope, there would be the possibility to compare problematic OCT images to the corresponding colposcopic impression in real time. Furthermore, we hope that refinement of OCT technology may provide further criteria for differentiations. Most important, the combination of SD OCT and microscopy facilitates the evaluation of large tissue areas. While the microscope selects the regions of interest, OCT simultaneously estimates the grade of dysplasia or defines its extension. The zoom function of the microscope allows a sixfold magnification altering the scan range from 4 to 24 mm. The lateral resolution is affected by the width of the beam focus and the depth of imaging, therefore, it depends on the magnification and the working distance of the microscope. Due to the long working distance, the waist of the beam focus cannot be as small as with a normal microscope objective and allows a resolution of . This leads to a Rayleigh length of about , and hence to no significant variations in lateral resolution throughout the depth of the image. Despite the limited lateral resolution, it was possible to define the basement membrane and to differentiate between normal epithelium and high-grade CIN in most cases. Combining OCT and colposcopy represents only one of several new concepts to improve current colposcopy. Computerized colposcopy intents to apply diagnostic image analysis in order to automate cervical evaluation. Mehlhorn et al.29 developed an image-processing method, which characterizes surface structures, such as color or texture and report a sensitivity of 85% and a specificity of 75% for the detection of high-grade cervical dysplasia. Vercellino et al.30 used a high-definition (HD) laparoscopic camera to replace the colposcope and achieved a sensitivity and specificity for the detection of CIN2 or worse of 90% and 77%, respectively. Fluorescence and reflectance spectroscopy combine two methods of spectrum analysis that detect biochemical and structural changes during carcinogenesis. Several studies have evaluated the use of this combination in vivo reporting a sensitivity of 71% to 100% and a specificity of 50% to 81% for detection of high-grade cervical dysplasia.31–35 Dynamic spectral imaging analyzes the acetowhitening effect of acetic acid indicating the severity of cervical dysplasia. Balas et al.36 compared the intensity of backscattered light before and after application of acetic acid and generated maps of the cervix to illustrate the areas of maximum alteration in tissue light scattering. Soutter et al.37 analyzed the changes in reflectance over time and developed an algorithm to assign the maximum changes to the corresponding epithelium. Dynamic spectral imaging achieves a sensitivity and specificity of and 83%, respectively. Other techniques such as electrical impedance spectroscopy or confocal microscopy provide information at the cellular level to assess histological changes.38–42 Due to its size, the SD-OCT microscope used in this study is not suitable for the setting of a colposcopy clinic, but the general concept of integrating an OCT device into a colposcope is intriguing and may have important advantages over OCT scanning conducted via probes. At present, it seems to be premature to assume that the development of an OCT colposcope may have an impact on standard colposcopy. However, compared with other available imaging techniques, such as ultrasound, computed tomography, or magnetic resonance imaging, OCT offers the highest level of resolution of tissue microarchitecture. Further refinement of this technology may lead to improvements in axial and lateral resolution and result in a better differentiation of cervical dysplasia. Combined with fast 3-D scanning, which would allow to scan large areas and to assess the whole ectocervix, the identification of precancerous and cancerous cervical lesions could be further improved. The use of polarization-sensitive OCT would allow to generate depth-resolved depolarizarion profiles, which could provide further criteria for differentiations. Therefore, OCT integrated into a colposcope may have the potential to improve colposcopic examination of the cervix. 5.ConclusionIn this initial ex vivo study, we could demonstrate that OCT microscopy is capable of scanning epithelial tissue up to a length of 12 mm. In clinical terms, this would allow for full screening of the cervical transformation zone within a reasonable time. We defined criteria for these new and different OCT images in order to distinguish LSIL from HSIL and were able to diagnose HSIL with a sensitivity of . The OCT microscope applied in this series has initially been developed for neurosurgical operations and is not suitable for gynecological purposes. However, the basic idea to combine OCT and microscopy may lead to the development of OCT being integrated into a colposcope. Such a device could have the potential to improve the identification and clinical management of precancerous and cancerous cervical lesions. AcknowledgmentsDr. Gallwas reports nonfinancial support from OptoMedical Technologies GmbH during the conduct of the study. E. Lankenau is CEO of the company and supported the study with free equipment for OCT microscopy. We would like to thank Dr. Susanna Mueller, Institute of Pathology of the University of Munich, for carrying out the histological evaluation and providing the images. References, “Incidence, mortality and survival database,”
(2016) www.who.int/cancer/ ( September ). 2016). Google Scholar
J. Ferlay et al., GLOBOCAN 2012 v1.0, Cancer Incidence and Mortality Worldwide: IARC CancerBase No. 11. Lyon, International Agency for Research on Cancer, France
(2013). Google Scholar
N. Santesso et al.,
“World Health Organization Guidelines: treatment of cervical intraepithelial neoplasia 2–3 and screen and treat strategies to prevent cervical cancer,”
Int. J. Gynecol. Obstet., 132
(3), 252
–258
(2016). http://dx.doi.org/10.1016/j.ijgo.2015.07.038 Google Scholar
C. K. Bose,
“Cancer screening for women in developing countries,”
Nature, 459
(7247), 641
–641
(2004). http://dx.doi.org/10.1038/459641c Google Scholar
R. A. Mustafa et al.,
“Systematic reviews and meta-analyses of the accuracy of HPV tests, visual inspection with acetic acid, cytology, and colposcopy,”
Int. J. Gynecol. Obstet., 132
(3), 259
–265
(2016). http://dx.doi.org/10.1016/j.ijgo.2015.07.024 IJGOAL Google Scholar
M. Follen Mitchel et al.,
“Colposcopy for the diagnosis of squamous intraepithelial lesions: a meta analysis,”
Obstet. Gynecol., 91
(4), 626
–631
(1998). Google Scholar
I. Turchin et al.,
“Novel algorithm of processing optical coherence tomography images for differentiation of biological tissue pathologies,”
J. Biomed. Opt., 10
(6), 064024
(2005). http://dx.doi.org/10.1117/1.2137670 JBOPFO 1083-3668 Google Scholar
A. M. Zysk et al.,
“Optical coherence tomography: a review of clinical development from bench to bedside,”
J. Biomed. Opt., 12
(5), 051403
(2007). http://dx.doi.org/10.1117/1.2793736 JBOPFO 1083-3668 Google Scholar
J. G. Fujimoto et al.,
“Optical coherence tomography: an emerging technology for biomedical imaging and optical biopsy,”
Neoplasia, 2
(1–2), 9
–25
(2000). http://dx.doi.org/10.1038/sj.neo.7900071 Google Scholar
A. Johansson et al.,
“Clinical optical diagnostics—status and perspectives,”
Med. Laser Appl., 23 155
–174
(2006). http://dx.doi.org/10.1016/j.mla.2008.08.002 Google Scholar
F. Bazant-Hegemark et al.,
“Optical micrometer resolution scanning for non-invasive grading of precancer in the human uterine cervix,”
Technol. Cancer Res. Treat., 7
(6), 483
–496
(2008). http://dx.doi.org/10.1177/153303460800700610 Google Scholar
C. Pitris et al.,
“High-resolution imaging of gynecologic neoplasms using optical coherence tomography,”
Obstet. Gynecol., 93 135
–139
(1999). http://dx.doi.org/10.1097/00006250-199901000-00027 Google Scholar
P. F. Escobar et al.,
“Diagnostic efficacy of optical coherence tomography in the management of preinvasive and invasive cancer of uterine cervix and vulva,”
Int. J. Gynecol. Cancer, 14 470
–474
(2004). http://dx.doi.org/10.1111/ijg.2004.14.issue-3 IJGCEN Google Scholar
P. F. Escobar et al.,
“Optical coherence tomography as a diagnostic aid to visual inspection and colposcopy for preinvasive and invasive cancer of the uterine cervix,”
Int. J. Gynecol. Cancer, 16 1815
–1822
(2006). http://dx.doi.org/10.1111/ijg.2006.16.issue-5 IJGCEN Google Scholar
A. F. Zuluaga et al.,
“Optical coherence tomography: a pilot study of a new imaging technique for non-invasive examination of cervical tissue,”
Am. J. Obstet. Gynecol., 193 83
–88
(2005). http://dx.doi.org/10.1016/j.ajog.2004.11.054 AJOGAH 0002-9378 Google Scholar
S. W. Lee et al.,
“Optical diagnosis of cervical intraepithelial neoplasm (CIN) using polarization-sensitive optical coherence tomography,”
Opt. Express, 16
(4), 2709
–2719
(2008). http://dx.doi.org/10.1364/OE.16.002709 OPEXFF 1094-4087 Google Scholar
W. Kang et al.,
“Diagnostic efficacy of computer extracted image features in optical coherence tomography of the precancerous cervix,”
Med. Phys., 38
(1), 107
–113
(2011). http://dx.doi.org/10.1118/1.3523098 MPHYA6 0094-2405 Google Scholar
N. Wulan et al.,
“Study of the diagnostic efficacy of real-time optical coherence tomography as an adjunct to unaided visual inspection with acetic acid for the diagnosis of preinvasive and invasive neoplasia of the uterine cervix,”
Int. J. Gynecol. Cancer, 20
(3), 422
–427
(2010). http://dx.doi.org/10.1111/IGC.0b013e3181d09fbb IJGCEN Google Scholar
Z. Liu et al.,
“Diagnostic efficacy of real-time optical coherence tomography in the management of preinvasive and invasive neoplasia of the uterine cervix,”
Int. J. Gynecol. Cancer, 20
(2), 283
–287
(2010). http://dx.doi.org/10.1111/IGC.0b013e3181cd1810 IJGCEN Google Scholar
J. Gallwas et al.,
“Optical coherence tomography (OCT) as a non invasive imaging technique for preinvasive and invasive neoplasia of the uterine cervix,”
Ultrasound Obstet. Gynecol., 36
(5), 624
–629
(2010). http://dx.doi.org/10.1002/uog.7656 Google Scholar
J. Gallwas et al.,
“Optical coherence tomography for the diagnosis of cervical intraepithelial neoplasia,”
Lasers Surg. Med., 43
(3), 206
–212
(2011). http://dx.doi.org/10.1002/lsm.21030 LSMEDI 0196-8092 Google Scholar
T. Just et al.,
“Optical coherence tomography allows for the reliable identification of laryngeal epithelial dysplasia and for precise biopsy: a clinicopathological study of 61 patients undergoing microlaryngoscopy,”
Laryngoscope, 120
(10), 1964
–1970
(2010). http://dx.doi.org/10.1002/lary.v120:10 Google Scholar
E. Guder et al.,
“Microanatomy of the tympanic membrane in chronic myringitis obtained with optical coherence tomography,”
Eur. Arch. Otorhinolaryngol., 272
(11), 3217
–3223
(2015). http://dx.doi.org/10.1007/s00405-014-3373-z Google Scholar
M. Finke et al.,
“Automatic scanning of large tissue areas in neurosurgery using optical coherence tomography,”
Int. J. Med. Rob., 8
(3), 327
–336
(2012). http://dx.doi.org/10.1002/rcs.1425 Google Scholar
E. Lankenau et al.,
“iOCT with surgical microscopes: a new imaging during microsurgery,”
Adv. Opt. Technol., 2
(3), 233
–239
(2013). 1687-6393 Google Scholar
E. Lankenau,
“Optische Kohärenztomographie: Dispersive Einflüsse und Anwendungen in der medizinischen Diagnostik,”
(2003). Google Scholar
J. Cohen,
“A coefficient of agreement for nominal scales,”
Educ. Psychol. Meas., 20 37
–46
(1960). http://dx.doi.org/10.1177/001316446002000104 EPMEAJ 0013-1644 Google Scholar
A. Malpica et al.,
“Kappa statistics to measure interrater and intrarater agreement for 1790 cervical biopsy specimens among twelve pathologists: qualitative histopathologic analysis and methodologic issues,”
Gynecol Oncol., 99
(3 Suppl 1), S38
–S52
(2005). http://dx.doi.org/10.1016/j.ygyno.2005.07.040 Google Scholar
G. Mehlhorn et al.,
“Computer-assisted diagnosis in colposcopy: results of a preliminary experiment?,”
Acta Cytol, 56
(5), 554
–559
(2012). http://dx.doi.org/10.1159/000341546 ACYTAN 0001-5547 Google Scholar
G. F. Vercellino et al.,
“Evaluation of the VITOM in digital high-definition video exocolposcopy,”
J. Low Genit. Tract Dis., 15 292
–295
(2011). http://dx.doi.org/10.1097/LGT.0b013e3182102891 Google Scholar
W. K. Huh et al.,
“Optical detection of high-grade cervical intraepithelial neoplasia in vivo: results of a 604-patient study,”
Am. J. Obstet. Gynecol., 190 1249
–1257
(2004). http://dx.doi.org/10.1016/j.ajog.2003.12.006 AJOGAH 0002-9378 Google Scholar
S. B. Cantor et al.,
“Accuracy of optical spectroscopy for the detection of cervical intraepithelial neoplasia: testing a device as an adjunct to colposcopy,”
Int. J. Cancer, 128 1151
–1168
(2011). http://dx.doi.org/10.1002/ijc.25667 IJCNAW 1097-0215 Google Scholar
Y. N. Mirabal et al.,
“Reflectance spectroscopy for in vivo detection of cervical precancer,”
J. Biomed. Opt., 7
(4), 587
–594
(2002). http://dx.doi.org/10.1117/1.1502675 JBOPFO 1083-3668 Google Scholar
T. DeSantis et al.,
“Spectroscopic imaging as a triage test for cervical disease: a prospective multicenter clinical trial,”
J. Low Genital Tract Dis., 11 18
–24
(2007). http://dx.doi.org/10.1097/01.lgt.0000230207.50495.05 Google Scholar
J. M. Yamal et al.,
“Accuracy of optical spectroscopy for the detection of cervical intraepithelial neoplasia without colposcopic tissue information; a step toward automation for low resource settings,”
J. Biomed. Opt., 17
(4), 047002
(2012). http://dx.doi.org/10.1117/1.JBO.17.4.047002 JBOPFO 1083-3668 Google Scholar
C. Balas,
“A novel optical imaging method for the early detection, quantative grading and mapping of cancerous and precancerous lesions of the cervix,”
IEEE Trans. Biomed. Eng., 48 96
–104
(2001). http://dx.doi.org/10.1109/10.900259 IEBEAX 0018-9294 Google Scholar
W. P. Soutter et al.,
“Dynamic spectral imaging: improving colposcopy,”
Clin. Cancer Res., 15 1814
–1820
(2009). http://dx.doi.org/10.1158/1078-0432.CCR-08-1636 Google Scholar
B. H. Brown et al.,
“Relation between tissue structure and imposed electrical current flow in cervical neoplasia,”
Lancet, 355 892
–895
(2000). http://dx.doi.org/10.1016/S0140-6736(99)09095-9 LANCAO 0140-6736 Google Scholar
B. H. Brown et al.,
“Detection of cervical intraepithelial neoplasia using impedance spectroscopy: a prospective study,”
BJOG, 112 802
–806
(2005). http://dx.doi.org/10.1111/bjo.2005.112.issue-6 Google Scholar
S. Abdul et al.,
“The use of electrical impedance spectroscopy in the detection of cervical intraepithelial neoplasia,”
Int. J. Gynecol. Cancer, 16 1823
–1832
(2006). http://dx.doi.org/10.1111/ijg.2006.16.issue-5 IJGCEN Google Scholar
J. Tan et al.,
“Detection of cervical intraepithelial neoplasia in vivo using confocal endomicroscopy,”
BJOG, 116 1663
–1670
(2009). http://dx.doi.org/10.1111/j.1471-0528.2009.02261.x Google Scholar
M. K. Quinn et al.,
“High-resolution microendoscopy for the detection of cervical neoplasia in low-resource settings,”
PLoS One, 7 e44924
(2012). http://dx.doi.org/10.1371/journal.pone.0044924 POLNCL 1932-6203 Google Scholar
|
|||||||||||||||||||||||||||||||||||||||||||||||||||||||||||||||||||


