|
|
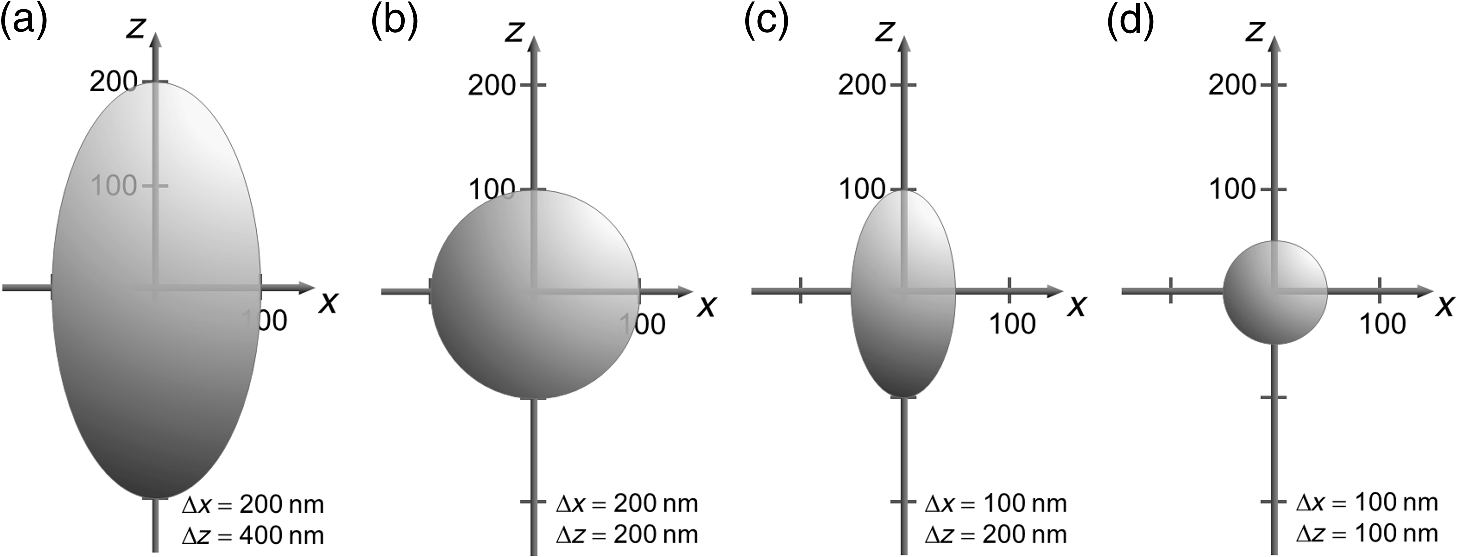
1.IntroductionFor single-cell experiments, cells are often cultivated as two-dimensional (2-D) monolayers on glass or plastic slides. However, three-dimensional (3-D) cell cultures appear to be more appropriate for studies of cell physiology, cell metabolism, or tissue diagnostics. In particular, cell cultivation in a solid matrix, e.g., gel, as reported in the literature for about 30 years1–3 may permit 3-D cell growth under realistic conditions. While cell monolayers are readily assessed by laser scanning4,5 or structured illumination microscopy (SIM),6–8 measurements of 3-D cell cultures also require some specific sample holders, e.g., glass or plastic tubes or even microcapillaries. The latter ones have recently been used in an innovative device for sample rotation,9 permitting 3-D views of multicellular tumor spheroids (MCTS), or small organisms by laser scanning microscopy or light sheet-based fluorescence microscopy9,10 from various directions. It is now a challenge to transfer this technique of axial tomography from samples of several hundred micrometers diameter to single cells whose diameter is only a few micrometers. This requires a reliable transfer of single cells growing in an agarose gel to the microcapillary as well as an adaptation of high-resolution microscopy to the sample geometry. 2.Materials and MethodsCells were routinely cultured in appropriate media supplemented with 10% foetal calf serum (FCS) and penicillin/streptomycin at 37°C and 5% . Culture media used are DMEM with Na-Pyrovate for 3T3 murine fibroblasts, RPMI for HeLa cervical carcinoma cells, and RPMI with G418 () for Chinese hamster ovary (CHO) cells with a plasma membrane associated green fluorescent protein (GFP) (CHOpAcGFP1-Mem) or a mitochondrially associated GFP (CHO-pAcGFP1-Mito). CHO cells were kindly supplied by the Institute of Laser Technology in Medicine and Metrology at the University of Ulm (ILM). A 1:1 mixture of cell suspension and agarose (1%) was seeded in agarose-coated cavities of a 24-well culture plate, resulting in 60,000 cells/cavity within a solid matrix. Usually, single cells were kept vital in agarose for 1 to 3 days prior to measurements. In some experiments, individual cavities were incubated either with CdSe/ZnS quantum dots of 10- to 20-nm diameter (QTracker® 655 Cell Labeling Kit, Life Technologies GmbH, Darmstadt, Germany) at a concentration of 10 nM for 60 min, or with the fluorescent anticancer drug doxorubicin11 at a concentration of for 2, 4, 6, or 24 h. Agarose containing single cells were taken up by plunging glass, fluoroethylene propylene (FEP),12 or perfluoroalkoxy (PFA) capillaries several times into the solid matrix so that a column of 30 to 40 mm agarose was taken up. Capillaries were fixed in a sample holder on a microscope positioning stage as described earlier9 and depicted in Fig. 1. An inverted fluorescence microscope (Axiovert 200M, Carl Zeiss Microimaging GmbH, Germany) was used with either a or a or a water immersion objective lens. In the case of low magnification ( or ), cylindrical glass capillaries of inner and outer diameter, or PFA capillaries of inner and outer diameter (Zeus, Ireland) were inserted and optically coupled to rectangular glass capillaries of or inner cross section (VitroTubes, VitroCom Inc.) to optimize the conditions of illumination and fluorescence detection in an air environment.9 At high magnification (), the water objective lens was used in combination with cylindrical FEP capillaries ( inner and outer diameter; Zeus, Ireland) whose refractive index of 1.33 to 1.35 fits those of the sample and the water immersion and ensures optimum imaging independent of the sample geometry. In this case, no second (outer) capillary was needed. For rotation of the inner glass or PFA capillary as well as of the FEP capillary, a computerized stepping motor with microstep positioning control (Nema 8-ST2018S0604-A, SMC11, Nanotec Electronic GmbH & Co.KG, Germany) and an angular resolution of 0.45 deg was used. In the present manuscript, only rotations of multiples of 45 deg were visualized. Fig. 1Device for rotation of 3-D samples (within microcapillaries) applicable to the -stage of an inverted microscope (reproduced from Ref. 9 with modifications). 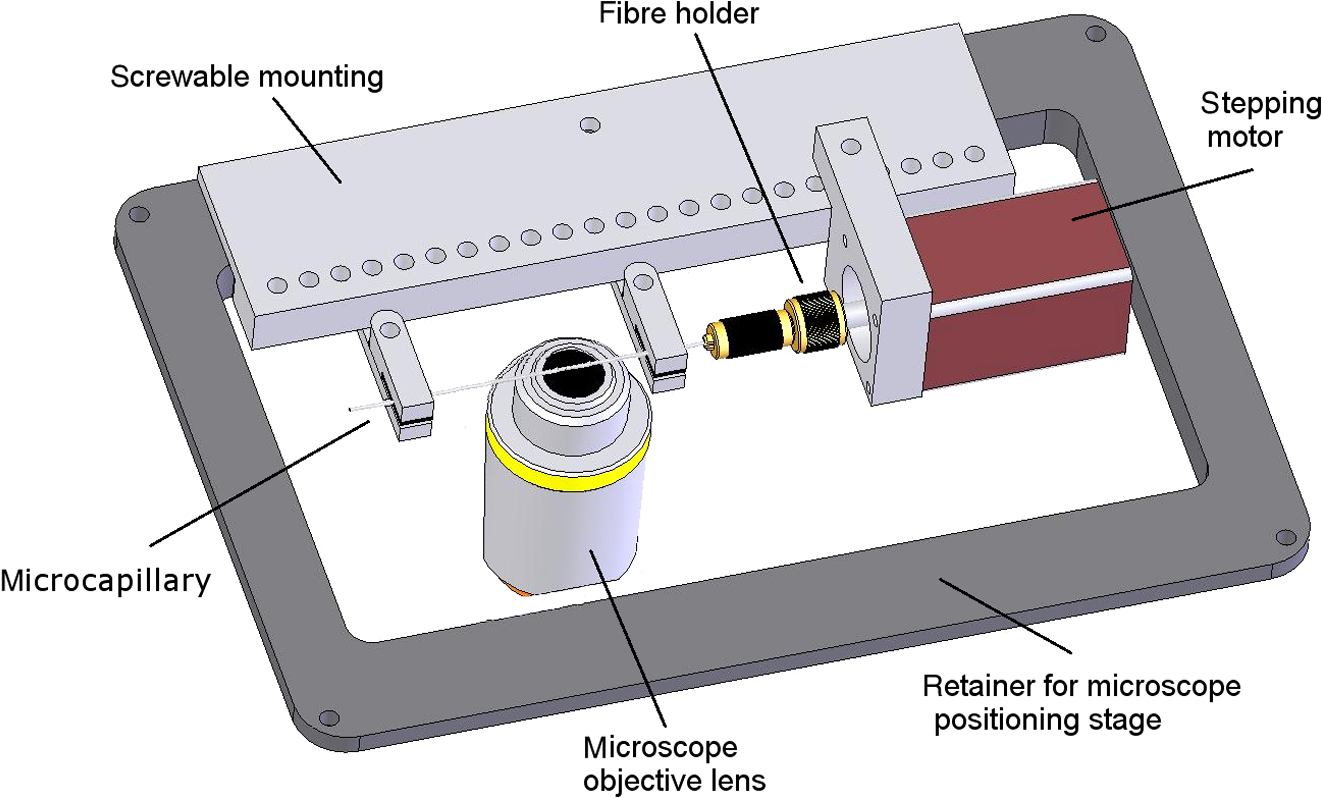 Confocal laser scanning microscopy (CLSM) was performed with a Pascal 5 laser scanning head (Carl Zeiss Jena, Germany) used together with the inverted microscope. A laser wavelength of 488 nm was selected for optical excitation, while long path filters for or were used for fluorescence detection. Data acquisition occurred for each detection angle by shifting the image plane in an axial direction with fixed increments between and about . projections or 3-D projections were calculated for each angle. 3.ResultsThe advantage of axial tomography versus conventional laser scanning microscopy of individual cells with a membrane associated GFP (CHO-pAcGFP1-Mem) is visualized in Fig. 2. In the upper part of this figure, viewing angles of a 3-D image calculated from a stack recorded in one direction (using the open source software ImageJ)13 are shown, whereas in the lower part projections obtained from image stacks recorded under variable angles are depicted. A clear enhancement of image quality results for all angles except 0 deg and 180 deg. Fig. 2CHO-pAcGFP1-Mem cells (results of stacks of 31 to 36 individual CLSM images) under variable angles of detection: 3-D images from a stack recorded in one direction (0 deg) and calculated for all other directions (upper part), or projections calculated from stacks recorded under variable angles (lower part); between individual subsequent images; excitation wavelength: ; detection range: , objective lens: .  In Figs. 3 and 4, examples with higher resolution are presented. Figure 3 shows projections of a single 3T3 fibroblast in an agarose matrix incubated for 60 min with fluorescent quantum dots (QTracker® 655 Cell Labeling Kit; 10 nM) under variable rotation angles. It appears that these quantum dots are located in individual organelles of 1- to size. A fluorescent spot marked by an arrow at angles of 0 deg (top) and 180 deg (bottom) turns out to result from at least two fluorescent organelles that are resolved at 135 deg (again marked by an arrow) and—less pronounced—also at 45 deg and 225 deg. This proves that individual cellular structures can be better visualized upon cell rotation. Fig. 3Single 3T3 fibroblast in an agarose matrix incubated with fluorescent quantum dots (QTracker® 655 Cell Labeling Kit; 10 nM, 60 min) and rotated in intervals of 45 deg. 3-D projections resulting from stacks (CLSM) with intervals (excitation wavelength: ; detection range: , objective lens: water). A fluorescent spot resulting from at least 2 organelles is indicated by an arrow for 0 deg, 135 deg, and 180 deg. The rotation axis and the sense of rotation are indicated in the right part of the figure.  Fig. 4Individual CHO cell expressing a mitochondrially associated GFP (CHO-pAcGFP1-Mito) upon rotation in intervals of 45 deg: (a) projections resulting from stacks (CLSM) with intervals (excitation wavelength: ; detection range: , objective lens: water); (b) rotation axis and sense of rotation; and (c) illustration of the light path through the cell at angles of 45 deg and 135 deg. 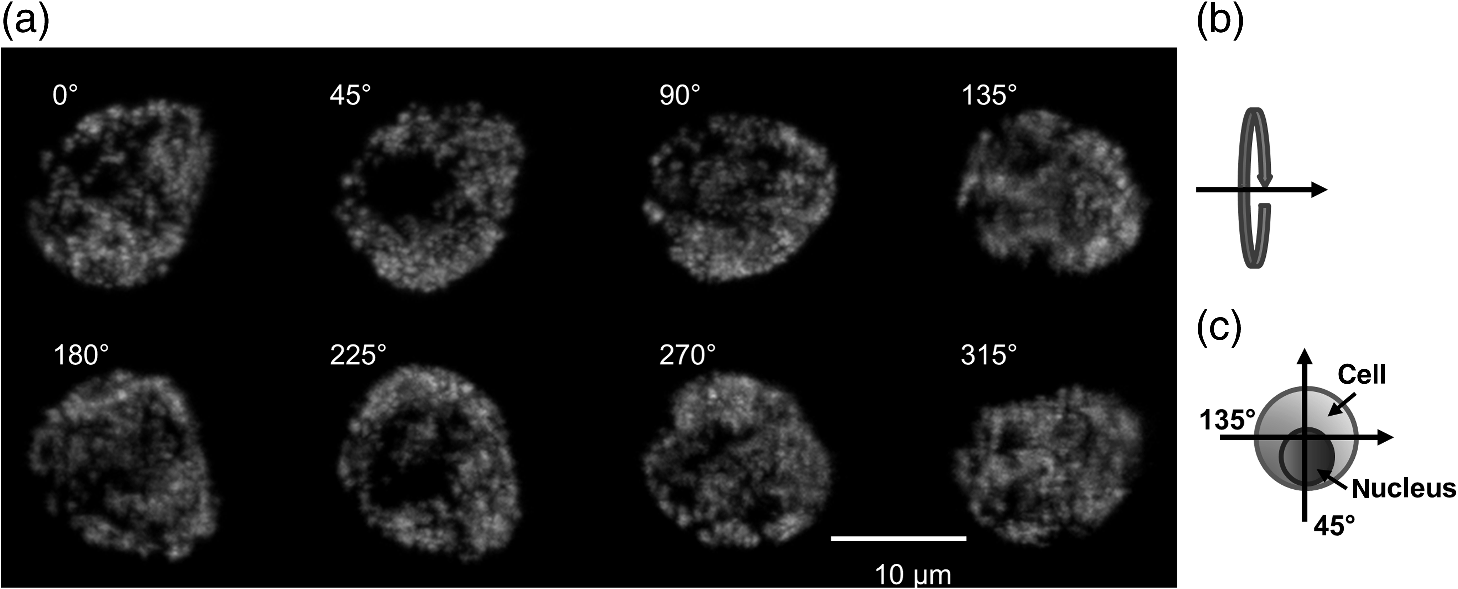 In addition, substructures of individual CHO cells expressing a mitochondrially associated GFP (CHO-pAcGFP1-Mito) become more prominent upon cell rotation. This is depicted in Fig. 4 showing projections from all confocal planes with a nonfluorescent cell nucleus being surrounded by fluorescent mitochondria. The contribution of the nucleus to the image depends on the direction of illumination, i.e., is high for 45 deg and 225 deg and low for 135 deg as well as 315 deg, as also illustrated in Fig. 4(c). So, different information on mitochondria surrounding the cell nucleus is obtained for different rotation angles. This may be useful in studies of mitochondrial metabolism. In view of biological applications, we studied the uptake and location of the fluorescent anticancer drug doxorubicin in HeLa cervical carcinoma cells, as depicted in Fig. 5 after 2 h of application. While transillumination images are shown for eight different rotation angles, fluorescence stacks are depicted for angles of 180 deg and 225 deg. Images of two cells are overlaying at 225 deg, but can be well separated at 180 deg, when also some shift in -direction between these cells becomes evident. Fluorescence is localized in the cell nucleus and—dependent on the angle of detection—gives some information on its architecture upon application of doxorubicin. The localization pattern of doxorubicin is maintained after 4 and 6 h, but changes significantly after 24 h, when a relocalization in small organelles embedded in the cytoplasm, e.g., lysosomes or endosomes, occurs (data not shown). Fig. 5Individual HeLa cells incubated with doxorubicin (, 2 h): (a) transillumination at angles of 0 deg, 45 deg, 90 deg, 135 deg, 180 deg, 225 deg, 270 deg, and 315 deg; (b) stack at 180 deg with intervals ; (c) stack at 225 deg with intervals (CLSM, excitation wavelength: ; detection range: , objective lens: water).  4.DiscussionIn addition to various techniques of 3-D microscopy including CLSM, SIM, or light sheet-based fluorescence microscopy, axial tomography represents a further step for improving visualization of living cells or organisms. While a previous paper was focused on small organisms of 1- to 2-mm size,9 this manuscript emphasizes single cell measurements in the micrometer scale with a high potential of resolving fluorescence patterns. The method requires cell growth in a solid matrix and transfer to an appropriate microvessel, e.g., glass or FEP/PFA capillary, for microscopy. Background fluorescence from agarose or dye molecules, which are used for fluorescence staining of the cells, but which can hardly be washed out from the solid matrix, may present some problem. On the other hand, effects of stray light, which generally reduce image quality, can be minimized upon rotation of the samples. stacks can be recorded and combined in a 3-D image or a projection for each detection angle. This highly improves the potential of visualizing cells and their microenvironment. In addition, individual stacks recorded at various angles can be linked to each other and fused to one 3-D output image.14 This manuscript focuses on projections or 3-D projections of individual data sets acquired at individual angles. Uptake and intracellular distribution of the anticancer drug doxorubicin have been studied within the scope of this manuscript. This drug is accumulated in the cell nucleus, as earlier shown by 2-D microscopy for MCF-7 breast cancer cells.15 Since doxorubicin has been reported to intercalate in DNA strands, where it causes DNA damage, chromatin condensation, and apoptosis,16–18 its fluorescence may give some information on nuclear architecture during this process. Variation of the detection angle by axial tomography greatly improves the potential of imaging cells growing in a 3-D environment. Usually, lateral resolution in wide-field fluorescence microscopy is defined by the Rayleigh criterion with the fluorescence wavelength and the numerical aperture of the objective lens , while axial resolution is correlated with the depth of focus with corresponding to the refractive index of the immersion medium. Slightly different equations are obtained for laser scanning microscopy. Lateral and axial resolutions correspond to the axes of the so-called point spread function (PSF) (image pattern of a single point) as depicted in Fig. 6(a), with values to 220 nm and for high-aperture objective lenses ( to 1.40) and wavelengths around 500 nm. Axial tomography allows samples to be rotated, so that always the best (lateral) resolution can be utilized [Fig. 6(b)]. Therefore, by the combination of different detection angles, spatial information is increased, and 3-D images with improved resolution can be calculated, as reported in the literature.19 Doubling of resolution can be obtained by SIM,7,8,20 resulting in the PSFs depicted in Figs. 6(c) and 6(d) when combined with axial tomography. Live cell microscopy can thus be performed with a resolution of about 100 nm in all directions. This competes with other methods of super-resolution microscopy, e.g., stimulated emission depletion microscopy21 or single molecule localization microscopy including PALM, STORM, and related approaches.22–26 However, in contrast to those methods, SIM—even in combination with axial tomography—can be applied at nonphototoxic light doses below 0.1 to .27 AcknowledgmentsThis project was funded by the Ministry of Science and Art Baden-Württemberg. The authors thank Claudia Hintze for skillful technical assistance. ReferencesM. D. Johnson, G. T. Bryan and C. A. Reznikoff,
“Serial cultivation of normal rat bladder epithelial cells in vitro,”
J. Urol., 133
(6), 1076
–1081
(1985). Google Scholar
K. Harada et al.,
“Chondrocyte-like colony formation of mesenchymal cells by dentin extracts in agarose gel culture,”
J. Dent. Res., 69
(9), 1555
–1559
(1990). http://dx.doi.org/10.1177/00220345900690090301 Google Scholar
C. Dusny et al.,
“Technical bias of microcultivation environments on single cell physiology,”
Lab. Chip, 15
(8), 1822
–1834
(2015). http://dx.doi.org/10.1039/C4LC01270D LCAHAM 1473-0197 Google Scholar
J. Pawley, Handbook of Biological Confocal Microscopy, Plenum Press, New York
(1990). Google Scholar
R. H. Webb,
“Confocal optical microscopy,”
Rep. Prog. Phys., 59 427
–471
(1996). http://dx.doi.org/10.1088/0034-4885/59/3/003 RPPHAG 0034-4885 Google Scholar
M. A. Neil, R. Juskaitis and T. Wilson,
“Method of obtaining optical sectioning by using structured light in a conventional microscope,”
Opt. Lett., 22
(24), 1905
–1907
(1997). http://dx.doi.org/10.1364/OL.22.001905 OPLEDP 0146-9592 Google Scholar
M. G. L. Gustafsson et al.,
“Three-dimensional resolution doubling in wide-field fluorescence microscopy by structured illumination,”
Biophys. J., 94
(12), 4957
–4970
(2008). http://dx.doi.org/10.1529/biophysj.107.120345 BIOJAU 0006-3495 Google Scholar
R. Heintzmann and C. Cremer,
“Lateral modulated excitation microscopy: improvement of resolution by using a diffraction grating,”
Proc. SPIE, 3568 185
–196
(1999). http://dx.doi.org/10.1117/12.336833 PSISDG 0277-786X Google Scholar
T. Bruns, S. Schickinger and H. Schneckenburger,
“Sample holder for axial rotation of specimens in 3D Microscopy,”
J. Microsc., 260
(1), 30
–36
(2015). http://dx.doi.org/10.1111/jmi.2015.260.issue-1 JMICAR 0022-2720 Google Scholar
T. Bruns et al.,
“Miniaturized modules for light sheet microscopy with low chromatic aberration,”
J. Microsc., 4
(3), 261
–267
(2016). http://dx.doi.org/10.1111/jmi.12439 JMICAR 0022-2720 Google Scholar
R. H. Blum and S. K. Carter,
“Adriamycin. A new anticancer drug with significant clinical activity,”
Ann. Intern. Med., 80 249
–259
(1974). http://dx.doi.org/10.7326/0003-4819-80-2-249 AIMEAS 0003-4819 Google Scholar
M. Weber, M. Mickoleit and J. Huisken,
“Multilayer mounting for long-term light sheet microscopy of zebrafish,”
J. Vis. Exp., 84 e51119
(2014). http://dx.doi.org/10.3791/51119 Google Scholar
P. Pitrone et al.,
“Open SPIM—an open access platform for light sheet microscopy,”
Nat. Methods, 10 598
–599
(2013). http://dx.doi.org/10.1038/nmeth.2507 Google Scholar
P. Weber, M. Wagner and H. Schneckenburger,
“Cholesterol dependent uptake and interaction of doxorubicin in MCF-7 breast cancer cells,”
Int. J. Mol. Sci., 14 8358
–8366
(2013). http://dx.doi.org/10.3390/ijms14048358 1422-0067 Google Scholar
Z. X. Li et al.,
“Adriamycin induces H2AX phosphorylation in human spermatozoa,”
Asian J. Androl., 10 749
–757
(2008). http://dx.doi.org/10.1111/ajan.2008.10.issue-5 Google Scholar
D. Komitowski, L. J. Charamella and N. V. Dimitrov,
“Evaluation of nuclear morphology in adriamycin sensitive and resistant cells,”
Ann. Clin. Lab Sci., 24 259
–265
(1994). Google Scholar
Y. W. Eom et al.,
“Two distinct modes of cell death induced by doxorubicin: apoptosis and cell death through mitotic catastrophe accompanied by senescence-like phenotype,”
Oncogene, 24 4765
–4777
(2005). http://dx.doi.org/10.1038/sj.onc.1208627 ONCNES 0950-9232 Google Scholar
R. Heintzmann and C. Cremer,
“Axial tomograpic confocal fluorescence microscopy,”
J. Microsc., 206 7
–23
(2002). http://dx.doi.org/10.1046/j.1365-2818.2002.01000.x JMICAR 0022-2720 Google Scholar
L. M. Hirvonen et al.,
“Structured illumination microscopy of a living cell,”
Eur. Biophys. J., 38
(6), 807
–812
(2009). http://dx.doi.org/10.1007/s00249-009-0501-6 EBJOE8 0175-7571 Google Scholar
S. W. Hell and J. Wichmann,
“Breaking the diffraction resolution limit by stimulated emission: stimulated-emission-depletion fluorescence microscopy,”
Opt. Lett., 19
(11), 780
–2
(1994). http://dx.doi.org/10.1364/OL.19.000780 OPLEDP 0146-9592 Google Scholar
E. Betzig et al.,
“Imaging intracellular fluorescent proteins at nanometer resolution,”
Science, 313
(5793), 1642
–1645
(2006). http://dx.doi.org/10.1126/science.1127344 SCIEAS 0036-8075 Google Scholar
M. J. Rust, M Bates and X Zhuang,
“Sub-diffraction-limit imaging by stochastic optical reconstruction microscopy (STORM),”
Nat. Methods, 3
(10), 793
–796
(2006). http://dx.doi.org/10.1038/nmeth929 1548-7091 Google Scholar
S. T. Hess, T. P. Girirajan and M. D. Mason,
“Ultra-high resolution imaging by fluorescence photoactivation localization microscopy,”
Biophys. J., 91
(11), 4258
–4272
(2006). http://dx.doi.org/10.1529/biophysj.106.091116 BIOJAU 0006-3495 Google Scholar
P. Lemmer et al.,
“SPDM–light microscopy with single molecule resolution at the nanoscale,”
Appl. Phys. B, 93 1
–12
(2008). http://dx.doi.org/10.1007/s00340-008-3152-x Google Scholar
C. Cremer and B. R. Masters,
“Resolution enhancement techniques in microscopy,”
Eur. Phys. J. H, 38 281
–344
(2013). http://dx.doi.org/10.1140/epjh/e2012-20060-1 EPJHAD 2102-6459 Google Scholar
H. Schneckenburger et al.,
“Light exposure and cell viability in fluorescence microscopy,”
J. Microsc., 245 311
–318
(2012). http://dx.doi.org/10.1111/jmi.2012.245.issue-3 JMICAR 0022-2720 Google Scholar
BiographyVerena Richter is a postdoc in the Laboratory for Biomedical Optics at Aalen University. Her research is concentrated on novel techniques for fluorescence microscopy of live cells in two and three dimensions. Sarah Bruns is a scientist of the Biophotonics Group at Aalen University. She is working in the field of optical microscopy with focus on the development of microscope add-ons for live cell microscopy. Thomas Bruns is a scientist of the Biophotonics Group at Aalen University. His research is related to developing and prototyping new methods and modules within the scope of live cell microscopy and screening applications. Petra Weber is a scientist of the Biophotonics Group of the Institute of Applied Research at Aalen University. Her main topics are the application of fluorescence microscopy to examine different effects of pharmaceutical agents on cellular test systems. Michael Wagner is a research assistant in the degree course optical engineering at Aalen University. His main topics are optics, fluorescence microscopy, and construction of optical setups. Christoph Cremer is a professor of physics at the Universities Heidelberg and Mainz and a group leader at the Institute of Molecular Biology, Mainz. The methodological focus of the Cremer-Lab is the development and application of methods of super-resolving fluorescence microscopy. Contributions to this field include focused nanoscopy, structured illumination, and various types of localization microscopy. As the main application field, these techniques are applied to study the nuclear nanostructure in various cell types and organisms. |