
|
|
1.IntroductionThe analysis of exhaled air is under investigation as a promising tool for express and noninvasive analysis of biochemical processes in the human body1 that arise from underlying diseases by providing a detailed picture of specific metabolites that are biomarkers in the exhaled air.2 The term “biomarkers” was first used in 1989 (Ref. 3) and standardized in 2001, as “a characteristic that is objectively measured and evaluated as an indicator of normal biological processes, pathogenic processes, or pharmacologic responses to a therapeutic intervention.”4 Control of metabolites in exhaled air produced by biochemical reactions in cells being called “breathomics” provides the ability to predict the specific disease before the appearance of the clinical features. This approach has already been applied for diagnostics of cancer, pulmonary diseases, and infectious diseases.5 In addition to nitrogen, oxygen, carbon dioxide, water vapor, and inert gases, exhaled air contains components of endogenous or exogenous origin in the ppbv–pptv range of concentrations. The endogenous compounds include inorganic gases such as NO, CO; volatile organic compounds (VOCs) such as ethane, pentane, acetone, isoprene, acetaldehyde, methanol, ethanol, and other alcohols and alkanes; 2-propanol, sulfur-containing compounds such as dimethylsulfide; methyl, ethyl, mercaptanes, and carbon disulfide; and nitrogen-containing substances such as ammonia and dimethyl/trimethylamine.1,6 Single-molecule biomarkers often do not suffice for describing a specific phenotype or endotype. Therefore, molecular biomarker panels are often applied as they can be highly relevant in distinguishing subgroups of patients for targeted interventions. These panels can be derived from complete mapping of molecular mixtures obtained from “omics” technologies and subsequent unbiased statistical pattern recognition.6 Exhaled air analysis can be used both as a tool in diagnostics and to reveal specific (patho-) physiological mechanisms. The latter is not of primary importance for diagnostic purposes. Therefore, identification of VOCs is not strictly necessary in a clinical setting, and a “profiling” approach can be used.7 Chemical analytical techniques provide identification of specific compounds, pattern-recognition-based techniques provide probabilistic discrimination of biomarker profiles. Notably, the latter does not identify individual compounds but is based on probabilistic recognition, which forms the basis for assessing diagnostic accuracy.7 The aim of this paper is to reveal the abilities of the infrared (IR) laser photoacoustic spectroscopy (LPAS) and the pattern-recognition-based approach for noninvasive express diagnostics of pulmonary diseases on the basis of absorption spectra analysis of the patient’s exhaled breath. The method of gas chromatography–mass spectrometry (GC–MS) was used as the reference. 2.Technical BackgroundVarious analytical methods are used for breathomics.8 Selected ion flow tube mass spectrometry (SIFT-MS) is based on chemical ionization (ChI) using molecular ions to transfer charge onto the target compound. The ChI approach allows reduced fragmentation of the latter in comparison with many other types of ionization. SIFT-MS provides direct analysis with no sample preconcentration, is suitable for real-time monitoring, and is slightly influenced by humidity. The limit of detection (LOD) of the SIFT-MS Voice200Ultra (Syft Technologies Ltd.) is better than 1 pptv. Proton transfer reaction mass spectrometry (PTR-MS) is a ChI mass spectrometric technique, which allows the measurement of trace gases as, for example, in exhaled human breath. To increase measuring accuracy, the duration of the measuring process is extended, but for breath-to-breath resolution the time window for measurement should be relatively short. To estimate the LOD, a theoretical model of the measurement process is outlined. According to this, for example, LOD for concentration measurements of the acetone is about 0.2 ppb.9 The PTR-QMS 300 instrument (IONIKON Analytik GmbH) provides .10 Gas chromatography–mass spectrometry (GC–MS) detection is a “gold standard” in VOCs analysis. For example, LOD for dichloromethane by this method is about 0.1 ppt.11 The method of ion mobility spectrometry (IMS) is used to detect substances in very small concentrations, for instance for measurements of background concentrations of pollutants in workplace and environment. A small sample of air containing the suspected substance is periodically taken into the IMS system where a radioactive source ionizes the molecules in the sample. As a result, they drift in an electric field inside the so-called “drift cell.” Each type of molecules has a specific drift velocity in the air and may, therefore, be identified. Gas chromatography coupled to ion mobility spectrometer (GC-IMS) by Gesellschaft für analytische Sensorsysteme mbH provides a typical value of LOD near the low ppbv-range.12 The devices, consisting of a number of sensors, each of which corresponds to a particular substance, are often called “electronic nose.” The example of the “e-nose” is “Cyranose 320,” consisting of 32 polymer chemiresistors.13 The disadvantage of similar sensors is nonspecificity due not only to reaction on a given chemical compound but also to sensibility to nearly all compounds, and slightly more to one chemical family, such as organic solvents, fatty acids, sulfurous gases, etc.14 LPAS is one of the most sensitive approaches of laser absorption spectroscopy to gas analysis, especially with the use of coherent radiation sources and intracavity photoacoustic detection.15 LPAS has a very low detection limit. For example, LPAS gas analyzer with intracavity acoustic cell provides the measurement of ethylene down to 6 pptv.16,17 Several milliliters of gas sample volume is enough for LPAS analysis. Sample preconcentration is not needed because the photoacoustic signal is proportional to the absorbed volume fraction of laser energy, which can be increased by the power of the used laser source. Therefore, it is preferable to use as it is as high-power a light source as is available. Light sources that have been used in photoacoustic spectroscopy include broadband infrared radiation sources, that is, black-body radiators and light-emitting diodes; in most cases, various lasers (, CO, diode, quantum cascade, and Nd:YAG lasers) are used. Another way to use Nd:YAG lasers in LPAS is optical parametric oscillator (OPO) systems as a source of high-power, continuously tunable mid-IR light.18 OPO systems provide light power of a few 100 mW to more than 1 W in the wavelength range from 2 to . OPOs were first used in photoacoustic detection of organic compounds near at ppm-level and successfully applied later to measure formaldehyde with ppb and ethane with sub-ppb accuracy.19 The sensitivity of LPAS is strongly influenced by the construction of the photoacoustic cell. The latter can operate either in a nonresonant mode or as an acoustic resonator. Nonresonant operation means that the light modulation frequency is below the lowest resonance frequency of the cell. In this case, acoustic wave distribution within the cell is almost spatially independent and resonant amplification of the photoacoustic signal is not used. When the exciting light is modulated at a resonance frequency of the cell, the generated photoacoustic signal is amplified proportionally to the quality factor (Q-factor) of the acoustic resonance. Q-factors can be up to several hundreds.15 The most frequently used types of resonant LPAS detectors are based on Helmholtz resonators, one-dimensional cylindrical resonators, and cavity resonators.15,20 The Groupe de Spectrométrie Moléculaire et Atmosphérique (Reims, France) and the Institute of Atmospheric Optics (Tomsk, Russia) have developed a photoacoustic sensor based on a double differential Helmholtz resonator (DHR) for infrared gas detection.20–22 The double DHR uses two identical DHR configurations, which can significantly eliminate the in-phase external acoustic noise at atmospheric pressure and flow mode.18 Nonlinear effects in OPO is one of the most widespread ways to generate tunable coherent radiation in the wide spectral range. We developed the LaserBreeze gas analyzer based on an LPAS method and OPO with a tuning range from 2.5 to .23 The experimental set-up of the LaserBreeze gas analyzer is shown in Fig. 1. The laser source includes two OPOs. The first one is based on fan-out periodically poled lithium niobate structure (PPLN), which provides wavelength tuning in the spectral range from 2.5 to . The second OPO is based on mercury thiogallate crystals (HGS) and has a wavelength tuning range from 4.45 to . Both OPO were pumped by a Nd:YLF laser. The switching between two OPO is realized by a motorized translation stage. The linewidth of laser radiation is about 3 to . It is enough for a pattern-recognition-based approach. Resolution of wavelength scanning is around for OPO based on PPLN structure. This value for OPO based on HGS crystal due to its mechanism of wavelength tuning is varied over spectral range, but the values are practically the same. The total time of the absorption spectrum registration in the whole spectral range is about 10 min. The photoacoustic detector (PAD) is based on double channel Helmholtz resonator with Q-factor and fundamental resonance frequency . Data from the pyroelectric detector (PD) are used to normalize the PAD signal relative to the laser radiation power. The thermostating at the temperature was applied to avoid temperature drift of the OPO parameters and water vapor condensation on the PAD walls. To provide wavelength calibration, we use the reference cell (REF) filled with a gas mixture with a known composition of compounds having strong absorption lines in known wavelengths within the LaserBreeze gas analyzer tuning range. Absorption spectrum of the gas mixture in the reference cell is shown in Fig. 2. Fig. 2Absorption spectra of gas mixture in the reference cell in the spectral range from 2500 to 10,700 nm.  The other designation in Fig. 1 are: FI is the Faraday isolator, are the mirrors, PC is the personal computer, and is the halfwave plate. In the case of a smooth absorption spectrum with no distinct peaks of absorption of spectral bands of the measuring components of a gas mixture, a method based on Bayesian estimate of the solution of the inverse spectroscopy task allows the determination of the gas concentration.24 The LaserBreeze gas analyzer allows the detection of more than 20 molecular biomarkers that have absorption lines in the mentioned spectral range, including acetone (), acetylene (), ammonia (), butane (), carbon dioxide (), 13 isotope of carbon dioxide (), carbon monoxide (CO), ethane (), ethanol (), ethyl acetate (), ethylene (), formaldehyde (), methane (), methanol (), nitrogen dioxide (), nitrogen oxide (NO), nitrous oxide (), pentane (), propane (), and sulfur dioxide (). Relative error in determining of VOC concentrations is not more than 30%. The necessary volume of the studied sample is not more than , and the concentration sensitivity of the LaserBreeze gas analyzer is not worse than . A procedure of sensitivity estimation was described in Ref. 22. PAD was preliminarily cleared by the pumping of . After that, the device was switched on. The measurements of noise signal value were continued for 3 min. The average value and standard deviation were calculated. Then, PAD was filled by a calibration gas mixture including tested gas with known concentrations and nitrogen (). The concentration of tested gas was chosen to provide a useful signal value over in 2 to 3 times. The measurements procedure was the same as for noise level one. The following equation was used to calculate signal/noise value (): where is the average value of useful signal. The sensitivity was determined by the following equation:3.Data Preprocessing and AnalysisOne of the key steps in the biomarkers analysis involves evaluation of latent dependencies in the variables data using reliable methods. The methods often are referred to as chemometrics. The first step in chemometrics data analysis usually consists of separation of informative variables and reduction of the dimension of the feature space. This can be provided by multivariate unsupervised methods such as principal component analysis (PCA), factor analysis, -means clustering, or hierarchical cluster analysis.25 The basic idea of PCA is to find the reduced number of new variables, termed the principal components, that are enough for the recovery of the initial variables, possibly with insignificant errors. The mathematical background of PCA consists of decomposition of initial experimental data from a two-dimensional matrix () in the form of a matrix product26 where , , and are the scores, loadings, and residuals matrixes, respectively. The loadings matrix contains weight coefficients that characterize the contribution of features to a principal component. The scores matrix contains coordinates of the samples in the space of the principal components.Breathomics data frequently show nonlinear patterns in the feature space, and these problems are well handled using nonlinear methods.27 Nonlinear techniques, particularly kernel methods, are more powerful in predicting accuracy and discrimination.28 The support vector machine (SVM) is the most frequently used kernel method. SVM binary classification is based on building up the maximum-width stripe that spatially separates groups under study. The algorithm is based on scalar product analysis of the feature vectors. When the building of such a stripe is impossible, the kernel transform can help to provide classification that is based on analysis of the scalar product of the feature vectors functions. The application of SVM to the problem of data classification is by a training set with objects that belong to one of the two classes; each new object is assigned to one of these classes. The problem may be defined as follows: where is a nonempty set; is the number of objects in the training set; are called labels, and are the objects under classification. Each classified object is a vector in -dimensional space.Thus, the task of some classifier rule building is where operation defines the scalar product of vectors, and the vector and scalar threshold are the algorithm parameters.The SVM method includes a training phase; consequently, the experimental data set should be separated into teaching and testing subsets. The separation procedure essentially influences the robustness of the classification. This can include both a cross validation and an external validation to avoid discrepancy. In the -fold cross validation, the dataset is randomly divided into subsets of equal size; after that, () subsets are used for training and the remaining subset is used for the examination of classification quality. This procedure should be repeated until all subsets have been used as the test set.29,30 The limit case of this algorithm is “leave one out cross validation,” which corresponds to being equal to the experimental data set size. In the external validation, a new dataset obtained by repetition of the measurements with the same population is used.31,32 4.Results and DiscussionThe experimental part of the research was carried out according to the principles of good clinical practices. Protocol of the research was approved by the Ethic Committee of the Siberian State Medical University (Tomsk, Russia), Ref. No. 2882 at 24.11.2011. All participants were preliminary informed about details of the research and signed an “informed agreement” on the actions carried out. The interaction with the patients was limited by the sampling of a part of exhaled air into a disposable container. The sampling procedure occurs before eating or 2 h after. Prior to sampling, participants rinsed their mouths with running water without any special cleaning of the oral cavity. Then, participants did some calm breaths through a sterile plastic tube into the sample container. The “dead volume” was exhaled outside the sample container. The study involved three groups: patients with bronchopulmonary diseases including lung cancer (LC) (); patients with chronic obstructive pulmonary disease (COPD) (); and a control group of healthy nonsmoking volunteers (). All patients had been treated or diagnosed in specialized units of medical institutions, so the diagnosis of every patient had been verified and thoroughly tested by instrumental methods. All patients with severe comorbidities, with chronicity of the pathological processes, or an unconfirmed clinical diagnosis were excluded from the study. All patients with COPD were men in the Pulmonological Division of the Regional State Autonomous Institution of Public Health Municipal Clinical Hospital No. 3 (Tomsk, Russia), with an average age of ; 10 of 12 of them were smokers with average smoking of . The details are shown in Table 1. Table 1Information about the group of patients with COPD.
All LC patients were men in the Thoraco-Abdominal Division of the Federal State Budget Scientific Institution Tomsk National Research Center of the Russian Academy of Medical Sciences (Tomsk, Russia), with an average age of ; 8 of 9 patients were smokers with average smoking of . The details are shown in Table 2. Table 2Information about the group of patients with lung cancer.
The control group consisted of nominally healthy males with an average age of . Exclusion criteria were the presence of “smoking” in their anamnesis vitae and the presence of diseases of the bronchopulmonary, cardiovascular, digestive, endocrine, reproductive, and urinary organ systems in the chronic form, as well as in the acute form during the 3 weeks prior to sampling. Exhaled breath samples (EBS) were collected in disposable plastic containers (syringe) with a volume of 150 ml and analyzed using the LaserBreeze gas analyzer. Additionally, EBS were collected in the Bio-VOC breath sampler with Supelco solid phase microextraction fiber holder 57330U. The extraction time was 30 min. All measurements were carried out at room temperature (variations were 20°C to 25°C) and humidity (50% to 60%). The EBS from the Bio-VOC breath sampler were analyzed by gas chromatography Finnigan Trace GC with MS detector Finnigan Trace DSQ (GC–MS). Processing of the data is produced in Qual Browser of Xcalibur software. For identification of VOCs, substances spectra obtained are compared with the substances spectra from the NIST MS Search 2.0 library. After the VOCs were identified, the area of chromatographic peaks was estimated manually on Xcalibur software as a concentration parameter of identified VOCs in EBS. To validate the suitability of the Bio-VOC breath sampler and plastic containers for sampling of the EBS, we filled both containers with nitrogen of 99% purity and analyzed the content by GC–MS technique. The measured chromatograms had no peaks, which indicate that the used samplers do not contribute any errors in analysis. An example of measured by the LaserBreeze gas analyzer absorption spectra of EBS from an LC patient and a healthy volunteer is presented in Fig. 3. Fig. 3An example of measured absorption spectra of EBS from LC patient and healthy volunteer in the spectral range from 2600 to 10,000 nm. 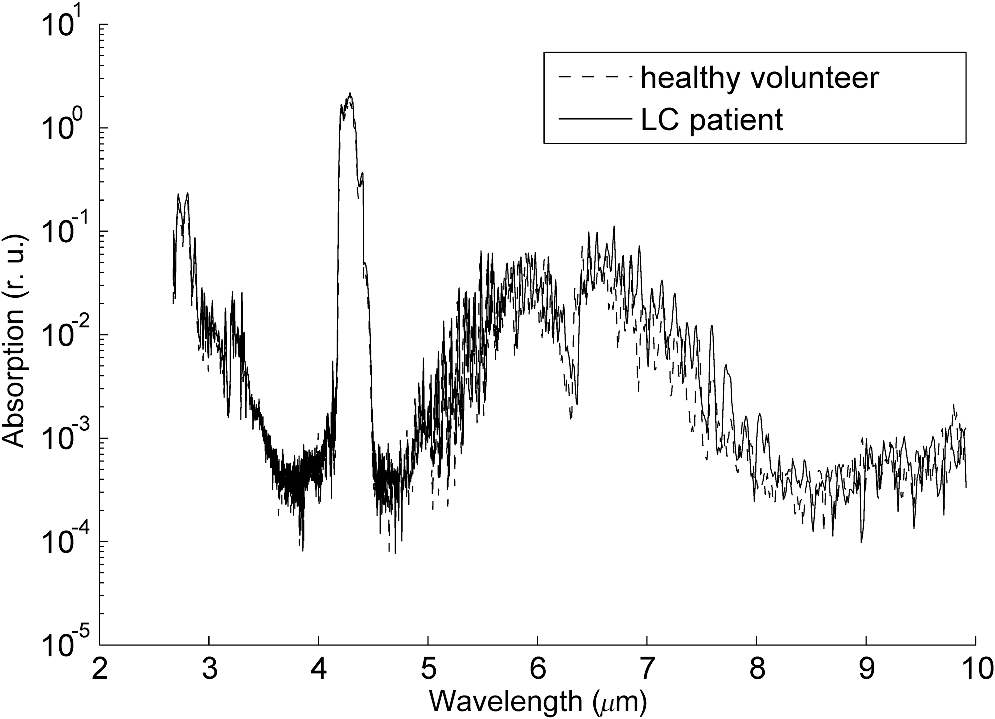 In the comparative analysis of slightly different feature vectors in high-dimensional feature space, there is a known problem of the homogeneity (weak visibility) of the similar vectors.32 To overcome this problem, we provided a two-step analysis of the measured spectra. First, the selection of informative features and reduction of the dimension of the feature space was realized using PCA preprocessing; thereafter, the classification was carried out using SVM. In contrast to standard approaches of PCA-SVM usage, we carried out the optimization procedure used for both classification principal components and SVM kernels and kernel parameters. At the latter step, we used the polynomial kernel, multilayer perceptron kernel, and Gaussian radial basis function.26 The teaching and testing sets were produced by splitting the initial data into a specific proportion. The random forming of teaching and testing sets was repeated 50 times, and the results were averaged. The results of dichotomous classification of EBS absorption spectra measured by the LaserBreeze gas analyzer are presented in Table 3. Table 3SVM classification of the testing set of EBS absorption spectra measured by the LaserBreeze gas analyzer for the groups under study (patients with lung cancer, COPD, and healthy volunteers).
Figure 4 shows the dichotomous classification of COPD-LC patients using the multilayer perceptron kernel. Round markers correspond to the reference vectors, cross-markers correspond to the COPD patients, and triangles mark LC patients. Fig. 4Classification of EBS absorption spectra from COPD and LC patients in the space of the principal components using SVM with the multilayer perceptron kernel. The projection on the plane of the first and fifth principal components is shown. 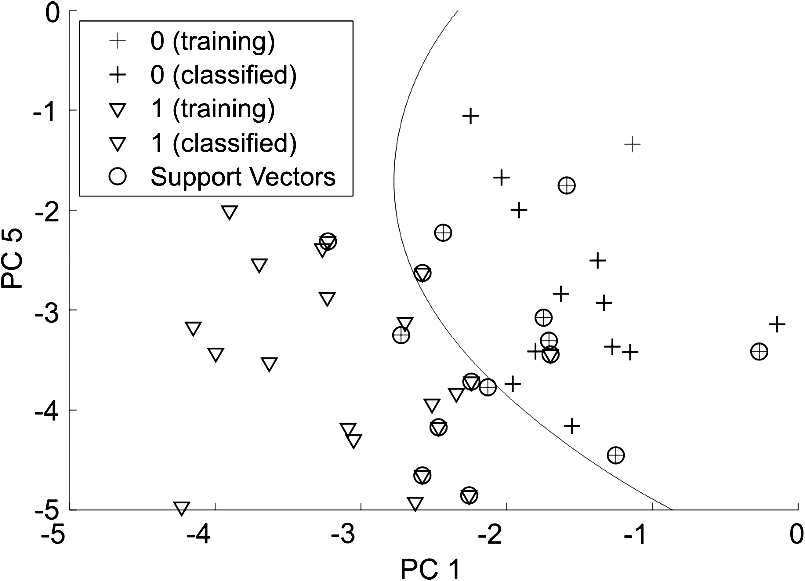 The profile of metabolites analyzed in EBS by the GC–MS method includes methanol, ethanol, acetonitrile, acetone, methylene chloride, pentane, ethylacetate, hexane, benzene, propyleneoxide chloride, n-ethylformamide, octane, toluene, butylacetate, chlorobenzene, o-xylene, decane, and chloroform. The results of the dichotomous classification of these profiles by a PCA-SVM combination technique as described above are presented in Table 4. Here, the training set consisted of five patterns for each group. Table 4SVM classification of the testing set of EBS absorption spectra measured by GC–MS for the groups under study (patients with lung cancer, COPD, and healthy volunteers).
Comparison of the results presented in Tables 3 and 4 shows that, in our case, the classification results obtained by LPAS are more promising than the results obtained by GC–MS. The above mentioned results allow one to construct the rules of differential diagnostics based on the set of SVM classifiers usage. There are several approaches to solve this problem using binary classifiers.33 According to the “One-vs-All” method, we had to construct -independent binary classifiers, so the every classifier will separate a specific class feature vectors from all other class’s feature vectors.34 According to the “One-vs-One” (also known as “All-vs-All”) method, we had to construct independent binary classifiers, each of which will separate ’th class feature vectors from ’th class feature vectors.35 The latter method was shown to provide the better results. The results of differential diagnostics based on EBS analysis by LPAS and three SVM dichotomous classifiers from Table 3 and the “One-vs-One” method are presented in Table 5. The estimations were carried out using a merged testing set that included LC, COPD patients, and healthy volunteers, as is shown in Table 5. Table 5Differential diagnostics based on the set of SVM classifiers usage.
The feature vector of a representative from the testing set was analyzed by every classifier from Table 3. The differential diagnostics rule was based on the result that was selected more times. Diagnosis did not set if all possible results of classification (LC–COPD–healthy) for definite representative from the testing set met the same number of times. 5.ConclusionEBS analysis is a promising tool for express and noninvasive analysis of biochemical processes in the human body and diagnosis of various diseases. In other words, a similar technique is useful for identifying specific metabolites in the EBS or for discrimination of metabolites–biomarkers profiles using pattern-recognition-based methods of data analysis. We used IR LPAS and GC–MS methods to provide spectral analysis of EBS. The analysis of measured spectra was based first on reduction of the dimension of the feature space using PCA; thereafter, the dichotomous classification was carried out using a SVM. The estimated average sensitivity of EBS analysis by the LPAS in dichotomous classification was not worse than 90%, the average specificity was not worse than 69%, and the analogous results of analysis by GC–MS were 68% and 60%, respectively. The results obtained in this study show high potential for the application of LPAS spectral analysis of the exhaled air samples in combination with the pattern-recognition-based approach for noninvasive screening tests of pulmonary diseases. The future steps in bringing this technology to clinics should include design of cost-effective and informative measurement devices, for example, specialized medical purpose LPAS equipment without unnecessary abilities and simple to use, accumulation of spectral information about exhaled air samples of patients with a confirmed diagnosis, and finding effective methods of data analysis and classification. DisclosuresAlexey A. Karapuzikov has a financial interest in Special Technologies, Ltd., which, however, did not provide financial support for this work. Except for this, no conflicts of interest, financial or otherwise, are declared by the authors. AcknowledgmentsThe work was carried out with the partial financial support of the FCPIR contract No. 14.578.21.0082 (ID RFMEFI57814X0082). The authors thank Jean Kollantai, Tomsk State University, for style review. ReferencesD. Smith and A. Amann, Breath Analysis For Clinical Diagnosis and Therapeutic Monitoring, World Scientific, Singapore
(2005). Google Scholar
D. Smith and A. Amann, Volatile Biomarkers: Non-Invasive Diagnosis in Physiology and Medicine, 1st ed.Elsevier, Austria
(2013). Google Scholar
X. Ping,
“Evaluation of repeated biomarkers: non-parametric comparison of areas under the receiver operating curve between correlated groups using an optimal weighting scheme,”
(2012). http://scholarcommons.usf.edu/etd/4261 Google Scholar
“Biomarkers and surrogate endpoints: preferred definitions and conceptual framework,”
Clin. Pharmacol. Ther., 69
(3), 89
–95
(2001). http://dx.doi.org/10.1067/mcp.2001.113989 Google Scholar
A. W. Boots et al.,
“Exhaled molecular fingerprinting in diagnosis and monitoring: validating volatile promises,”
Trends Mol. Med., 21
(10), 633
–644
(2015). http://dx.doi.org/10.1016/j.molmed.2015.08.001 Google Scholar
S. Kwiatkowska,
“Elevated exhalation of hydrogen peroxide and circulating IL-18 in patients with pulmonary tuberculosis,”
Respir. Med., 101
(3), 574
–580
(2007). http://dx.doi.org/10.1016/j.rmed.2006.06.015 Google Scholar
M. P. van der Schee et al.,
“Breathomics in lung disease,”
Chest, 147
(1), 224
–231
(2015). http://dx.doi.org/10.1378/chest.14-0781 CHETBF 0012-3692 Google Scholar
C. Lourenço and C. Turner,
“Breath analysis in disease diagnosis: methodological considerations and applications,”
Metabolites., 4 465
–498
(2014). http://dx.doi.org/10.3390/metabo4020465 Google Scholar
A. Amann et al.,
“Model based determination of detection limits for proton transfer reaction mass spectrometer,”
Meas. Sci. Rev., 10
(6), 180
–188
(2010). http://dx.doi.org/10.2478/v10048-010-0031-5 Google Scholar
W. Lindinger, A. Hansel and A. Jordan,
“On-line monitoring of volatile organic compounds at pptv levels by means of proton-transfer-reaction mass spectrometry (PTR-MS) medical applications, food control and environmental research,”
Int. J. Mass Spectrom. Ion Processes, 173
(3), 191
–241
(1998). Google Scholar
F. Obersteiner and H. A. Bönisch,
“Engel An automated gas chromatography time-of-flight mass spectrometry instrument for the quantitative analysis of halocarbons in air,”
Atmos. Meas. Tech., 9 179
–194
(2016). http://dx.doi.org/10.5194/amt-9-179-2016 Google Scholar
M. P. Fernandes, S. Venkatesh and B. G. Sudarshan,
“Early detection of lung cancer using nano-nose—a review,”
Open Biomed. Eng. J., 9 228
–233
(2015). http://dx.doi.org/10.2174/1874120701509010228 Google Scholar
M. Kuske, A.-C. Romain and J. Nicolas,
“Microbial volatile organic compounds as indicators of fungi. Can an electronic nose detect fungi in indoor environments?,”
Build. Environ., 40
(6), 824
–831
(2005). http://dx.doi.org/10.1016/j.buildenv.2004.08.012 Google Scholar
A. Miklós, P. Hess and Z. Bozóki,
“Application of acoustic resonators in photoacoustic trace gas analysis,”
Rev. Sci. Instrum., 72
(4), 1937
–1955
(2001). http://dx.doi.org/10.1063/1.1353198 Google Scholar
J. A. de Gouw et al.,
“Airborne measurements of ethene from industrial sources using laser photo-acoustic spectroscopy,”
Environ. Sci. Technol., 43
(7), 2437
–2442
(2009). http://dx.doi.org/10.1021/es802701a ESTHAG 0013-936X Google Scholar
F. G. C. Bijnen, J. Reuss and F. J. M. Harren,
“Geometrical optimization of a longitudinal resonant photoacoustic cell for sensitive and fast trace gas detection,”
Rev. Sci. Instrum., 67
(8), 2914
–2923
(1996). http://dx.doi.org/10.1063/1.1147072 RSINAK 0034-6748 Google Scholar
Z. Bozóki, A. Pogány and G. Szabó,
“Photoacoustic instruments for practical applications: present, potentials, and future challenges,”
Appl. Spec. Rev., 46 1
–37
(2011). http://dx.doi.org/10.1080/05704928.2010.520178 APSRBB 0570-4928 Google Scholar
J. Li, W. Chen and B. Yu,
“Recent progress on infrared photoacoustic spectroscopy techniques,”
Appl. Spectr. Rev., 46 440
–471
(2011). http://dx.doi.org/10.1080/05704928.2011.570835 APSRBB 0570-4928 Google Scholar
V. Zéninari et al.,
“Photoacoustic detection of methane in large concentrations with a Helmholtz sensor: simulation and experimentation,”
Int. J. Thermophys., 37
(1), 1
–11
(2016). http://dx.doi.org/10.1007/s10765-015-2019-8 IJTHDY 0195-928X Google Scholar
V. Zéninari et al.,
“Helmholtz resonant photoacoustic cell for spectroscopy of weakly absorbing gases and gas analysis,”
Atmos. Oceanic opt., 12
(10), 928
–940
(1999). http://dx.doi.org/10.1007/s00340-002-1000-y AOCOEK Google Scholar
C.-M. Lee et al.,
“High-sensitivity laser photoacoustic leak detector,”
Opt. Eng., 46
(6), 065002
(2007). http://dx.doi.org/10.1117/1.2746929 Google Scholar
A. I. Karapuzikov et al.,
“LaserBreeze gas analyzer for noninvasive diagnostics of air exhaled by patients,”
Phys. Wave Phen., 22
(3), 189
–196
(2014). http://dx.doi.org/10.3103/S1541308X14030054 Google Scholar
L. N. Eremenko, V. I. Kozintsev and V. A. Gorodnichev,
“Method of Bayesian estimates in the problem of laser gas analysis,”
Russ. Phys. J., 51
(9), 912
–918
(2008). http://dx.doi.org/10.1007/s11182-009-9135-5 RPJOEB 1064-8887 Google Scholar
A. Kotłowska,
“Application of chemometric techniques in search of clinically applicable biomarkers of disease,”
Drug Dev. Res., 75 283
–290
(2014). http://dx.doi.org/10.1002/ddr.2014.75.issue-5 DDREDK 1098-2299 Google Scholar
L. Pomerantsev and O. Y. Rodionova,
“Concept and role of extreme objects in PCA/SIMCA,”
J. Chemom., 28
(5), 429
–438
(2014). http://dx.doi.org/10.1002/cem.v28.5 JOCHEU 0886-9383 Google Scholar
G. R. G. Lanckriet et al.,
“Learning the kernel matrix with semidefinite programming,”
J. Mach. Learn. Res., 5 27
–72
(2004). Google Scholar
J. Pereira et al.,
“Breath analysis as a potential and non-invasive frontier in disease diagnosis: an overview,”
Metabolites, 5 3
–55
(2015). http://dx.doi.org/10.3390/metabo5010003 Google Scholar
R. R. Picard and R. D. Cook,
“Cross-validation of regression models,”
J. Am. Stat. Assoc., 79
(387), 575
–583
(1984). http://dx.doi.org/10.1080/01621459.1984.10478083 Google Scholar
J. Xia et al.,
“Translational biomarker discovery in clinical metabolomics: an introductory tutorial,”
Metabolomics., 9 280
–299
(2013). http://dx.doi.org/10.1007/s11306-012-0482-9 Google Scholar
A. Krilaviciute et al.,
“Detection of cancer through exhaled breath: a systematic review,”
Oncotarget, 6
(36),
(2015). http://dx.doi.org/10.18632/oncotarget.5938 Google Scholar
M. B. Shapiro and R. B. Marimont,
“Nearest neighbour searches and the curse of dimensionality,”
IMA J. Appl. Math., 24 59
–70
(1979). http://dx.doi.org/10.1093/imamat/24.1.59 IJAMDM 0272-4960 Google Scholar
M. Aly,
“Survey on multiclass classification methods,”
1
–9 Pasadena, California
(2005). Google Scholar
X. Zhao, S. Guan and K. L. Man,
“An output grouping based approach to multiclass classification using support vector machines,”
Adv. Multimedia Ubiquitous Eng., 393 389
–395
(2016). http://dx.doi.org/10.1007/978-981-10-1536-6 Google Scholar
J. Milgram, M. Cheriet and R. Sabourin,
“‘One against one’ or ‘one against all’: which one is better for handwriting recognition with SVMs?,”
in 10th Int. Workshop on Frontiers in Handwriting Recognition,
(2006). Google Scholar
BiographyYury V. Kistenev is a professor, deputy vice rector for Research of TSU, and he is the author of more than 120 journal papers, including patents and conference proceedings. His current research interests include application of laser photoacoustic spectroscopy in medicine and biology. Alexey V. Borisov, PhD, is an associate professor at TSU. His areas of scientific interests are biomedicine, optics, numerical analysis, and mathematical physics. Dmitry A. Kuzmin is a junior researcher of SSMU, and he is the author of more than 20 research papers. The present research interests include gas analysis, laser IR photoacoustic spectroscopy, data mining, and chemometrics. Olga V. Penkova is a junior researcher of TSU, and she is specialist in quantitative gas chromatographic analysis. |
||||||||||||||||||||||||||||||||||||||||||||||||||||||||||||||||||||||||||||||||||||||||||||||||||||||||||||||||||||||||||||||||||||||||||||||||||||||||||||||||||||||||||||||||||||||||||||||||||||||||||


