|
|
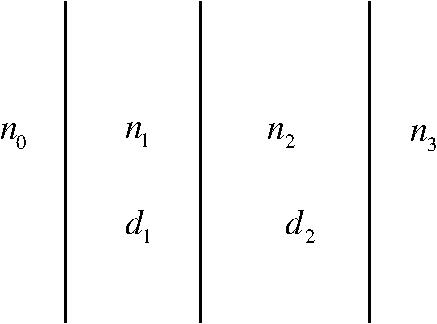
1.IntroductionOne of the main and most promising implementations of photonic investigations of structures is optical coherence tomography (OCT). This is a noninvasive interferometric imaging technique that provides high-resolution cross-sectional information of biological tissues and materials. First generation OCT systems, called time-domain OCT (TD-OCT), was reported in 1991 by Huang et al.1 for imaging of the human retina in vitro. In TD-OCT, the reference arm scan depth is used to measure the time-of-flight of the optical signal reflected from the sample. Fourier domain OCT (FD-OCT) was introduced by Fercher et al.2 In FD-OCT, the reference arm is fixed and the internal structure of the object is encoded in the spectral response of the sample field interfering with the reference beam and can be extracted by Fourier transformation. FD-OCT improves the detection sensitivity and enables significantly higher scan speeds than earlier TD-OCT.3–5 The short acquisition time, the elimination of moving parts, and the inherently direct access to spectral information have made FD-OCT favored over TD-OCT. Noncontact measurement of refractive index and thickness of OCT image data are of principal importance to biomedical applications and can greatly enhance diagnosis and treatment in medicine. For example, the refractive index and thickness of the cornea are related to hydration and intraocular pressure states and thus indicate the impact of laser refractive surgery.6 Also, a change in thickness map of human retina layers can be related to diseases such as glaucoma,7 diabetes,8 and several neuro-ophthalmic diseases such as Alzheimer’s, Parkinson’s, and multiple sclerosis.9 Therefore, accurate measurement of the retina layers true thickness and refractive index profile can help for early diagnosis and prognosis of the diseases. Various techniques have been proposed for simultaneous measurement of refractive index and thickness using an OCT system in both time domain10–32 and Fourier domain33–37 suitable for one-layer objects. For more than one-layer objects, the focus-tracking technique has been used to measure the refractive index and thickness of two- and three-layer systems (the cornea)38,39 and three layers of the skin40 but the accuracy of this technique is usually limited by the resolution of translation stages. Also, the Fourier domain approach has been used for three-layer silica–crown–dental composite–silica structure.41,42 In the proposed method, the real spectral data are fitted to a modeled signal spectrum searching for index and thickness. This approach is purely a fitting process without measuring index and thickness. In the search for a new approach, in this article, we introduce a theoretical method for simultaneous index and thickness measurement of multilayer systems using Fourier domain OCT without having previous information about the item under investigation. The working hypothesis of this study is that there is sufficient information in the optical spectrum acquired by currently available implementations of FD-OCT to extract both the physical structure and the refractive index profile of a stratified medium. 2.TheoryIn this section, the new theoretical framework for simultaneous measurement of refractive index and thickness of transparent multilayer systems suitable for biological applications is introduced. More detailed explanation can be found in Refs. 43 and 44. For biological samples with small refractive index contrast, the FD-OCT interference spectrum can be modeled using the well-known summation method.45 In this modeling approximation, multiple reflections inside the sample are ignored and only single scattering events are considered. For simplicity and without losing the generality, we use the framework to extract two-layer system parameters (refractive index and thickness of the layers and the last medium index of refraction) depicted in Fig. 1. We assume that the boundaries of this system are solid and ideally flat. We also assume that the object is nonabsorbing, isotropic, and homogeneous in refractive index. For such system, the normalized interference spectrum free from constant (DC) and autocorrelation (AC) terms can be described by where where , , and are the Fresnel coefficients, is the mismatch between the reference and sample arm lengths, and and are the optical path lengths (OPLs) of each layer measured from the Fourier transformation of interference spectrum. If we fed back the measured OPLs into Eq. (1) there are three Fresnel coefficients to be found. A set of three linearly independent equations is needed to solve for the Fresnel coefficients from three selected spectral components . The matrix equation to be solved is whereOnce the Fresnel coefficients are found, the refractive index of the layers and the last medium index of refraction may then be extracted directly, assuming the front medium index is known using Eq. (2). Thicknesses can be found by dividing the OPL by the corresponding index of refraction (). Not all sets of three spectral components can be used to solve Eq. (3) since, for some sets, the determinant of the matrix () is zero and hence the equation is unsolvable. The roots of the matrix’s determinant indicate that the chosen wavenumber components do not provide linearly independent equations and are mainly related to the components that provide the same phase information from two or more interfaces. In an ideal situation in which the actual OPL is known exactly, the roots of the determinant are the only restriction on selecting wavenumber components. However, in practice, there is always uncertainty () associated with the measured OPL () so the value input into the parameter extraction algorithm may deviate from the actual OPL () so that Since in practice, the matrix in Eq. (4) is constructed from the measured OPLs, there is a nonlinear frequency shift between the matrix and the signal on the right-hand side of Eq. (3). Therefore, in the presence of , there will be more constraints on wavenumber components and inappropriate selection of the wavenumber components leads to erroneous results. Given that this matrix equation presents a coupled set of transcendental equations containing index terms on both sides of the equal signs, the impact of on index determination is not transparent so the behavior of the extracted parameters is best investigated by simulation. A framework for selecting the suitable spectral components in the presence of was given in the first part of this article.43,44 The impact of increasing on the parameter extraction is investigated in this article to find out what is the maximum that still allows the extraction of the parameters and how much is the accuracy loss in each parameter as increases. 3.Sample Parameters Extraction for a Range ofWe investigate the impact of measured optical path error, , on the extracted parameters of a two-layer systems (i.e., , , , , ). We generate an experimental FD-OCT signal using transfer matrix method (TMM) and use the formalism to extract the parameters for a range of induced to both layers measured OPL. As an illustrative test model, we consider a low contrast test model with specification as , , , , and and . We extract the parameters of this model for ranging from to for each layer with increment and compare the extracted indices and thicknesses as per the methodology developed in the previous section. We have found that has a neutral impact on the result and hence, for the tests in this article, we set .43 The test result is shown in Fig. 2 where the error in the extracted parameters (vertical axis) is plotted versus on the horizontal axis. The index error is shown on the left panel of Fig. 2 and the thickness error is shown on the right panel. Fig. 2Impact of the optical thickness measurement error, , on the accuracy of the extracted parameters. (a) The error of the extracted index of refraction and (b) the relative error in the extracted thicknesses.  It is seen from the right panel of Fig. 2 that even for large amounts of comparable to the size of the object, the extracted refractive indices errors stay between to in this particular example. This is due to the fact that affects only the matrix in Eq. (3) which is periodic and never diverges with . For higher contrast test models, the extracted index errors will be larger due to increase in multiple reflections which are ignored by the summation method. Since the physical thickness is extracted from the optical thickness divided by the corresponding index of refraction, the error of thickness on the right panel of Fig. 2 is related to and error of index via Therefore, the relative error in extracted thicknesses has steeper slope for smaller OPL. 4.Approach to Parameter ImprovementIt was shown in the previous section that in a realistic case of having no zero our methodology can quickly result in significant errors. In order to enhance the parameters extraction and deal with large values of which may occur in practice, an additional process is needed. We use an optimization method by constructing a modeled FD-OCT normalized signal similar to Eqs. (1) and (2) and fit the modeled signal to the actual data obtained from the digitally constructed TMM. In other words, we try to fit a summation (single scattering) spectrum to the TMM (multiple scattering) spectrum. Our modeled signal is In Eq. (7), the fitting (floating) parameters, , , , , and are mapped to , , , , and , respectively. The initial guess values for , , are used from the extracted indices obtained from Eq. (3) and , from the measured optical paths , .Accurate determination of floating parameters and is very important to achieve the best fit between the modeled and actual spectrum because they describe the frequency of the spectrum. During the search process, when the initial guess values are not close enough to the actual values, it is more likely that the algorithm is stopped at a local minimum of the residual root sum square (RSS) of difference between the modeled and actual spectrum. In this situation, the floating parameters cannot be found accurately. In order to prevent the fitting algorithm from stopping at local minima of RSS, the program randomly sweeps and within a range around the initial guess values and calculates the RSS for each set of and to search for the lowest RSS. Therefore, our fitting process is composed of three steps:
Since the algorithm must search for all possible combinations of and within a given interval, step 2 of the algorithm given above randomly changes and and checks the RSS until the global minimum RSS is found. The algorithm in this sense is a simple implementation of a Monte Carlo search. The additional step provided in the searching algorithm forces the algorithm to jump over local minima and check for more suitable values of RSS; therefore, it is more likely to find the best estimate available. As with any Monte Carlo algorithm, the number of points searched is important to ensure finding the global minimum of the RSS. The step 3 mentioned above provides the final extracted indices and optimized OPL (, ) from the global minimum RSS that was found in the previous step. Finally, the thicknesses are obtained from and . 4.1.Optimized Results for Range ofWe are now going to investigate the optimization method for a range of . We recall the test model used in Sec. 2 of this article for ranging from to for both layers with increment. The simulation program was asked to increase the number of searches until all indices , , and are found with the absolute error . The test result is shown in Fig. 3. On the left axis of this figure is shown the extracted refractive index errors and on the right axis is shown the estimated number of searches required versus on the horizontal axis. The error in this figure is the deviation of fitting parameters from their true values . Fig. 3Impact of the number of searches on the accuracy of the extracted indices of the optimization method. On the left axis is shown the error of the extracted refractive indices and on the right axis is shown the required number of searches.  It can be seen from Fig. 3 that once we have enough numbers of searches, even for the very large amount of , there is a convergence to highly accurate refractive index values. For a limited number of searches, the range of for which we can extract parameters with the acceptable error would be limited. 4.2.Index ContrastIn this section, we investigate the impact of refractive index profile on two-layer system parameter errors extracted by the optimization method while the method is insensitive to thickness profile as described in Part 1, Sec. 3.2.44 Both layers thickness is fixed at and the optical paths measurement error of is induced for both layers. The test models are generated with and varying from 1.337 to 1.9 in 0.011 increments (total number of 2600 test models) while but must still be extracted by the software. The test result is shown in the following three figures where the horizontal axis corresponds to actual and the vertical axis corresponds to actual , and the color maps are the extracted parameter errors without any optimization [direct output of Eq. (3), the right panel] and after performing the optimization method (the left panel). The error distribution corresponding to the extracted is shown in Fig. 4. It can be seen from Fig. 4(b) of that can be extracted by the optimization method with absolute error , suitable for biological applications, in the entire space tested. Without optimization, Fig. 4(a), we observe very poor extraction of where error varies between and 2.13. The figure shows that the optimization method improves greatly the usefulness of this solution. Fig. 4Error distribution of the extracted with . The horizontal axis corresponds to varying and the vertical axis corresponds to varying . (a) The error map of initial (guess) values corresponding to and (b) the error map of extracted by the optimization method.  The error distribution corresponding to the extracted is shown in Fig. 5. From Fig. 5(b), can be extracted by the optimization method with absolute error in area limited by and . Without optimization, Fig. 5(a), error in varies between and 3.18. Fig. 5Error distribution of the extracted with . The horizontal axis corresponds to varying and the vertical axis corresponds to varying . (a) The error map of initial (guess) values corresponding to and (b) the error map of extracted by the optimization method.  The error distribution corresponding to the extracted is shown in Fig. 6. From Fig. 6(b), can be extracted by the optimization method with absolute error in area limited by and . Without optimization, error in varies between and 1.78 and never reaches the targeted accuracy. 5.ConclusionIn conclusion, we introduced in this article (together with its first part)44 a framework for simultaneous extraction of refractive index and thickness of transparent multilayer systems without any previous information about the item under investigation from its FD-OCT data. No additional arrangement, reference reflector, or mechanical scanning is needed, which is the main advantage of this approach. It was shown that the measured OPL uncertainty has a significant impact on parameters extraction, but this factor can be overcome through the introduced optimization method even for the relatively large amount of uncertainty in measured OPL comparable to the size of the object. The optimization approach enhances the final results superlatively and the simulation shows that the potential accuracy of the method is high enough for biological applications. The accuracy of the method depends mainly on the refractive index contrast of the object while it is independent of the sample’s physical thickness. This is because in the theoretical model, only single scattering events are taken into account and this approximation is not efficient for large index contrast objects. It was also shown that using the optimization method, all parameters of a two-layer system and the last medium index of refraction can be obtained with the absolute error when . This implies that the maximum tolerable index contrast of the optimization method is in the range of . Therefore, this method can be suitable for biological applications in which the refractive index rarely exceeds 1.45. Some practical implementation limitations need to be investigated more deeply to better understand the real limits of the solution. The two most important are likely speckle noise and the impact of the focusing optical beam (nonuniform sample illumination) which are left for future work. DisclosuresThe authors have no relevant financial interests in this article and no other potential conflicts of interest to disclose. AcknowledgmentsThe authors would like to thank members of the PTC Community, Programming and Extending Mathcad online forum for their advice on simulation and programming techniques. ReferencesD. Huang et al.,
“Optical coherence tomography,”
Science, 254
(5035), 1178
–1181
(1991). http://dx.doi.org/10.1126/science.1957169 SCIEAS 0036-8075 Google Scholar
A. F. Fercher et al.,
“Measurement of intraocular distances by backscattering spectral interferometry,”
Opt. Commun., 117 43
–48
(1995). http://dx.doi.org/10.1016/0030-4018(95)00119-S OPCOB8 0030-4018 Google Scholar
R. Leitgeb, C. Hitzenberger and A. Fercher,
“Performance of Fourier domain vs time domain optical coherence tomography,”
Opt. Express, 11
(8), 889
(2003). http://dx.doi.org/10.1364/OE.11.000889 OPEXFF 1094-4087 Google Scholar
M. Choma et al.,
“Sensitivity advantage of swept source and Fourier domain optical coherence tomography,”
Opt. Express, 11
(18), 2183
(2003). http://dx.doi.org/10.1364/OE.11.002183 OPEXFF 1094-4087 Google Scholar
J. F. de Boer et al.,
“Improved signal-to-noise ratio in spectral-domain compared with time-domain optical coherence tomography,”
Opt. Lett., 28
(21), 2067
(2003). http://dx.doi.org/10.1364/OL.28.002067 OPLEDP 0146-9592 Google Scholar
Y. L. Kim et al.,
“Variation of corneal refractive index with hydration,”
Phys. Med. Biol., 49
(5), 859
–868
(2004). http://dx.doi.org/10.1088/0031-9155/49/5/015 PHMBA7 0031-9155 Google Scholar
M. A. Mayer et al.,
“Retinal nerve fiber layer segmentation on FD-OCT scans of normal subjects and glaucoma patients,”
Biomed. Opt. Express, 1
(5), 1358
–1383
(2010). http://dx.doi.org/10.1364/BOE.1.001358 BOEICL 2156-7085 Google Scholar
S. J. Chiu et al.,
“Kernel regression based segmentation of optical coherence tomography images with diabetic macular edema,”
Biomed. Opt. Express, 6
(4), 1172
–1194
(2015). http://dx.doi.org/10.1364/BOE.6.001172 BOEICL 2156-7085 Google Scholar
T. Garcia et al.,
“Optical coherence tomography in neuro-ophthalmology,”
Optical Coherence Tomography, 77
–100 InTech, Vienna, Austria
(2013). Google Scholar
W. V. Sorin and D. F. Gray,
“Simultaneous thickness and group index measurement using optical low-coherence reflectometry,”
IEEE Photonics Technol. Lett., 4
(1), 105
–107
(1992). http://dx.doi.org/10.1109/68.124892 IPTLEL 1041-1135 Google Scholar
K. Watanabe, M. Ohshima and T. Nomura,
“Simultaneous measurement of refractive index and thickness distributions using low-coherence digital holography and vertical scanning,”
J. Opt., 16
(4), 45403
(2014). http://dx.doi.org/10.1088/2040-8978/16/4/045403 Google Scholar
H.-C. Cheng and Y.-C. Liu,
“Simultaneous measurement of group refractive index and thickness of optical samples using optical coherence tomography,”
Appl. Opt., 49
(5), 790
(2010). http://dx.doi.org/10.1364/AO.49.000790 APOPAI 0003-6935 Google Scholar
C.-T. Yen et al.,
“Simultaneously measuring the refractive index and thickness of an optical sample by using improved fiber-based optical coherence tomography,”
Opt. Eng., 53
(4), 044108
(2014). http://dx.doi.org/10.1117/1.OE.53.4.044108 Google Scholar
Y.-P. Wang et al.,
“Reflectometry measuring refractive index and thickness of polymer samples simultaneously,”
J. Mod. Opt., 53
(13), 1845
–1851
(2006). http://dx.doi.org/10.1080/09500340600654764 JMOPEW 0950-0340 Google Scholar
G. J. Tearney et al.,
“Determination of the refractive index of highly scattering human tissue by optical coherence tomography,”
Opt. Lett., 20
(21), 2258
(1995). http://dx.doi.org/10.1364/OL.20.002258 OPLEDP 0146-9592 Google Scholar
M. Ohmi et al.,
“Simultaneous measurement of refractive index and thickness of transparent plates by low coherence interferometry,”
Opt. Rev., 4
(4), 507
–515
(1997). http://dx.doi.org/10.1007/s10043-997-0507-1 1340-6000 Google Scholar
M. Ohmi et al.,
“In vitro simultaneous measurement of refractive index and thickness of biological tissue by the low coherence interferometry,”
IEEE Trans. Biomed. Eng., 47
(9), 1266
–1270
(2000). http://dx.doi.org/10.1109/10.867961 IEBEAX 0018-9294 Google Scholar
M. Haruna et al.,
“Simultaneous measurement of the phase and group indices and the thickness of transparent plates by low-coherence interferometry,”
Opt. Lett., 23
(12), 966
(1998). http://dx.doi.org/10.1364/OL.23.000966 OPLEDP 0146-9592 Google Scholar
H. Maruyama et al.,
“Low-coherence interferometer system for the simultaneous measurement of refractive index and thickness,”
Appl. Opt., 41
(7), 1315
(2002). http://dx.doi.org/10.1364/AO.41.001315 APOPAI 0003-6935 Google Scholar
T. Fukano and I. Yamaguchi,
“Separation of measurement of the refractive index and the geometrical thickness by use of a wavelength-scanning interferometer with a confocal microscope,”
Appl. Opt., 38
(19), 4065
(1999). http://dx.doi.org/10.1364/AO.38.004065 APOPAI 0003-6935 Google Scholar
S. Kim et al.,
“Simultaneous measurement of refractive index and thickness by combining low-coherence interferometry and confocal optics,”
Opt. Express, 16
(8), 5516
(2008). http://dx.doi.org/10.1364/OE.16.005516 OPEXFF 1094-4087 Google Scholar
H. Maruyama et al.,
“Simultaneous measurement of refractive index and thickness by low coherence interferometry considering chromatic dispersion of index,”
Opt. Rev., 7
(5), 468
–472
(2000). http://dx.doi.org/10.1007/s10043-000-0468-0 1340-6000 Google Scholar
M. Ohmi et al.,
“High-speed simultaneous measurement of refractive index and thickness of transparent plates by low-coherence interferometry and confocal optics,”
Meas. Sci. Technol., 15
(8), 1531
–1535
(2004). http://dx.doi.org/10.1088/0957-0233/15/8/017 MSTCEP 0957-0233 Google Scholar
T. Fukano and I. Yamaguchi,
“Simultaneous measurement of thicknesses and refractive indices of multiple layers by a low-coherence confocal interference microscope,”
Opt. Lett., 21
(23), 1942
(1996). http://dx.doi.org/10.1364/OL.21.001942 OPLEDP 0146-9592 Google Scholar
X. Wang et al.,
“Simultaneous refractive index and thickness measurements of bio tissue by optical coherence tomography,”
J. Biomed. Opt., 7
(4), 628
–632
(2002). http://dx.doi.org/10.1117/1.1501887 JBOPFO 1083-3668 Google Scholar
S. A. Alexandrov et al.,
“Bifocal optical coherenc refractometry of turbid media,”
Opt. Lett., 28
(2), 117
–119
(2003). http://dx.doi.org/10.1364/OL.28.000117 OPLEDP 0146-9592 Google Scholar
A. Zvyagin et al.,
“Refractive index tomography of turbid media by bifocal optical coherence refractometry,”
Opt. Express, 11
(25), 3503
–3517
(2003). http://dx.doi.org/10.1364/OE.11.003503 OPEXFF 1094-4087 Google Scholar
G. Min, J. W. Kim and B.-H. Lee,
“The refractive index measurement technique based on the defocus correction method in full-field optical coherence tomography,”
Proc. SPIE, 8428 84281M
(2012). http://dx.doi.org/10.1117/12.922398 Google Scholar
G. Min et al.,
“Refractive index measurements of multiple layers using numerical refocusing in FF-OCT,”
Opt. Express, 21
(24), 29955
–29967
(2013). http://dx.doi.org/10.1364/OE.21.029955 OPEXFF 1094-4087 Google Scholar
A. Hirai and H. Matsumoto,
“Low-coherence tandem interferometer for measurement of group refractive index without knowledge of the thickness of the test sample,”
Opt. Lett., 28
(21), 2112
–2114
(2003). http://dx.doi.org/10.1364/OL.28.002112 OPLEDP 0146-9592 Google Scholar
H. Matsumoto, K. Sasaki and A. Hirai,
“In situ measurement of group refractive index using tandem low-coherence interferometer,”
Opt. Commun., 266
(1), 214
–217
(2006). http://dx.doi.org/10.1016/j.optcom.2006.04.082 OPCOB8 0030-4018 Google Scholar
D. F. Murphy and D. A. Flavin,
“Dispersion-insensitive measurement of thickness and group refractive index by low-coherence interferometry,”
Appl. Opt., 39
(25), 4607
(2000). http://dx.doi.org/10.1364/AO.39.004607 APOPAI 0003-6935 Google Scholar
J. Jin et al.,
“Thickness and refractive index measurement of a silicon wafer based on an optical comb,”
Opt. Express, 18
(17), 18339
–18346
(2010). http://dx.doi.org/10.1364/OE.18.018339 OPEXFF 1094-4087 Google Scholar
J. Na et al.,
“Self-referenced spectral interferometry for simultaneous measurements of thickness and refractive index,”
Appl. Opt., 48
(13), 2461
(2009). http://dx.doi.org/10.1364/AO.48.002461 APOPAI 0003-6935 Google Scholar
Y.-S. Ghim and S.-W. Kim,
“Thin-film thickness profile and its refractive index measurements by dispersive white-light interferometry,”
Opt. Express, 14
(24), 11885
(2006). http://dx.doi.org/10.1364/OE.14.011885 OPEXFF 1094-4087 Google Scholar
S. J. Park et al.,
“Simultaneous measurements of refractive index and thickness by spectral-domain low coherence interferometry having dual sample probes,”
IEEE Photonics Technol. Lett., 23
(15), 1076
–1078
(2011). http://dx.doi.org/10.1109/LPT.2011.2155642 IPTLEL 1041-1135 Google Scholar
P. H. Tomlins and R. K. Wang,
“Simultaneous analysis of refractive index and physical thickness by Fourier domain optical coherence tomography,”
IEE Proc. Optoelectron., 153
(5), 222
(2006). http://dx.doi.org/10.1049/ip-opt:20050115 IPOPE8 1350-2433 Google Scholar
T. Lai and S. Tang,
“Cornea characterization using a combined multiphoton microscopy and optical coherence tomography system,”
Biomed. Opt. Express, 5
(5), 1494
(2014). http://dx.doi.org/10.1364/BOE.5.001494 BOEICL 2156-7085 Google Scholar
Y. Zhou et al.,
“Characterizing refractive index and thickness of biological tissues using combined multiphoton microscopy and optical coherence tomography,”
Biomed. Opt. Express, 4
(1), 38
–50
(2013). http://dx.doi.org/10.1364/BOE.4.000038 BOEICL 2156-7085 Google Scholar
A. Knüttel and M. Boehlau-Godau,
“Spatially confined and temporally resolved refractive index and scattering evaluation in human skin performed with optical coherence tomography,”
J. Biomed. Opt., 5
(1), 83
–92
(2000). http://dx.doi.org/10.1117/1.429972 JBOPFO 1083-3668 Google Scholar
P. H. Tomlins and R. K. Wang,
“Matrix approach to quantitative refractive index analysis by Fourier domain optical coherence tomography,”
J. Opt. Soc. Am. A, 23
(8), 1897
(2006). http://dx.doi.org/10.1364/JOSAA.23.001897 JOAOD6 0740-3232 Google Scholar
P. H. Tomlins and R. K. Wang,
“Layer dependent refractive index measurement by Fourier domain optical coherence tomography,”
Proc. SPIE, 6079 607913
(2006). http://dx.doi.org/10.1117/12.645719 Google Scholar
P. Rajai, Measurement of Refractive Index and Thickness of Multi Layer Systems Using Fourier Domain Optical Coherence Tomography, 46
–65 University of Ottawa(2016). Google Scholar
P. Rajai et al.,
“Simultaneous measurement of refractive index and thickness of multilayer systems using Fourier domain optical coherence tomography, part 1: theory,”
J. Biomed. Opt., 22
(1), 015002
(2017). http://dx.doi.org/10.1117/1.JBO.22.1.015002 Google Scholar
J. A. Izatt, M. A. Choma,
“Theory of optical coherence tomography,”
Optical Coherence Tomography, 47
–72 Springer, Berlin Heidelberg
(2008). Google Scholar
BiographyPayman Rajai received his bachelor’s degree and master’s degree in applied physics from Islamic Azad University, Tehran, Iran, in 1995 and 2000, respectively, and his PhD in physics from the University of Ottawa in 2016. He has also spent over 10 years in the contact lens manufacturing industry. Henry Schriemer received his PhD in physics from the University of Manitoba in 1997. He is an associate professor in electrical engineering at the University of Ottawa where he previously held an NCIT Research Fellowship in Photonics after spending several years in the photonics industry. Other recent activities have ranged across the photovoltaics landscape, with a present focus on energy management for smart grids. He has authored over 90 peer-reviewed publications. Ahmad Amjadi received his master’s degree and PhD from Michigan State University, USA, in 1982 and 1986, respectively. Currently, he is an associate professor in Physics Department of Sharif University of Technology, Tehran, Iran and head of Sharif Applied Physics Research Center since 2003. His research interest is medical physics especially application of lasers in medical research. Rejean Munger received his MSc and PhD degrees from the Physics Department, University of Waterloo, Ontario, Canada, in 1986 and 1990, respectively. He was a lecturer and research associate at the School of Optometry of the University of Waterloo (1989–1994) and a research associate at the National Research Council Canada (1994–1996). He then joined the University of Ottawa Eye Institute doing biomedical photonic research until 2013. Since, he has focused on the development of several startup biomedical photonic ventures. |