|
|
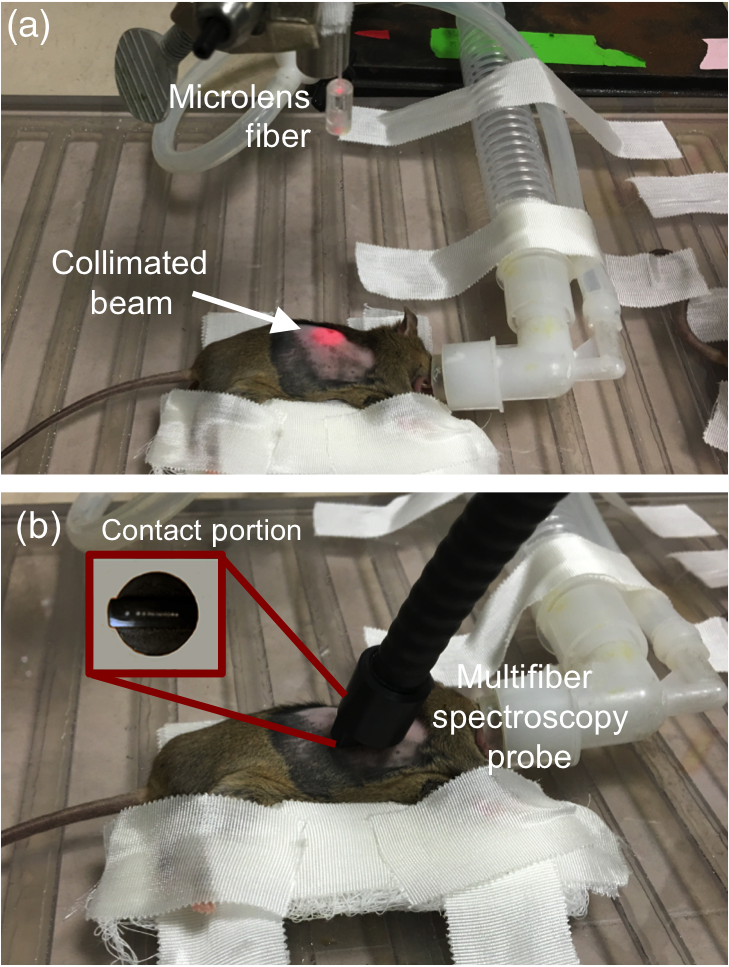
1.IntroductionAs a nonionizing radiation treatment, photodynamic therapy (PDT) has been used effectively for the treatment of various easily accessible lesions, such as head and neck cancers, esophageal cancers, microinvasive lung cancer, and skin lesions such as premalignant actinic keratosis.1–4 PDT requires the administration of a photosensitizer that localizes in tumor tissue and is excited by the appropriate treatment wavelength of light. With the absorption of light, the photosensizer transitions from its ground state to a short-lived excited singlet state. The singlet state photosensitizer transitions to a longer-lived electronically excited triplet state via intersystem crossing. In typical type II PDT, which is the focus of this study, the triplet state transfers energy to molecular ground state oxygen () that is present in the treatment environment to produce singlet-state oxygen (). The production of and reactions with the surrounding biological molecules are thought to be the major cause of cytotoxicity.5 Due to the high reactivity and short lifetime of , only cells that are proximal to the area of production are directly affected by PDT.6 For that reason, PDT causes significantly less harm to healthy tissue than chemotherapy or radiation.6,7 A well-defined dosimetric metric for PDT that is able to predict clinical outcomes that can also be implemented in a clinical setting would benefit the advance of the PDT field. Benzoporphyrin derivative monoacid ring A (BPD, trademark Visudyne®) is a commonly used photosensitizer that was approved by the US Food and Drug Administration in 2000 for the treatment of wet age-related macular degeneration.8 Utilizing a macroscopic model, reacted singlet oxygen () can be calculated to evaluate its effectiveness as a dosimetric predictor for BPD-mediated PDT outcome. In addition, several other dose metrics were evaluated in this study, including total light fluence, photobleaching ratio, and PDT dose, to predict the PDT outcome. Radiation-induced fibrosarcoma (RIF) tumors on mice were treated with BPD-PDT and a range of in-air fluences (30 to ) and in-air fluence rates (50 to ). For each PDT treatment group, explicit measurements of BPD concentration in tumor and tissue optical properties were performed pre- and posttreatment. For a subset of mice, real-time in-vivo measurement of BPD concentration and tissue oxygenation level () throughout PDT were taken to optimize the photosensitizer-specific PDT photochemical parameters (, , and ), reduce their uncertainty from a previous study, and calculate . These photochemical parameters were used to calculate for each PDT treatment group. Other dose metrics, such as photobleaching ratio and PDT dose, were determined either directly using explicit measurements pre- and post-PDT or calculated using the time dependence of BPD concentration based on the macroscopic model and the definition of PDT dose. This study, to our knowledge, is the first to investigate the threshold value of and the relationship between various dose metrics (fluence, PDT dose, and ) and the cure index (CI) at 14 days in an in-vivo mouse model for BPD-mediated PDT. The results of our study with additional real-time measurements of BPD concentration and provide reduced uncertainties for the photochemical parameters determined for BPD-mediated PDT, as well as a validation that our macroscopic model can accurately predict the oxygen consumption for BPD-mediated PDT, making it feasible to determine without oxygen measurements. 2.Theory and Methods2.1.Tumor ModelRIF cells were cultured and were injected at in the right shoulders of 6 to 8 week old female C3H mice (NCI-Frederick, Frederick, Maryland), as described previously.9–12 Animals were under the care of the University of Pennsylvania Laboratory Animal Resources. All studies were approved by the University of Pennsylvania Institutional Animal Care and Use Committee. Tumors were treated when they were to 5 mm in diameter. The fur of the tumor region was clipped prior to cell inoculation, and the treatment area was depilated with Nair (Church & Dwight Co., Inc., Ewing, New Jersey) at least 24 h before measurements. Mice were provided a chlorophyll-free (alfalfa-free) rodent diet (Harlan Laboratories Inc., Indianapolis, Indiana) starting at least 10 days prior to treatment to eliminate the fluorescence signal from chlorophyll-breakdown products, which have a similar emission range to the BPD fluorescence spectra used to determine the concentration of BPD in the tumor. During the whole treatment, mice were kept under anesthesia on a heat pad at 38°C [see Fig. 1(a)]. 2.2.Measurement of Interstitial Benzoporphyrin Derivative Monoacid Ring A ConcentrationFluorescence measurements were made by a custom-made multifiber spectroscopic contact probe [Fig. 1(b)] described previously13,14 and analyzed using single value decomposition (SVD) fitting.15 Spectra were measured both before and after treatment to investigate the effects of and relationship between photobleaching and outcome. An empirical optical property correction factor (CF) is defined as the ratio of SVD between the tissue optical properties of interest (, ) to the corresponding SVD for a reference tissue optical properties , ,13,16 with BPD as the photosensitizer and optical properties measured at 690 nm. A multiplicative CF of the following form was used to multiply by raw SVD to obtain :17 The input optical properties are those measured at 690 nm. The factor was used on raw fluorescence SVD by multiplying it with CF to get . The values were optimized so that for phantoms with the same concentration of BPD were matched [Fig. 2(a)]. Upon optimization, it was found that , , , and . In previous publications,13,16 the dependence in Fig. 2(a) was reversed, and incorrect CF parameters were provided for the collimated beam geometry and their respective wavelengths. A separate tissue-simulating phantom with constant scattering and absorption and varying amounts of BPD were used as a calibration curve to correlate to actual concentration in [Fig. 2(b)]. The line of best-fit [shown as a solid line in Fig. 2(b)] is used to convert to [BPD] in units of . Figure 2(c) shows the comparison of in-vivo and ex-vivo measurements using methods described previously,13,16 with a solid line of best-fit of the form with to indicate agreement to within 2%. The dashed line represents the line for . Real-time in-vivo BPD concentration measurement over the course of treatment (, 2000 s exposure time) was also determined for a subset of four mice (not included in Table 3) using characteristic fluorescence spectra obtained at 30- to 300-s time intervals with excitation at the treatment light. SVD fitting was used to determine the BPD concentration. Measured data are shown in Fig. 3(a) with symbols. Fig. 2Fluorescence optical property correction phantoms and verification with in-vivo and ex-vivo comparison. (a) Fluorescence SVD amplitude for phantom experiments with varying optical properties and the same BPD concentration (). The best-fit (shown as dashed lines) uses the form , where CF is Eq. (2) and . (Note, is normalized for , .) (b) BPD concentration (in ) versus the corrected SVD (). The line of best-fit with is used to convert to [BPD] in . (c) The measured in-vivo photosensitizer concentration using the multifiber contact probe obtained fluorescence spectra versus ex-vivo measured BPD concentration. The line of best-fit is of the form with . The dashed line in (c) represents the line for .  Fig. 3Real-time in-vivo measurement of (a) BPD concentration ([BPD]) at the tumor surface and (b) concentration at 3 mm depth measured for four mice over the course of PDT light delivery (, ). The open symbols represent measured data and the solid curves represent the model-calculated [BPD] and using Eqs. (4) and (5) and the photochemical parameters listed in Table 2. The black “x” symbols and dashed black line represent the mean data and fit to data, respectively. The PDT parameters used to model the mean data are summarized in Table 1. 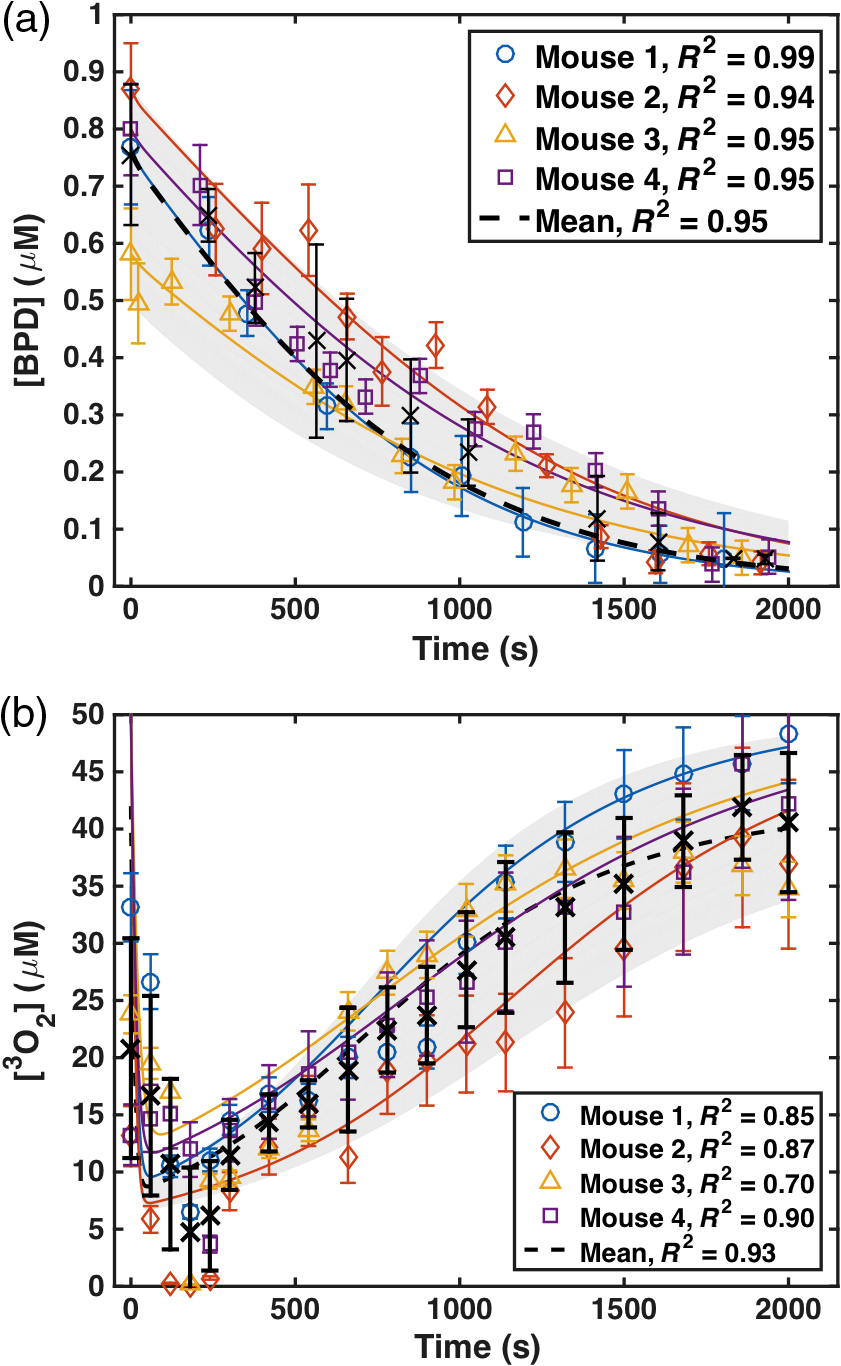 Table 1Photochemical parameters for BPD based on Ref. 20. The standard deviation for each parameter is based on the fitting of all mice [dashed line in Fig. 3(b)] and is smaller than those in Ref. 20.
Table 2PDT parameters (σ, ξ, and g) obtained for four mice treated with in-air fluence of 160 J/cm2 and in-air fluence rate of φair=80 mW/cm2 using individual fitting to [O23](t) and [S0](t) simultaneously (see Fig. 3). The other photochemical parameters (δ=33 μM and β=11.9 μM) are kept the same as in Table 1.
2.3.Tissue Oxygen Concentration MeasurementsFor a subset of four mice (summarized in Table 2) administered with BPD (), the in-vivo tissue oxygen partial pressure was measured during PDT treatment using a phosphorescence-based bare fiber-type probe (OxyLite Pro with NX-BF/O/E, Oxford Optronix, Oxford, United Kingdom) for an in-air light fluence rate of for 2000 s. Measurements are presented for each 30 s interval during treatment. Then, concentration was calculated by multiplying the measured with solubility in tissue, which is .18,19 Measured was used to refine the photochemical parameters previously determined20 for the singlet oxygen explicit dosimetry model used to calculate , and obtained values are summarized in Table 2. Individually measured for each mouse were fit with the model-calculated values. Measured data are shown with symbols and calculated fits are shown with lines in Fig. 3(b). 2.4.Photodynamic Therapy TreatmentAn optical fiber with a microlens attachment was coupled with a 690-nm diode laser with a maximum output power of 8 W (B&W Tek Inc., Newark, Delaware) to produce a collimated beam with a diameter of 1 cm on the surface of the tumor [Fig. 1(a)]. Mice were treated with in-air fluence rates () of 50 to and total in-air fluences of 30 to at 690 nm to induce different PDT outcomes and assess the reciprocity between BPD concentration and light dose. The “in-air fluence rate” is defined as the calculated irradiance determined by laser power divided by the treatment area. The “in-air fluence” was calculated by multiplying the “in-air fluence rate” by the treatment time. All mice were injected with BPD through tail injection at 3 h before the PDT treatment. RIF tumor-bearing mice with (i) no BPD and no light excitation and mice with (ii) no BPD but highest light excitation ( and 2333 s exposure) were used as controls (). 2.5.Tumor Regrowth Rate AnalysisTumor volumes were tracked daily after PDT. Width () and length () were measured with slide calibers, and tumor volumes () were calculated using .21 Tumor volumes were tracked for 14 days (Fig. 4), and the tumor regrowth factor () was calculated by the best exponential fit [with a form ] to the measured volumes over the days (). CI was calculated for each treatment group as where is the tumor regrowth factor for each group and is the regrowth factor for the control group, which has no injection of BPD or light illumination.Fig. 4Tumor volumes over days after PDT treatment. Solid lines are the exponential fit to the data with a functional form of , where is days after PDT treatment. The resulting tumor regrowth rates, , and its uncertainty, , are listed in Table 3. 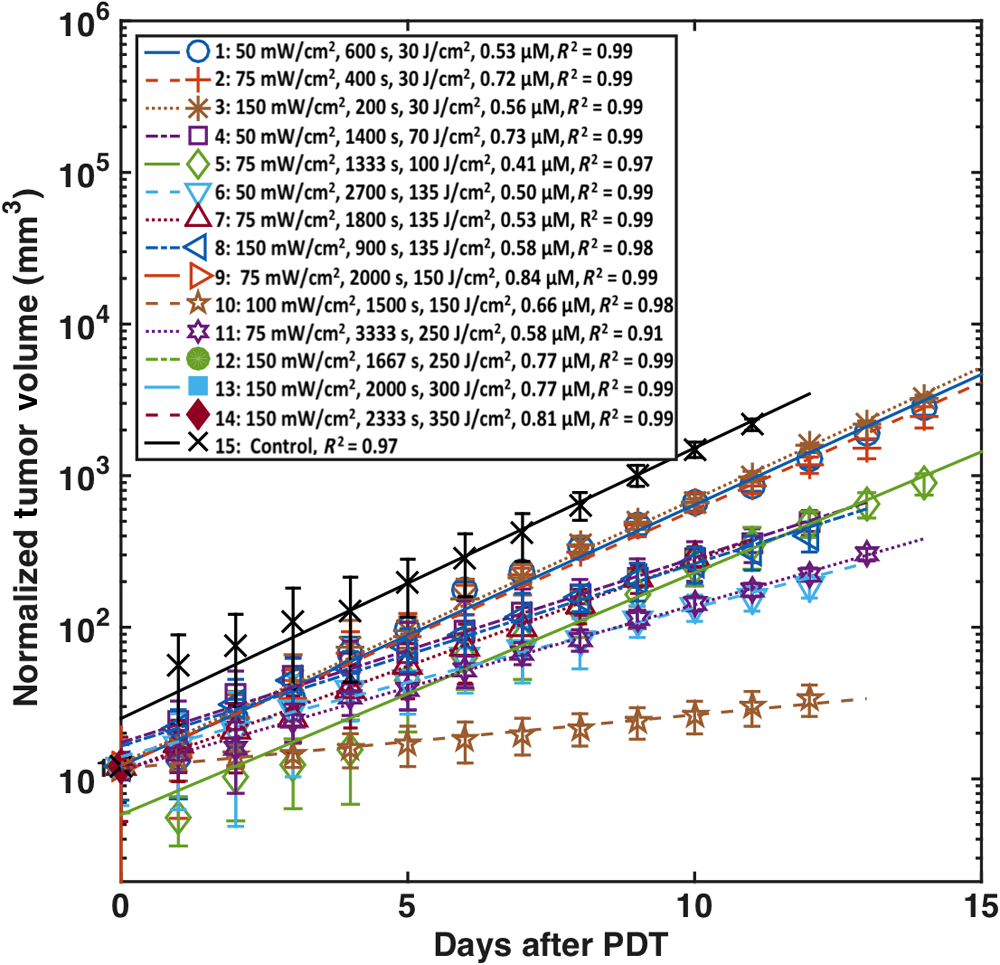 Table 3In-air light fluence, in-air light fluence rate, φair, photosensitizer concentrations pre- and post-PDT, [BPD]pre and [BPD]post, PDT dose at 3 mm depth, reacted singlet oxygen concentration, [O21]rx, at 3 mm depth, tumor regrowth rate, k, and CI, for each PDT treatment group. Number of mice per group is shown in the second column. The same index for each PDT treatment group is used for Figs. 4 and 7.
2.6.Monte-Carlo Simulation of Distribution in TumorsThe diffusion theory is not valid for the simulation of in tissue when the lateral dimension of the beam geometry becomes comparable to the mean-free-path of the photons or when the region of interest is near the air–tissue interface.22 Based on a previous study,23 an empirical six-parameter fitting equation was used to fit the Monte-Carlo (MC) calculated light fluence rate data22 for a 1-cm diameter field, with to and to . The equation is of the following form: where the parameters , , , , , and are functions of and and details of each can be found elsewhere.23 , where the source-to-surface distance based on the measurement of light fluence rate in water for the same collimated beam as a function of depth and fit to the inverse–inverse square law formula. The inverse square law factor was added into the MC simulation results, which is suitable for parallel beams, to account for the divergence of the collimated beam from the microlens. The mean tissue optical properties are found to be and for RIF tumors at 690 nm, and the maximum error for using the mean optical properties is (data not shown).2.7.Macroscopic Singlet Oxygen ModelingThe typical type II PDT process can be described by a set of kinetic equations, which can be simplified to describe the creation of .18,20 These equations are dependent on the temporal and spatial distribution of light fluence, photosensitizer concentration (), ground state oxygen concentration (), and the photosensitizer-specific reaction-rate parameters. The relevant equations are where is the maximum oxygen supply rate to tissue, is the low-concentration correction, is the oxygen quenching threshold concentration, is the specific photobleaching ratio, and is the macroscopic maximum oxygen supply rate. The value of each of these parameters was found by fitting the measured to the calculated values; they are summarized in Table 1. If the parameters are 10% over- or underestimated, calculated will deviate up to 12%. An increased estimates a smaller while an increased or estimates larger .Figure 5 is a flowchart showing how is calculated. The depth dependence of is calculated using an analytical fit of MC simulation, Eq. (3), and published fitting parameters.23 For each spatial location, and can be calculated by solving the coupled differential equations [Eqs. (4) and (5)] using the initial conditions for based on fluorescence measurement before PDT and its assumed spatial homogeneous, the initial value (e.g., from Tables 1), and . The light fluence rate does not change with time. Finally, is calculated using Eq. (6). Fig. 5Flowchart for the calculation of based on initial conditions of and . The initial oxygen concentration is chosen to be for most of the data analysis except for the individual fits for Fig. 3, where . 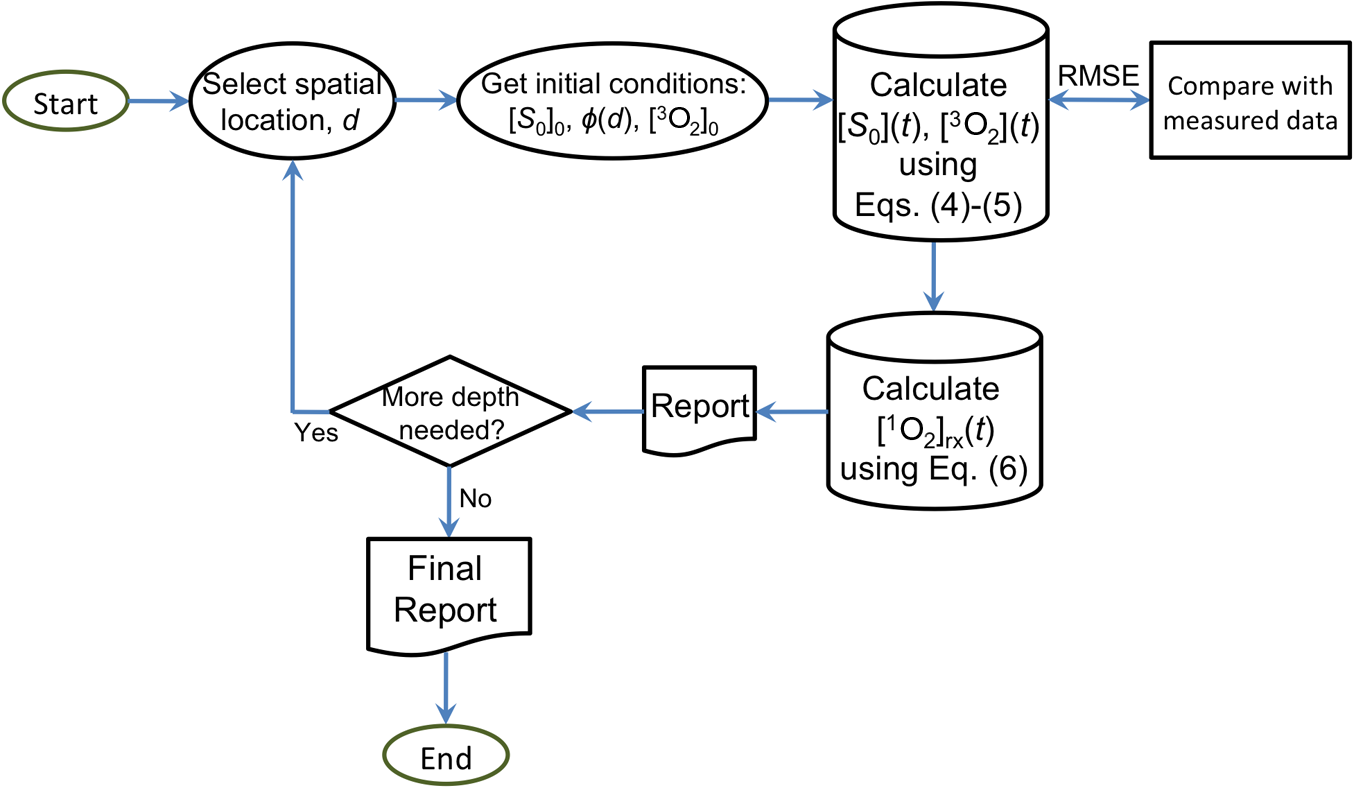 For a subset of four mice, and concentration over time during the course of PDT delivery were measured. was determined by collecting the characteristic fluorescence spectra of BPD due to excitation by the treatment light. To minimize the possible effect of optical properties change at 405 nm on fluorescence , which is not included in Eq. (1), we used ex-vivo measurement of to validate our in-vivo fluorescence method in the same mouse population [Fig. 2(c)]. was measured using the phosophorescence-based oxygen probe mentioned in Sec. 2.3. These quantities over time were fit with Eqs. (4) and (5) to validate the parameters of , , and obtained previously.20 The objective function minimized during the fitting routine was the root-mean-square error (RMSE) between model-calculated and measured (). Minimization of the objective function was performed using the function “fminsearch” in MATLAB®. All fitting and simulation were performed using MATLAB® R2014b (Natick, Massachusetts) on an iMac OSX version 10.10.5 (processor 2.9 GHz Intel Core i5, 16 GB memory). The calculation times were in seconds for the spatially coupled differential equations. A more detailed description of the macroscopic model has been published previously.9,18,20,24 3.ResultsBPD-mediated PDT with different in-air fluences, different , and different exposure times was performed in mouse models bearing RIF tumors. Tissue optical properties, photosensitizer concentration, and tissue oxygenation were measured to calculate photobleaching percentage, PDT dose, and . Table 3 summarizes all of the treatment conditions, as well as the measured and calculated quantities using the photochemical parameters summarized in Table 1. Four mice, summarized in Table 2, were used to monitor the photosensitizer concentration and throughout the treatment using and total fluence of . The measured results (open symbols) were compared to calculated values (solid lines) in Fig. 3 to validate the photochemical parameters used in the calculation of . values are provided to evaluate their fits. Calculations were performed using Eqs. (4)–(6) and the photochemical parameters found from individual fits of summarized in Table 2, as well as the photochemical parameters for the mean data summarized in Table 1 and measured values of initial photosensitizer concentration. Measured tumor volume over 14 days after treatment for each treatment group is shown in Fig. 4. Compared to control mice, all treatment conditions had significant control of the tumor regrowth after PDT. CI was calculated for each treatment group using Eq. (2). PDT using with was a more effective treatment than with . Each tumor volume was normalized to the mean initial volume, so they are equal on day 0 (treatment date) before fitting for the tumor regrowth rate. BPD concentration ([BPD]) was measured both before and after PDT treatment. Measured [BPD] was compared to model-calculated values for all of the treatment conditions and is shown in Fig. 6(a). The symbols represent the measured values, and the solid lines are model-calculated photosensitizer concentration during treatment. Figure 6(b) shows the spatial distribution of reacted singlet oxygen in the RIF tumor model. The symbols indicate at 3 mm tumor depth for each treatment condition. The depth of 3 mm was chosen as it encompasses the initial tumor size of all treated tumors. Previous publications also calculated at 3 mm, and results of this study can be compared to those directly. Fig. 6(a) The temporal changes of BPD concentration versus fluence at 3 mm depth for the treatment conditions. The solid lines represent the calculated changes of photosensitizer concentration during treatment. The symbols show the measured BPD concentration pre- and post-PDT. Initial drug concentrations for the calculation were matched to measured values. (b) The spatial distribution of reactive singlet oxygen () in the RIF tumors calculated for different treatment conditions. at 3 mm tumor depth is shown as symbols. values for each calculation are shown in the legend. 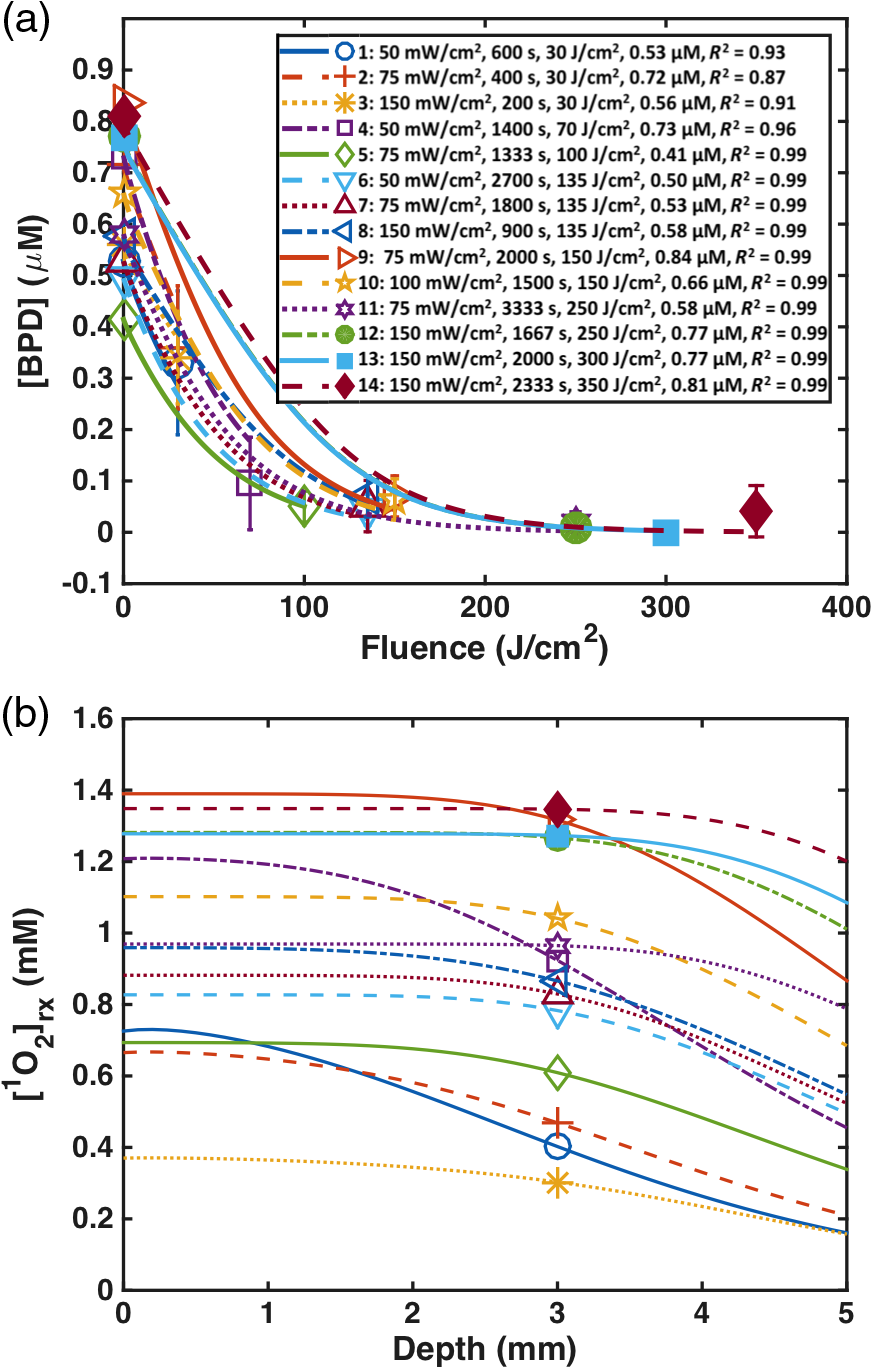 Several dose metrics were evaluated for predicting the treatment outcome. Figure 7 shows the correlation of CI (tumor control) versus in-air fluence, photobleaching ratio (%), PDT dose at 3 mm depth, and at 3 mm depth. The mean of and for all mice in each treatment group (number of mice per group is shown in Table 3) was used to determine CI using Eq. (1). Photobleaching was determined by the ratio of BPD measured immediately following treatment () to the BPD concentration measured prior to treatment () and calculating . PDT dose is defined by the time integral of the product of the at a 3-mm tumor depth and the local BPD concentration. Figures 7(a)–7(d) show the correlation of CI to fluence, photobleaching percentage, PDT dose, and mean along with their line of best-fit. The lines of best-fit (shown with solid lines) are , , , and with , 0.6274, 0.9360, and 0.9850 for fluence, photobleaching percentage, PDT dose, and at 3 mm, respectively. Fig. 7CI plotted against (a) fluence at a 3 mm tumor depth, (b) measured photosensitizer photobleaching (%), (c) calculated PDT dose at 3 mm depth, and (d) mean reacted singlet oxygen at 3 mm depth () calculated using Eqs. (4)–(6) and the parameters summarized in Table 1. The solid lines show the best-fit to the data with functional forms , , , and with , 0.6274, 0.9360, and 0.9850 for (a), (b), (c), and (d), respectively. The gray region indicates the upper and lower bounds of the fit with 95% confidence level. 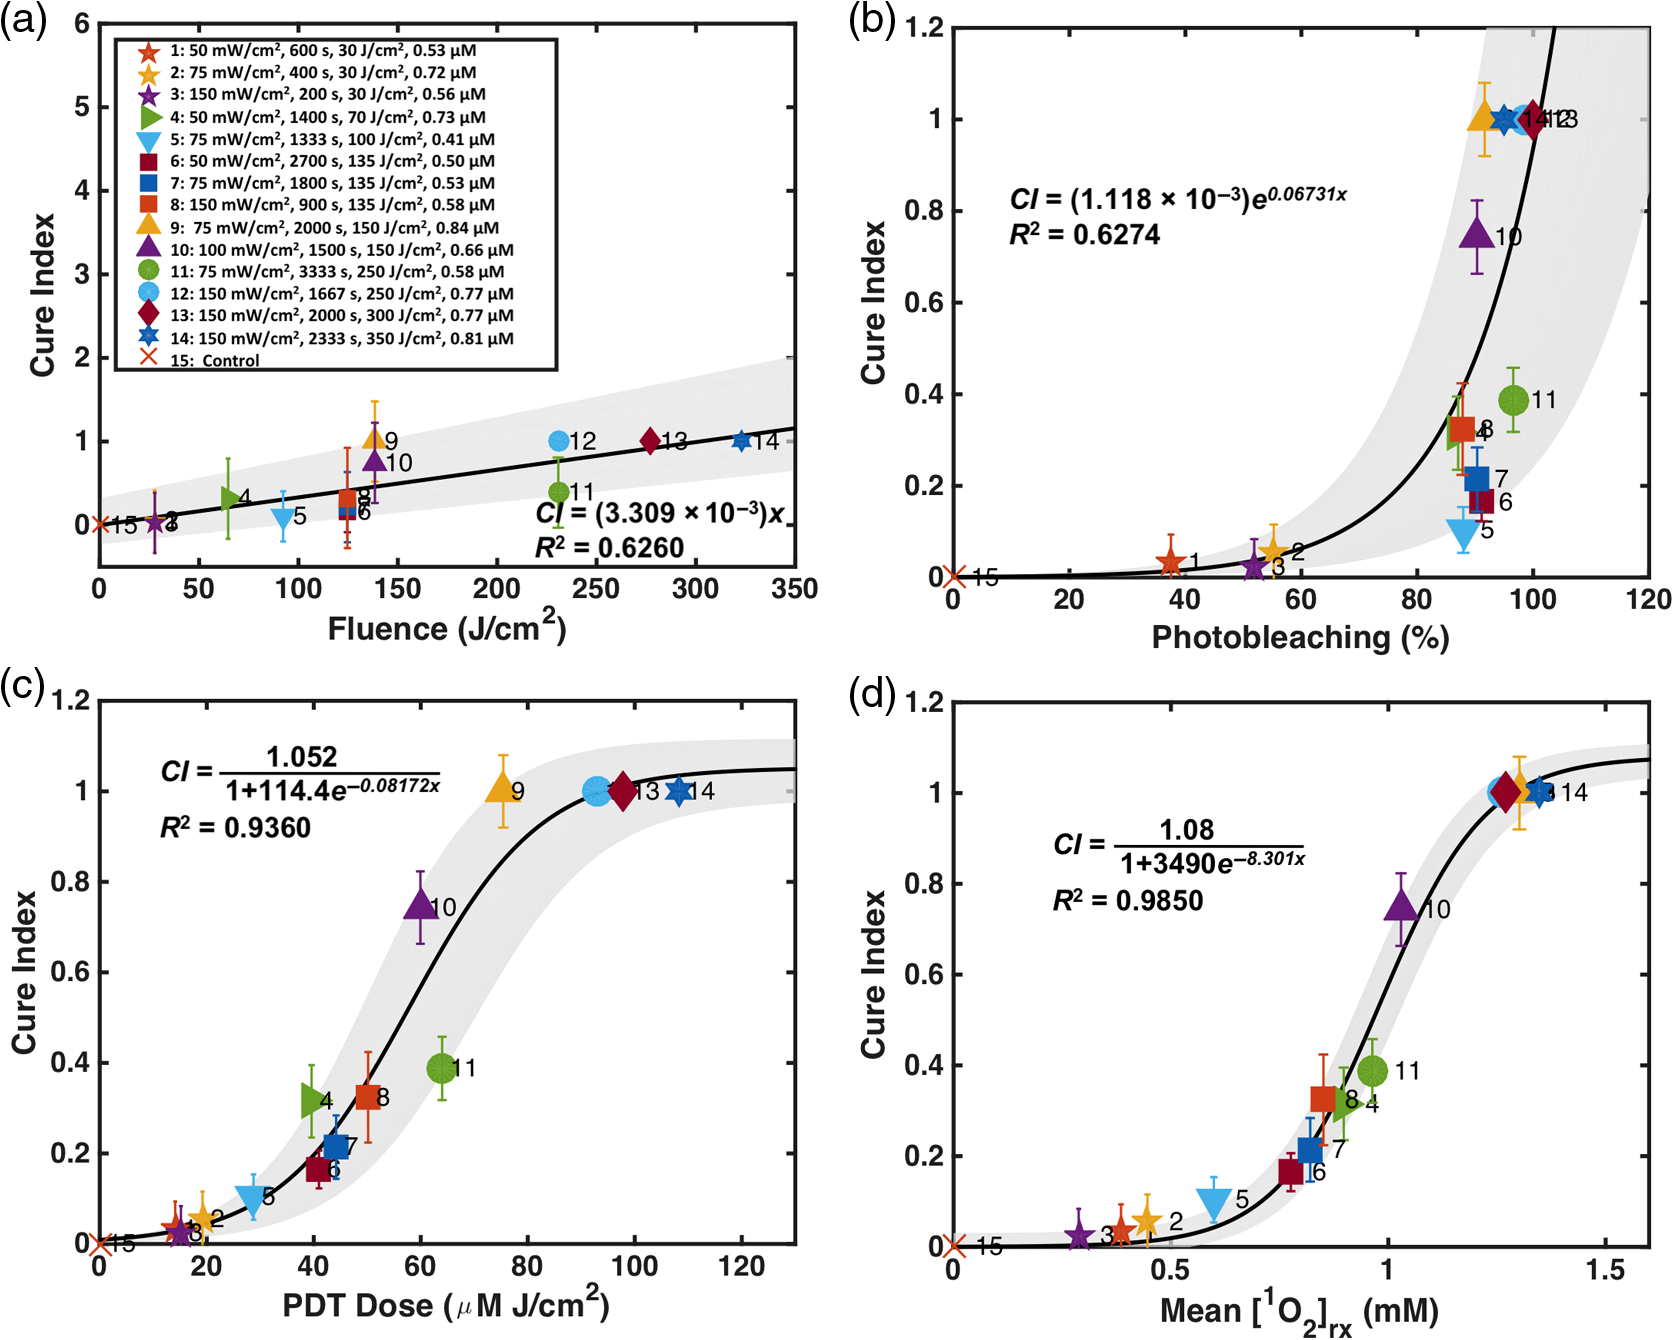 4.DiscussionsAs shown in Fig. 3, the photochemical parameters , , and were validated by measuring [BPD] changes and during the PDT treatment for individual mice and applying the parameters to the explicit dosimetry model. Based on a previous study, the parameters of , , and were found to be , , and , respectively.20 The standard deviation of each parameter is reduced based on the fitting of and as shown in Fig. 3, which is a more robust data set for deriving the photochemical parameters. Each individually measured in Fig. 3 was fitted to validate the photochemical parameters as shown in Table 2. RMSE between measured and calculated values of was used as a measure of good fit. To assess the effect of photochemical parameters, the values of calculated reacted singlet oxygen concentration, , using the individually obtained photochemical parameters for each mouse (from Table 2) were compared to calculated using the photochemical parameters from a previous study,20 from Table 1. For the same mouse, calculated using the two sets of photochemical parameters agree with each other to within a maximum uncertainty of 20% and a standard deviation of 8% (see Table 2). The good agreement between measurement and calculation of photosensitizer concentration and oxygen concentration (Fig. 3) provided a validation of the photochemical parameters determined previously and allowed for reduction in the uncertainty of each parameter. For BPD, the comparisons between the measured and calculation for a subset of four mice (Fig. 3b) show that our macroscopic model can accurately predict for the mice studied with values 0.70 to 0.90. The agreement between measured and calculated makes it unnecessary to measure the oxygen concentration directly during PDT. One complication of the comparison between measurement and calculation for in-vivo oxygen concentration is the uncertainty of the depth at which oxygen concentration was measured, which lies at around 3 mm. To illustrate this effect, the spatial and temporal variations of were shown for various (20, 50, 75, and ): Figs. 8(a)–8(c) show the temporal changes of at 1, 3, and 5 mm with (the mean value of BPD concentration for all mice studied); Figs. 8(d)–8(f) show the temporal changes of at 1, 3, and 5 mm with . Initial of and the photochemical parameters in Table 1 were used for the calculations. As the depth increases from 1 to 5 mm, the minimum value of increases, while the rate of recovery due to photobleaching (for 50 to 2000 s) decreases. Higher initial [BPD] will cause a larger drop of , depending on the light fluence rate. Lower light fluence rates will have less consumption during PDT. The optimized depth for the best agreement between model and measurement is found to be 3 mm, corresponding to the placement of the oxygen probe during PDT. Fig. 8Temporal dependence of calculated for various in-air fluence rates (20, 50, 75, and ) at depths of 1, 3, and 5 mm in the tumor for two initial BPD concentrations, [BPD]: (a)–(c) and(d)–(f) . Photochemical parameters in Table 1 are used for calculation using Eqs. (4) and (5).  Compared to control mice, all treated mice with total fluences larger than had significant control of the tumor regrowth after PDT (see Fig. 4). However, mice with tumors of about the same size, administered the same BPD dose, and treated with identical fluence exhibited different survival and tumor control as was changed. In the group of mice treated to , CI increased as the source strength was lowered from 100 to . This is in agreement with prior reports of increased therapeutic response with a reduced by expanding the radius of formation around a tumor capillary in a multicell tumor spheroid model.25 Figure 6(a) compares the measured pre- and post-PDT BPD concentration, [BPD], versus calculated [BPD] during treatment for each treatment condition using the photochemical parameters summarized in Table 1. The good agreement [for mean , in Fig. 6(a)] between the measured [BPD] pre- and post-PDT further validates the photochemical parameters (Table 1) used for the modeling. Figure 6(b) shows the spatial distribution of for each treatment condition. The value of at 3 mm is shown with symbols. While the comparison of CI versus was done using at 3 mm, the value of is almost a constant for depths between 1 and 4 mm for most of the PDT treatment groups, indicating that the correlation between and CI in Fig. 7(c) should be equally valid for any depth between 1 and 4 mm. Fluence, photosensitizer photobleaching ratio, PDT dose, and at 3 mm were compared as dosimetric quantities to estimate the outcome of BPD-mediated PDT for RIF tumors on a mouse model. The outcome was evaluated by the calculation of CI. No tumor regrowth up to 14 days after treatment resulted in a CI of 1. The goodness of the fit and the corresponding upper and lower bounds of the fits (gray area) to the fluence, BPD photobleaching, PDT dose, and mean are presented in Fig. 7. Figure 7(a) shows that, while fluence correlates linearly with the PDT outcome, it exhibits large uncertainties as defined by the large bounds of the gray area, as well as by the low value of . As evident by the lower value of and a relatively large bound of gray area in Fig. 7(b), the BPD photobleaching ratio is not a better dosimetric quantity for predicting the PDT outcome as compared to fluence. The BPD concentration ( to ) as used clinically is much lower than the value of (), and this may be a reason for the poor correlation of the photobleaching ratio and CI. In photobleaching-based implicit dosimetry, a much more sophisticated model than simple bleaching fraction is used, and the result of this study does not mean that other methodologies of photobleaching-based implicit dosimetry will not be applicable for PDT dosimetry. As shown in Fig. 7(c), PDT dose allows for reduced subject variation and improved predictive efficacy as compared to fluence and photobleaching. PDT dose showed a better correlation with CI with a higher value of and a narrower band of gray area as it accounts for both light dose and tissue [BPD] levels. However, PDT dose overestimates in the presence of hypoxia as it does not account for the oxygen dependence of quantum yield. The goodness of fit and the narrowest gray area in Fig. 7(d) shows that the mean correlates the best with CI. accounts for the key quantities of light fluence, photosensitizer concentration, and tissue oxygen level. Based on the findings of this study, PDT dose and exhibit threshold dose behavior as they can be fitted by a sigmoid function , where with uncertainty and with uncertainty for PDT dose and , respectively. For PDT dose, can be converted to the absorbed dose by BPD by multiplying by the extinction coefficient (), resulting in , which corresponds to (by dividing the energy per photon for ). The PDT dose threshold for BPD is in agreement with those reported for 2-(1-hexyloxyethyl)-2-devinyl pyropheophorbide-a (HPPH) ()16 and our preliminary results for BPD ().26 The mean threshold concentration of is similar to those published for HPPH (1.00 mM)16 and the published preliminary result for BPD (0.82 mM).26 The increases for both PDT dose and threshold dose for BPD are due to an 11% increase of BPD drug concentration after a more comprehensive analysis of the fluorescence CF for mice revealed an 11% error in the original calibration curve for BPD concentration [Fig. 2(b)]. We want to point out that the definition of the value of the threshold doses for both PDT dose and is the value when rather than when (see Fig. 7). Both the current and previously published results26 use the same photochemical parameters (Table 1). 5.ConclusionThe response of mouse RIF tumors to PDT depends on the tissue oxygenation, photosensitizer uptake, total energy delivered, and the at which the treatment is delivered. An accurate dosimetry quantity for the evaluation of the treatment outcome should account for all of these parameters. This study evaluated the efficacy and outcomes of different PDT treatments and how fluence, BPD photobleaching, PDT dose, and compare as dosimetric quantities. The correlation between CI and suggests that at 3 mm is the best quantity to predict the treatment outcome for a clinically relevant tumor regrowth endpoint. PDT dose is the second most effective dosimetry quantity when compared to fluence or photosensitizer photobleaching but is worse than as it does not account for the consumption of for different . For BPD in RIF tumors, our measurements show consistent temporal dependence of in-vivo oxygen concentration during PDT that can be well modeled by our macroscopic model (for mean , ), implying that it is not necessary to make measurements during PDT to obtain , as well as by using our model. This study validated the model and photochemical parameters for BPD-mediated PDT for an endpoint that is clinically relevant. AcknowledgmentsThe authors would like to thank Dr. Jarod C. Finlay, Dayton McMillan, and Dr. Baochang Liu for useful discussions and experimental support and Dr. Theresa Busch for her advice concerning the mouse studies and protocols. We thank Dr. Costas Koumenis and the Department of Radiation Oncology Research Division, University of Pennsylvania for providing the Oxford Oxylite instrument for oxygen measurements. This work was supported by grants from the National Institutes of Health Nos. R01 CA154562 and P01 CA87971. ReferencesT. J. Dougherty,
“Photodynamic therapy,”
Photochem. Photobiol., 58
(6), 895
–900
(1993). http://dx.doi.org/10.1111/php.1993.58.issue-6 PHCBAP 0031-8655 Google Scholar
Z. Huang et al.,
“Photodynamic therapy for treatment of solid tumors—potential and technical challenges,”
Technol. Cancer Res. Treat., 7
(4), 309
–320
(2008). http://dx.doi.org/10.1177/153303460800700405 Google Scholar
A. Juarranz et al.,
“Photodynamic therapy of cancer. Basic principles and applications,”
Clin. Transl. Oncol., 10
(3), 148
–154
(2008). http://dx.doi.org/10.1007/s12094-008-0172-2 Google Scholar
R. Penjweini et al.,
“Modifying excitation light dose of novel photosensitizer PVP-hypericin for photodynamic diagnosis and therapy,”
J. Photochem. Photobiol. B, 120 120
–129
(2013). http://dx.doi.org/10.1016/j.jphotobiol.2012.12.013 JPPBEG 1011-1344 Google Scholar
K. R. Weishaupt, C. J. Gomer and T. J. Dougherty,
“Identification of singlet oxygen as the cytotoxic agent in photo-activation of a murine tumor,”
Cancer Res., 36 2326
–2392
(1976). Google Scholar
D. Dolmans, E. D. Fukumura and R. K. Jain,
“Photodynamic therapy for cancer,”
Nat. Rev. Cancer, 3
(5), 380
–387
(2003). http://dx.doi.org/10.1038/nrc1071 NRCAC4 1474-175X Google Scholar
R. Penjweini et al.,
“Transport and accumulation of PVP-hypericin in cancer and normal cells characterized by image correlation spectroscopy techniques,”
Biochim. Biophys. Acta., 1843
(5), 855
–865
(2014). http://dx.doi.org/10.1016/j.bbamcr.2014.01.016 Google Scholar
“Photodynamic therapy of subfoveal choroidal neovascularization in age-related macular degeneration with verteporfin: one-year results of 2 randomized clinical trials—tap report 1,”
Arch. Ophthalmol., 117
(10), 1329
–1345
(1999). http://dx.doi.org/10.1001/archopht.117.10.1329 AROPAW 0003-9950 Google Scholar
K. K. Wang et al.,
“Explicit dosimetry for photodynamic therapy: macroscopic singlet oxygen modeling,”
J. Biophoton., 3
(5–6), 304
–318
(2010). http://dx.doi.org/10.1002/jbio.v3:5/6 Google Scholar
T. C. Zhu et al.,
“In-vivo singlet oxygen threshold doses for PDT,”
Photon. Lasers Med., 4
(1), 59
–71
(2015). http://dx.doi.org/10.1515/plm-2014-0037 Google Scholar
B. Liu et al.,
“Comparison of PDT parameters for RIF and H460 tumor models during HPPH-mediated PDT,”
Proc. SPIE, 8931 89311C
(2014). http://dx.doi.org/10.1117/12.2040241 PSISDG 0277-786X Google Scholar
T. C. Zhu et al.,
“Comparison of singlet oxygen threshold dose for PDT,”
Proc. SPIE, 8931 89310I
(2014). http://dx.doi.org/10.1117/12.2039719 PSISDG 0277-786X Google Scholar
H. Qiu et al.,
“Macroscopic singlet oxygen modeling for dosimetry of photofrin-mediated photodynamic therapy: an in vivo study,”
J. Biomed. Opt., 21
(8), 088002
(2016). http://dx.doi.org/10.1117/1.JBO.21.8.088002 JBOPFO 1083-3668 Google Scholar
S. M. Gallagher-Colombo et al.,
“Measuring the physiologic properties of oral lesions receiving fractionated photodynamic therapy,”
Photochem. Photobiol., 91
(5), 1210
–1218
(2015). http://dx.doi.org/10.1111/php.2015.91.issue-5 PHCBAP 0031-8655 Google Scholar
J. C. Finlay et al.,
“Porphyrin bleaching and PDT-induced spectral changes are irradiance dependent in ALA-sensitized normal rat skin in vivo,”
Photochem. Photobiol., 73
(1), 54
–63
(2001). http://dx.doi.org/10.1562/0031-8655(2001)073<0054:PBAPIS>2.0.CO;2 PHCBAP 0031-8655 Google Scholar
R. Penjweini et al.,
“Evaluation of the 2-(1-hexyloxyethyl)-2-devinyl pyropheophorbide (HPPH) mediated photodynamic therapy by macroscopic singlet oxygen modeling,”
J. Biophotonics, 9 1
–11
(2016). http://dx.doi.org/10.1002/jbio.201600121 Google Scholar
J. C. Finlay et al.,
“Interstitial fluorescence spectroscopy in the human prostate during motexafin lutetium-mediated photodynamic therapy,”
Photochem. Photobiol., 82 1270
–1278
(2006). http://dx.doi.org/10.1562/2005-10-04-RA-711 PHCBAP 0031-8655 Google Scholar
R. Penjweini et al.,
“Explicit dosimetry for 2-(1-hexyloxyethyl)-2-devinyl pyropheophorbide-a (HPPH) mediated photodynamic therapy: macroscopic singlet oxygen modeling,”
J. Biomed. Opt., 20
(12), 128003
(2015). http://dx.doi.org/10.1117/1.JBO.20.12.128003 JBOPFO 1083-3668 Google Scholar
T. C. Zhu, B. Liu and R. Penjweini,
“Study of tissue oxygen supply rate in a macroscopic photodynamic therapy singlet oxygen model,”
J. Biomed. Opt., 20
(3), 038001
(2015). http://dx.doi.org/10.1117/1.JBO.20.3.038001 JBOPFO 1083-3668 Google Scholar
M. M. Kim et al.,
“Explicit macroscopic singlet oxygen modeling for benzoporphyrin derivative monoacid ring A (BPD)-mediated photodynamic therapy,”
J. Photochem. Photobiol. B., 164 314
–322
(2016). http://dx.doi.org/10.1016/j.jphotobiol.2016.09.031 JPPBEG 1011-1344 Google Scholar
T. M. Busch et al.,
“Fluence rate-dependent intratumor heterogeneity in physiologic and cytotoxic responses to photofrin photodynamic therapy,”
Photochem. Photobiol. Sci., 8
(12), 1683
–1693
(2009). http://dx.doi.org/10.1039/b9pp00004f PPSHCB 1474-905X Google Scholar
T. C. Zhu, A. Lu and Y.-H. Ong,
“An improved analytic function for predicting light fluence rate in circular fields on a semi-infinite geometry,”
Proc. SPIE, 9706 97061D
(2016). http://dx.doi.org/10.1117/12.2213052 PSISDG 0277-786X Google Scholar
Y. H. Ong and T. C. Zhu,
“An analytic function for predicting light fluence rate of circular fields on a semi-infinite turbid medium,”
Opt. Express, 24
(23), 26261
–26281
(2016). http://dx.doi.org/10.1364/OE.24.026261 OPEXFF 1094-4087 Google Scholar
T. C. Zhu et al.,
“Macroscopic modeling of the singlet oxygen production during PDT,”
Proc. SPIE, 6427 1
–12
(2007). http://dx.doi.org/10.1117/12.701387 PSISDG 0277-786X Google Scholar
T. H. Foster et al.,
“Fluence rate effects in photodynamic therapy of multicell tumor spheroids,”
Cancer Res., 53 1249
–1254
(1993). CNREA8 0008-5472 Google Scholar
M. M. Kim et al.,
“On the in vivo photochemical rate parameters for PDT reactive oxygen species modeling,”
Phys. Med. Biol., 62
(5), R1
–R48
(2017). PHMBA7 0031-9155 Google Scholar
BiographyMichele M. Kim received her BA and MS degrees in physics from the University of Pennsylvania in 2012 and is currently a PhD candidate at the University of Pennsylvania in physics while pursuing a certificate in medical physics. Her research interests include preclinical and clinical photodynamic therapy dosimetry. Rozhin Penjweini received her PhD in 2012 in physics from the University of Vienna. She is currently a postdoctoral researcher in the Department of Radiation Oncology at the University of Pennsylvania. Her current research interest is in vivo explicit photodynamic therapy (PDT) and singlet oxygen dosimetry. She also has practical experience in various fluorescence microscopy techniques for studying the structure, transport, and stability of nanomedicines for PDT treatment of cancer. Timothy C. Zhu received his PhD in 1991 in physics from Brown University. He is currently a professor in the department of radiation oncology at the University of Pennsylvania. His current research interests include explicit PDT dosimetry, singlet oxygen explicit dosimetry (SOED), integrated system for interstitial and intracavitory PDT, diffuse optical tomography, in vivo dosimetry, and external beam radiation transport. |