

|
|
|
Noncontact applanation tonometry (NAT) is one of the most common screening tools for ocular diseases, most notably glaucoma, by measuring intraocular pressure (IOP).1 In addition to IOP measurements, applanation studies have been performed in hope to quantify corneal biomechanical properties for detecting degenerative diseases such as keratoconus.2 However, the large displacements induced by the air-puff prohibit local assessment of corneal biomechanical properties3 and cause nonlinear biomechanical behaviors.4 Moreover, biomechanical measurements of the cornea are confounded by other parameters, such as IOP5,6 and central corneal thickness (CCT).5,7 Thus, providing an accurate measurement of corneal mechanical parameters (e.g., Young’s modulus) is not straightforward, let alone based on applanation measurements. Nevertheless, commercially available noncontact tonometers (e.g., the ocular response analyzer and CorVis ST) can distinguish between healthy and keratoconic corneas,8 but there have been conflicting results on their ability to detect corneal biomechanical changes due to therapeutic interventions such as corneal collagen crosslinking.8,9 Therefore, it may not be entirely possible to separate the effects of corneal geometry, IOP, and corneal biomechanical properties from their respective individual measurements for corrections. Rather, a device that can accurately measure these parameters would overcome this limitation. Optical coherence tomography (OCT) is a versatile and noninvasive imaging technique that provides depth-resolved images with micrometer-scale resolution.10 The biomechanical properties of tissues can be measured using the elastographic functional extension of OCT, termed optical coherence elastography (OCE).11,12,13 While the OCT structural image has a resolution on the scale of micrometers, phase-sensitive OCT has the capability for subnanometer displacement sensitivity,14 which is crucial for ultrasensitive elastographic measurements.15 Ultrasound elastography and magnetic resonance elastography are clinically available elastographic techniques, but are not well-suited for small and thin tissues (e.g., the cornea and sclera) due to their relatively lower spatial resolution, poorer displacement sensitivities, and need for contact-based excitation or coupling medium. To overcome the aforementioned limitations, we developed an ultrafast OCT system for NAT and for measuring corneal biomechanical properties based on our previously published OCE technique.16 In this letter, we present noncontact measurement of eye-globe IOP and corneal biomechanical properties in the native corneal state with a single imaging system, which we have termed an applanation optical coherence elastography (Appl-OCE) system. The measurements were performed on fresh porcine eyes (Sioux-Preme Packing Company, Sioux City, Iowa; ). Extraneous tissues such as muscles were removed from the eye-globes, and all measurements were taken within 24 h of enucleation. The whole eye-globes were placed in a home-built holder for artificial IOP control.17 During testing, the eye-globes were cannulated with two 23G needles for artificial IOP control system. One needle was connected via tubing to a pressure transducer, and the other needle was connected via tubing to a microinfusion pump. A schematic of the Appl-OCE system is provided in Fig. 1. Briefly, the system consisted of a buffered Fourier domain model locked (FDML) swept source laser with a central frequency of 1316 nm, scan range of 100 nm, axial resolution of , sweep rate of , and phase stability of . The system utilized a resonant scanner at , as previously described.16 The system utilized a rotary solenoid and plunger to provide the large force air-puff during the applanation measurements and focused micro air-pulse excitation system18 for the elastographic measurements. Fig. 1.Schematic of the combined OCT-based applanation tonometer and phase-sensitive OCE system while measuring the IOP and corneal biomechanical properties of in situ porcine corneas in the whole eye-globe configuration. The IOP control system is included. ADC, analog-to-digital converter and DAC, digital-to-analog converter.  During applanation, a large force air-puff was directed at the central region of the cornea, which was recorded by the OCT system with a frame rate of , as shown in Fig. 2(a) and Video 1 ( slower than real-time). The IOP measurement technique is very similar to the methods used in other NAT applications.19,20 During the inward and outward deformations, there are two times when the cornea is applanated [shown in Fig 2(a) at 1.4 and 15.3 ms after excitation, respectively]. To calculate the IOP, we assumed the force on the anterior (i.e., the air-puff) and posterior (i.e., IOP) surfaces of the cornea were equal at the times when the cornea was applanated. These times were then correlated to the pressure profile of the air-puff that was measured by a pressure transducer. Four applanation measurements were taken for each porcine sample at each IOP setting. To corroborate our results, IOP measurements were also made with a rebound tonometer (TonoVet, iCareUSA, North Carolina) immediately after the respective applanation measurements by the Appl-OCE system. Five measurements were made for each sample at each IOP by the rebound tonometer. Fig. 2.(a) Selected frames from Video 1 showing OCT imaging of the noncontact applanation, which was imaged at a frame rate of . The inward and outward applanation times are shown at 1.4 and 15.3 ms, respectively. (b) Selected frames from Video 2 showing the propagation of the focused micro air-pulse induced elastic wave in the cornea. Both data sets are at an IOP controller setting of 10 mmHg, and the times after excitation are labeled for each respective frame (Video 1, MP4, 6.5 MB [URL: http://dx.doi.org/10.1117/1.JBO.22.2.020502.1] and Video 2 MP4, 4 MB [URL: http://dx.doi.org/10.1117/1.JBO.22.2.020502.2]). 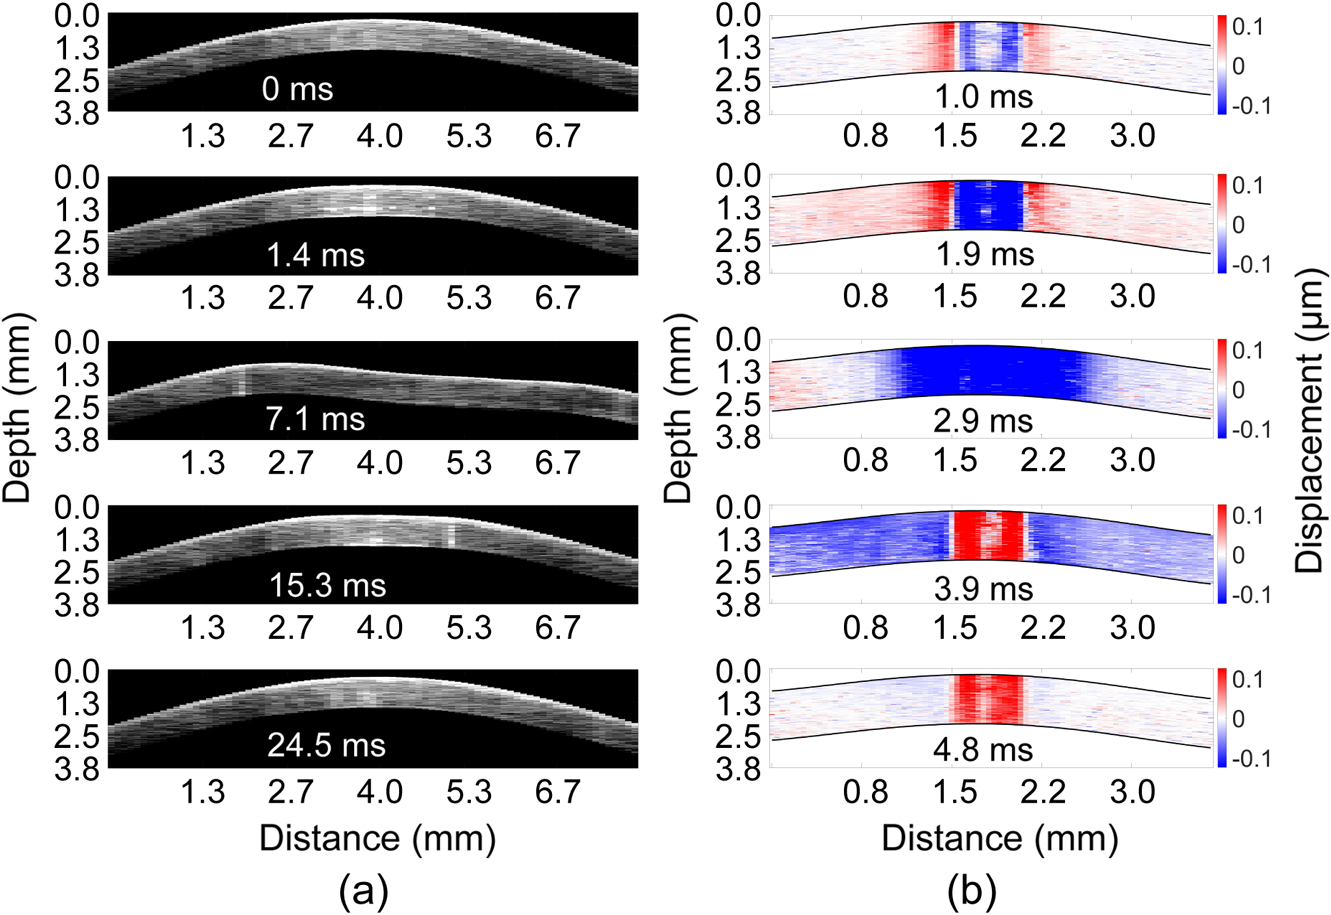 After the applanation measurements, a focused micro air-pulse induced an elastic wave in the cornea, which was also detected by the same phase-sensitive OCT system as previously described.16 Briefly, the air-pulse induced a transversely propagating elastic wave, which was imaged by repeated B-scans. The B-scan size was a multiple of four to ensure that each repeated A-scan was from the same buffered sweep since the FDML laser utilized buffering.21 The phase data was corrected to remove surface motion and refractive index mismatch artifacts, with the refractive index of the cornea as 1.376.22,23 Selected temporal frames from Video 2 ( slower than real-time) of the air-pulse induced elastic wave propagating across a porcine cornea at 10 mmHg IOP are shown in Fig. 2(b). The red regions near the apex are due to phase unwrapping errors, and these positions were not used for elasticity quantification. The elastic wave velocity was calculated by cross-correlation analysis and linear fitting of the temporal displacement profiles at different spatial positions in the linear scan region.16 Similar to the applanation measurements, four line measurements over the same apical region were taken for each sample for each IOP setting. The OCE measurements were taken along the nasal/temporal axis of each cornea to limit the effects of corneal mechanical anisotropy on the OCE measurements.24 The Young’s modulus was estimated from the group velocity using the surface wave equation. 16,25 Figure 3 plots the IOP as measured by Appl-OCE (horizontal stripe) and rebound tonometry (vertical stripe) along with the stiffness of the cornea (blue) estimated by OCE. The IOP set by the IOP control system (open black) is also plotted for easy comparison. The data are presented as the of all measurements from all three samples for a given controlled IOP. Statistical testing by Student’s t-test was performed to determine if the measured and controlled IOPs were similar. The results showed that the IOP measured by OCT applanation was not significantly different from the IOP set by the controller, albeit only marginally (). However, the IOP, as measured by the rebound tonometer, was significantly different from the IOP as set by the IOP controller (). The intersample of the IOP measurements by both techniques, corneal stiffness, and CCT are presented in Table 1. CCT was calculated from the OCT structural image assuming that the cornea had a constant refractive index of 1.376.23 Fig. 3.Comparison of IOP as measured by Appl-OCE and rebound tonometry. The Young’s modulus obtained by OCE is plotted alongside in blue. The data are presented as the intersample of all measurements from three porcine samples for a given IOP setting.  Table 1.The intersample mean±standard deviation for IOP as measured by a rebound tonometer and OCT applanation, corneal stiffness as measured by OCE, and CCT as measured by the OCT structural image.
In this work, we have presented a technique for quantifying IOP and performing quantitative elastographic evaluation of the cornea with a single OCT instrument. A large force air-puff applanated the cornea and OCT images were taken at a frame rate of . Afterward, a focused micro air-pulse induced a transversely propagating elastic wave, which was also imaged by the same OCT system. Our results showed good correlation with the IOP as set by the artificial IOP control system, showing the feasibility of the described Appl-OCE technique to measure the IOP of the eye-globe and to estimate quantitatively corneal biomechanical properties. IOP measurements performed by air-puff applanation tend to overestimate IOP,26 but in our work, the OCT applanation mildly underestimated IOP, except at 20 mmHg where the IOP was overestimated by . The rebound tonometer underestimates IOP,27 which was corroborated in our results. Goldmann applanation tonometry (GAT) is generally regarded as the “gold standard” of noninvasive IOP measurements. However, GAT is also affected by corneal geometry because it assumes that the cornea is an infinitely thin, dry, spherical shell with no other interactions. In contrast, extraneous factors, such as corneal and scleral viscoelasticity, tear film, corneal geometry, and probe interactions, all affect GAT measurements, and thus, correcting factors are usually used to overcome these limitations. Here we only present raw uncorrected data. A study with a much larger cohort is the next step of our work to determine the interplay between IOP, corneal biomechanical properties, and corneal geometry as measured by Appl-OCE. Nevertheless, we have shown that the proposed Appl-OCE instrument has the capability to measure corneal geometry, corneal stiffness, and IOP since it may not be possible to separate or correct for all of these factors from a single given measurement. Extensive work has been performed to develop techniques to obtain corneal biomechanical properties from applanation measurements.2 However, assumptions of corneal linear mechanical responses are not applicable here as the corneal deformation is large (mm-scale), and the corneal stress–strain curve is distinctly nonlinear.28 There are some limitations in our work as well. The surface wave equation does not take into account the corneal viscoelastic nonlinearity,25,28 corneal curvature and thickness,29 aqueous humor,30 dispersion of the elastic wave,31,32 or corneal mechanical anisotropy.24,33 Additionally, the limited spatial and temporal data points resulted in the large variance in measured corneal biomechanical properties at 20 mmHg (stiff conditions), and the limited bandwidth of the air-pulse induced waves (below 1 kHz) combined with limited number of data points prevented dispersion analysis of the elastic wave. There are still several steps for improvement, which are the focus of our future work. For example, utilizing the both scans of the resonant scanner,21 dispersion analysis31,32,34 with a more rigorous mechanical wave model31 will enable more accurate elasticity measurements. Acoustic techniques can also provide noncontact measurement of corneal biomechanical parameters,33 but the presence of the coupling medium can be uncomfortable for in vivo corneal applications. In this case, air-coupled acoustic radiation force excitation with ultrafast OCE shows great promise for providing truly noncontact quantification of corneal viscoelasticity.32 Nevertheless, our OCE technique has the ability to measure the biomechanical properties of the cornea in its natural resting state in the eye-globe with small displacements that minimize the effects of the corneal nonlinear biomechanical properties. Noncontact OCE has also shown the ability to measure the depthwise microscale biomechanical properties of the cornea34 as well as changes in these properties from different cross-linking techniques.35 Evaluating the ability of the Appl-OCE system to also measure these parameters is the next step of our work. In summary, we have demonstrated proof of principle of a single OCT device (Appl-OCE) capable of measuring the geometry of the cornea, the IOP of the eye-globe with noncontact air-puff applanation, and corneal biomechanical properties by analyzing a micro air-pulse induced elastic wave. Our results show promise for this completely noncontact technique to provide an instrument than can effectively measure and quantify the corneal geometry, eye-globe IOP, and corneal biomechanical properties rather than developing models to separate such effects from a subset of measurements. AcknowledgmentsThis work was supported, in part, by the U.S. National Institutes of Health (NIH) Grant Nos. 2R01EY022362, 1R01HL120140, and U54HG006348 and U.S. Department of Defense (DOD) Congressionally Directed Medical Research Programs (CDMRP) Grant No. PR150338. ReferencesP. R. Healey, Glaucoma, 11
–19 Elsevier Saunders, London
(2015). Google Scholar
S. Kling et al.,
“Corneal viscoelastic properties from finite-element analysis of in vivo air-puff deformation,”
PLoS One, 9
(8), e104904
(2014). http://dx.doi.org/10.1371/journal.pone.0104904 POLNCL 1932-6203 Google Scholar
C. Dorronsoro et al.,
“Dynamic OCT measurement of corneal deformation by an air puff in normal and cross-linked corneas,”
Biomed. Opt. Express, 3
(3), 473
–487
(2012). http://dx.doi.org/10.1364/BOE.3.000473 BOEICL 2156-7085 Google Scholar
A. Sinha Roy et al.,
“Air-puff associated quantification of non-linear biomechanical properties of the human cornea in vivo,”
J. Mech. Behav. Biomed. Mater., 48 173
–182
(2015). http://dx.doi.org/10.1016/j.jmbbm.2015.04.010 Google Scholar
F. Bao et al.,
“Evaluation of the relationship of corneal biomechanical metrics with physical intraocular pressure and central corneal thickness in ex vivo rabbit eye globes,”
Exp. Eye. Res., 137 11
–17
(2015). http://dx.doi.org/10.1016/j.exer.2015.05.018 EXERA6 0014-4835 Google Scholar
J. Li et al.,
“Differentiating untreated and cross-linked porcine corneas of the same measured stiffness with optical coherence elastography,”
J. Biomed. Opt., 19
(11), 110502
(2014). http://dx.doi.org/10.1117/1.JBO.19.11.110502 JBOPFO 1083-3668 Google Scholar
R. Asaoka et al.,
“The relationship between corvis ST tonometry measured corneal parameters and intraocular pressure, corneal thickness and corneal curvature,”
PLoS One, 10
(10), e0140385
(2015). http://dx.doi.org/10.1371/journal.pone.0140385 POLNCL 1932-6203 Google Scholar
S. Bak-Nielsen et al.,
“Dynamic Scheimpflug-based assessment of keratoconus and the effects of corneal cross-linking,”
J. Refract. Surg., 30
(6), 408
–414
(2014). http://dx.doi.org/10.3928/1081597X-20140513-02 JRSUEY 0883-0444 Google Scholar
M. Gkika et al.,
“Evaluation of corneal hysteresis and corneal resistance factor after corneal cross-linking for keratoconus,”
Graefes. Arch. Clin. Exp. Ophthalmol., 250
(4), 565
–573
(2012). http://dx.doi.org/10.1007/s00417-011-1897-0 Google Scholar
D. Huang et al.,
“Optical coherence tomography,”
Science, 254
(5035), 1178
–1181
(1991). http://dx.doi.org/10.1126/science.1957169 SCIEAS 0036-8075 Google Scholar
J. Schmitt,
“OCT elastography: imaging microscopic deformation and strain of tissue,”
Opt. Express, 3
(6), 199
–211
(1998). http://dx.doi.org/10.1364/OE.3.000199 OPEXFF 1094-4087 Google Scholar
S. Wang and K. V. Larin,
“Optical coherence elastography for tissue characterization: a review,”
J. Biophotonics, 8
(4), 279
–302
(2015). http://dx.doi.org/10.1002/jbio.v8.4 Google Scholar
K. V. Larin and D. D. Sampson,
“Optical coherence elastography-OCT at work in tissue biomechanics [Invited],”
Biomed. Opt. Express, 8
(2), 1172
–1202
(2017). https://doi.org/10.1364/BOE.8.001172 Google Scholar
M. Sticker et al.,
“Quantitative differential phase measurement and imaging in transparent and turbid media by optical coherence tomography,”
Opt. Lett., 26
(8), 518
–520
(2001). http://dx.doi.org/10.1364/OL.26.000518 OPLEDP 0146-9592 Google Scholar
R. K. K. Wang et al.,
“Tissue Doppler optical coherence elastography for real time strain rate and strain mapping of soft tissue,”
Appl. Phys. Lett., 89
(14), 144103
(2006). http://dx.doi.org/10.1063/1.2357854 APPLAB 0003-6951 Google Scholar
M. Singh et al.,
“Phase-sensitive optical coherence elastography at 1.5 million A-Lines per second,”
Opt. Lett., 40
(11), 2588
–2591
(2015). http://dx.doi.org/10.1364/OL.40.002588 OPLEDP 0146-9592 Google Scholar
M. D. Twa et al.,
“Spatial characterization of corneal biomechanical properties with optical coherence elastography after UV cross-linking,”
Biomed. Opt. Express, 5
(5), 1419
–1427
(2014). http://dx.doi.org/10.1364/BOE.5.001419 BOEICL 2156-7085 Google Scholar
S. Wang et al.,
“A focused air-pulse system for optical-coherence-tomography-based measurements of tissue elasticity,”
Laser Phys. Lett., 10
(7), 075605
(2013). http://dx.doi.org/10.1088/1612-2011/10/7/075605 1612-2011 Google Scholar
D. A. Luce,
“Determining in vivo biomechanical properties of the cornea with an ocular response analyzer,”
J. Cataract Refract. Surg., 31
(1), 156
–162
(2005). http://dx.doi.org/10.1016/j.jcrs.2004.10.044 Google Scholar
R. Ambrosio et al.,
“Dynamic ultra high speed Scheimpflug imaging for assessing corneal biomechanical properties,”
Rev. Bras. Oftalmol., 72
(2), 99
–102
(2013). http://dx.doi.org/10.1590/S0034-72802013000200005 RBOFA9 0034-7280 Google Scholar
S. Song et al.,
“Strategies to improve phase-stability of ultrafast swept source optical coherence tomography for single shot imaging of transient mechanical waves at 16 kHz frame rate,”
Appl. Phys. Lett., 108
(19), 191104
(2016). http://dx.doi.org/10.1063/1.4949469 APPLAB 0003-6951 Google Scholar
S. Song, Z. Huang and R. K. Wang,
“Tracking mechanical wave propagation within tissue using phase-sensitive optical coherence tomography: motion artifact and its compensation,”
J. Biomed. Opt., 18
(12), 121505
(2013). http://dx.doi.org/10.1117/1.JBO.18.12.121505 JBOPFO 1083-3668 Google Scholar
R. B. Mandell,
“Corneal power correction factor for photorefractive keratectomy,”
J. Refract. Corneal Surg., 10
(2), 125
–128
(1994). JRCSEG Google Scholar
M. Singh et al.,
“Assessing the effects of riboflavin/UV-A crosslinking on porcine corneal mechanical anisotropy with optical coherence elastography,”
Biomed. Opt. Express, 8
(1), 349
–366
(2017). http://dx.doi.org/10.1364/BOE.8.000349 BOEICL 2156-7085 Google Scholar
J. F. Doyle, Wave Propagation in Structures: Spectral Analysis Using Fast Discrete Fourier Transforms, Springer, New York
(1997). Google Scholar
A. Smedowski et al.,
“Comparison of three intraocular pressure measurement methods including biomechanical properties of the cornea,”
Invest. Ophthalmol. Vis. Sci., 55
(2), 666
–673
(2014). http://dx.doi.org/10.1167/iovs.13-13172 IOVSDA 0146-0404 Google Scholar
F. Q. Pereira et al.,
“Comparison of a rebound and an applanation tonometer for measuring intraocular pressure in normal rabbits,”
Vet. Ophthalmol., 14
(5), 321
–326
(2011). http://dx.doi.org/10.1111/j.1463-5224.2011.00879.x VCOPEQ Google Scholar
A. Elsheikh and K. Anderson,
“Comparative study of corneal strip extensometry and inflation tests,”
J. R. Soc. Interface, 2
(3), 177
–185
(2005). http://dx.doi.org/10.1098/rsif.2005.0034 1742-5689 Google Scholar
Z. Han et al.,
“Analysis of the effects of curvature and thickness on elastic wave velocity in cornea-like structures by finite element modeling and optical coherence elastography,”
Appl. Phys. Lett., 106
(23), 233702
(2015). http://dx.doi.org/10.1063/1.4922728 APPLAB 0003-6951 Google Scholar
Z. L. Han et al.,
“Analysis of the effect of the fluid-structure interface on elastic wave velocity in cornea-like structures by OCE and FEM,”
Laser Phys. Lett., 13
(3), 035602
(2016). http://dx.doi.org/10.1088/1612-2011/13/3/035602 1612-2011 Google Scholar
Z. Han et al.,
“Optical coherence elastography assessment of corneal viscoelasticity with a modified Rayleigh-Lamb wave model,”
J. Mech. Behav. Biomed. Mater., 66 87
–94
(2016). http://dx.doi.org/10.1016/j.jmbbm.2016.11.004 Google Scholar
Ł. Ambroziński et al.,
“Acoustic micro-tapping for non-contact 4D imaging of tissue elasticity,”
Sci. Rep., 6 38967
(2016). http://dx.doi.org/10.1038/srep38967 SRCEC3 2045-2322 Google Scholar
T. M. Nguyen et al.,
“In vivo evidence of porcine cornea anisotropy using supersonic shear wave imaging,”
Invest. Ophthalmol. Vis. Sci., 55
(11), 7545
–7552
(2014). http://dx.doi.org/10.1167/iovs.14-15127 IOVSDA 0146-0404 Google Scholar
S. Wang and K. V. Larin,
“Noncontact depth-resolved micro-scale optical coherence elastography of the cornea,”
Biomed. Opt. Express, 5
(11), 3807
–3821
(2014). http://dx.doi.org/10.1364/BOE.5.003807 BOEICL 2156-7085 Google Scholar
M. Singh et al.,
“Evaluating the effects of Riboflavin/UV-A and rose-bengal/green light cross-linking of the rabbit cornea by noncontact optical coherence elastography,”
Invest. Ophthalmol. Vis. Sci., 57
(9), OCT112
–120
(2016). http://dx.doi.org/10.1167/iovs.15-18888 IOVSDA 0146-0404 Google Scholar
|


