|
|
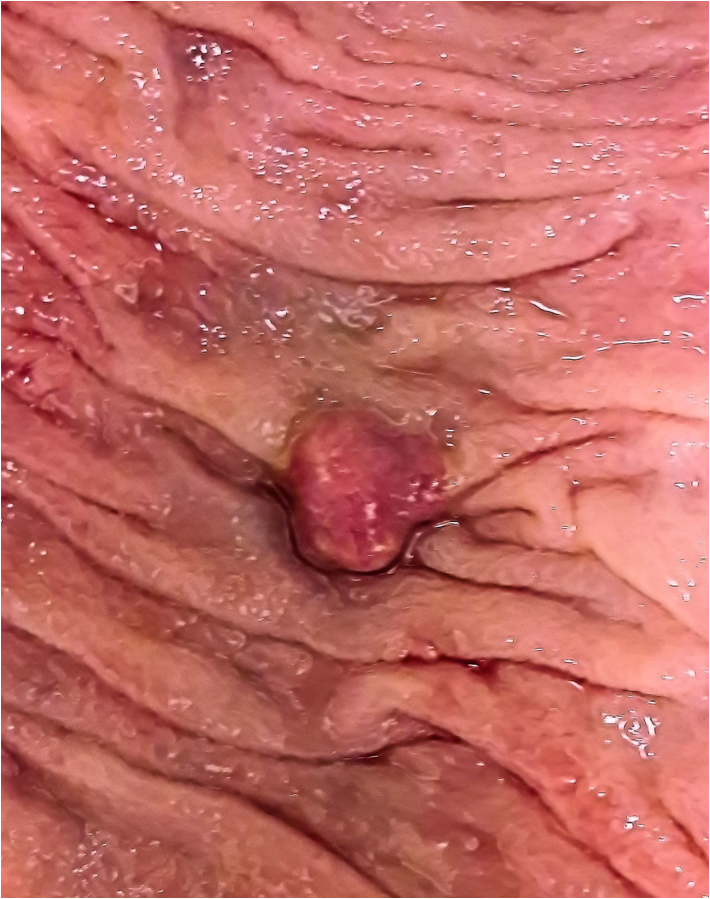
1.IntroductionThe diffusion of drugs, fluids, creams, and even unwanted hazardous chemicals in biological tissues is a research field with substantial interest in many clinical areas, such as poison treatment, cosmetics, pharmacology, and clinical research practice. In the particular case of biophotonics research,1 the technique of optical clearing (OC) is used to reduce light scattering inside the biological tissues and create a temporary transparency effect that can be used to perform a diagnosis or a treatment procedure.2–4 Natural biological tissues have in general high light scattering properties, which are a major drawback when optical technologies are to be used for diagnosis or therapy. The light scattering phenomenon limits tissue depth and beam collimation.3–6 Deeper tissue layers can be reached with imaging methods or laser therapy/surgery when using OC.6–8 Several OC studies have been performed in the past 15 years using different optical clearing agents (OCAs) to treat different types of biological tissues with the objective of reducing light scattering.1–3,9–12 OC treatments operate through two main mechanisms—tissue dehydration and refractive index (RI) matching.13 These two mechanisms are associated with two flows between the tissue and the outside. The dehydration mechanism is associated with the water flow out of the tissue in the beginning of the treatment and the RI matching mechanism is associated with the agent flow into the tissue that takes in general a longer time.13–15 As we have already discussed in a previous publication,13 each of these fluxes can be characterized by a diffusion time and a diffusion coefficient. For this reason, the evaluation of the diffusion properties of OCAs in biological tissues becomes of high importance because their value can be used to characterize OC mechanisms. The diffusion of OCAs in various biological tissues and blood has been studied by different research groups. Several researchers have used different methods to evaluate the characteristic diffusion properties during OC.16–18 The evaluation of OCA concentration efficiency with tissue depth and improved contrast of contrast of optical coherence tomography (OCT) and second harmonic generation (SHG) images at deeper tissue layers were reported.19,20 The diffusion time and diffusion coefficient are particular to each tissue/OCA treatment. The diffusion times for some OCAs, such as dimethyl sulfoxide,21 glucose,14,16,22,23 mannitol,22 sucrose,24 glycerol,25 lactose, and fructose,24 have been reported for various tissues and phantoms. The differentiation of glucose permeability has also been reported for normal and cancerous esophageal tissues.17 A method has been recently proposed to evaluate the diffusion of OCAs using the OCT imaging method.26 On the other hand, the determination of these diffusion properties can be made in a simple manner if we are able to work with ex vivo biological samples.13 Such a method is based on evaluating the time dependence of collimated transmittance () and thickness of the samples.13,14 Additionally to the determination of the characteristic diffusion time and diffusion coefficient, the studies provide additional information, such as the free water content of the tissues, and can be used to discriminate between healthy and pathological tissues. Colorectal carcinoma is a major health concern worldwide, presenting with high incidence and mortality rates.27 Population studies have demonstrated that the risk of developing colorectal carcinoma is slightly higher in men than in women, and it generally occurs in patients older than 50 years.28 As with any other type of cancer, colorectal carcinoma can be characterized by different stages of development: it begins with an uncontrolled cellular growth in healthy tissue, followed by the invasion of underlying tissues, and eventually spreads to other locations through the lymphatic system or the blood stream.29 The colon and rectum are tube-like structures that are part of the gastrointestinal tract, being composed of several concentric layers, as represented in Fig. 1. Fig. 1Structure of the colorectal wall made up of histologically distinct layers—from the inside (lumina) outward: mucosa, submucosa, and muscularis propria.  In the particular case of colorectal carcinoma, adenomatous polyps start to develop in the innermost layer—the mucosa.28 At later stages of development, polyps evolve into invasive adenocarcinoma which sequentially infiltrates the layers that compose the colorectal wall, first in the submucosa and eventually reaching the muscularis propria, the subserosal tissue or even the peritoneal lining or adjacent organs.29 Due to this development sequence, early colorectal carcinoma detection is possible using endoscopic methods. In fact, imaging endoscopic methods are used currently to detect colorectal polyps30 as the one displayed in Fig. 2. Apart from the traditional methods for colorectal carcinoma screening and diagnosis, such as conventional endoscopic imaging, computed tomography, magnetic resonance imaging, or positron emission tomography,30 there are alternative methods that rely on optical technologies. Such methods are commonly designated as optical biopsy.31 One such method is elastic scattering spectroscopy,32 which is used for colorectal carcinoma detection through endoscopy. Using a broadband light that emits from the UV to the near infrared, the elastic scattering spectroscopy method is based on the measurement of scattered photons inside the tissue that did not change their wavelength.32,33 This method also has an imaging version and can be used to evaluate RI, size, and structure of subcellular tissue components.34 Other common optical methods used for colorectal carcinoma detection are Raman spectroscopy,31,35 fluorescence imaging,36–40 reflectance spectroscopy,31,37,41 and OCT.42–44 Other less common methods are also used for colorectal carcinoma diagnosis. An example is the measurement of the shape of the RI correlation function that according to authors of Ref. 45 can be used to distinguish between healthy and pathological colorectal tissues. Several factors, like age, gender, or family history, may contribute to colorectal carcinoma development. Its genesis occurs when selected mutated cells start to clone themselves and their number proliferates in an uncontrolled manner.28 Such differences between healthy and pathological tissues are not only interesting for pathologists to establish a diagnosis. They are also important to the application of optical methods. It is known that healthy and pathological tissues present different refractive indices, as was recently demonstrated by two research groups specifically for colorectal tissues.45,46 One of these groups46 showed that at 964 nm, the RI of colorectal cancer tissues is higher than the RI of healthy tissues. Such study leads us to suspect that the other optical properties may also be different between healthy and pathological colorectal tissues of the colon. In the particular case of OC treatments, it has also been demonstrated for other tissues (breast tissues) that the diffusion properties of OCAs are different in healthy and pathological tissues.25 Such differentiation between the diffusion properties of OCAs in healthy and pathological tissues might be used to develop/improve minimally invasive diagnosis or surgical procedures. Since colorectal carcinomas infiltrate from the mucosa to the deeper layers, a surgical laser could be used with an endoscopic system during an OC procedure and reach higher tissue depths, improving staging strategies, which in the case of rectal cancer may entail neo-adjuvant chemotherapy and/or radiotherapy. Considering the possibility of using OC treatments in colorectal tissues to perform diagnosis or treatment procedures, we have studied the diffusion properties of glucose in colorectal healthy and pathological tissues. Our objective was to quantify the diffusion properties of glucose and differentiate both types of tissues from the results. 2.Materials and MethodsThe method used in this research to estimate the diffusion properties of OCAs in biological tissues is based on the evaluation of and thickness during OC treatments of ex vivo tissue samples.13,14 2.1.Tissue SamplesAll tissue samples used in the present study were surgically resected from patients treated at the Portuguese Oncology Institute of Porto, Portugal, during a 6-month period. All patients enrolled in this study signed written consent previous to surgical procedures allowing for subsequent use of surgical specimens for diagnostic and research purposes. This has been approved by the Ethics Committee of Portuguese Oncology Institute of Porto. These samples were collected from a population of 15 individuals (12 men and three women) with ages ranging from 43 to 94. Healthy and pathological colorectal mucosa samples were separated and preserved frozen at for a period of 12 to 24 h. A cryostat from Thermo Scientific™ (Waltham, Massachusetts), model Microm HM 550 was used to prepare samples with circular form () and 0.5-mm thickness. As the diffusion properties to be measured are mostly dependent on tissue hydration, we kept samples in saline for 10 min before initiating studies to mimic natural tissue hydration. The goal of our study was to compare normal and cancer tissues, both of which were processed using the standard protocol for freezing biological tissues. Consequently, we are sure that any discrepancy related to freezing should be minimal. 2.2.Optical Clearing AgentsAfter performing some preliminary studies, we prepared several glucose–water solutions to treat both types of samples. The solutions were prepared by diluting glucose in distilled water. The desired concentrations were obtained by performing control RI measurements of the solutions with an Abbe refractometer (). The glucose concentrations in solution to treat healthy colorectal mucosa samples were 20%, 25%, 30%, 35%, 40%, 45%, 50%, and 54%. To treat pathological colorectal mucosa samples, the same solutions were used along with others containing 10% and 15% of glucose. 2.3.MeasurementsAs we have already mentioned above, this study is based only on and thickness measurements made from natural samples and during treatments with glucose–water solutions. The measurements were performed using the setup presented in Fig. 3. The black dots above and below the tissue sample in Fig. 3 are used to fix the sample during measurements. In each study, a sample (healthy or pathological) was placed inside the black box presented in Fig. 3 and its spectrum was registered in the computer. Afterward, the solution containing glucose in a specific concentration was injected by a syringe to fill up the cuvette and immerse the tissue sample. The spectrometer software was programed to begin measurements at this time, and a complete study registers tissue spectra at each second during a 30-min period. A spectral resolution of 1 nm was adopted in all measurements. Each individual treatment with a particular tissue sample and a specific treating solution was performed three times with samples from different patients to average results. After the treatment is completed, the entire correspondent spectra are processed to create time dependence curves for specific wavelengths. In addition to measurements, we have used the setup presented in Fig. 4 to measure sample thickness, both from natural and under treatment samples. The micrometer represented in Fig. 4 had a precision of 0.001 mm. Using this setup, we measured sample thickness by inserting them in-between two microscope glasses with known thickness (). The lower glass was a common microscope glass with rectangular shape () and 1-mm thickness. The top glass had a square form with smaller dimensions () to minimize pressure over the tissue samples. A global thickness measurement of the tissue–glass layers () was made, and natural sample thickness is calculated according to the following equation: The same procedure was adopted during treatments. After measuring the thickness of the natural sample, we injected the treating solution into the middle of the microscope glasses. Measurements during treatment were made with a 15-s resolution within the first 2 min and with a 1-min resolution after that. For each particular treatment, three individual sets of measurements were made for each type of tissue, and mean thickness time dependence was calculated.13,14 2.4.Estimation of Glucose Diffusion PropertiesTo find the characteristic diffusion time of glucose in healthy and pathological mucosa, we performed the following steps:13,14
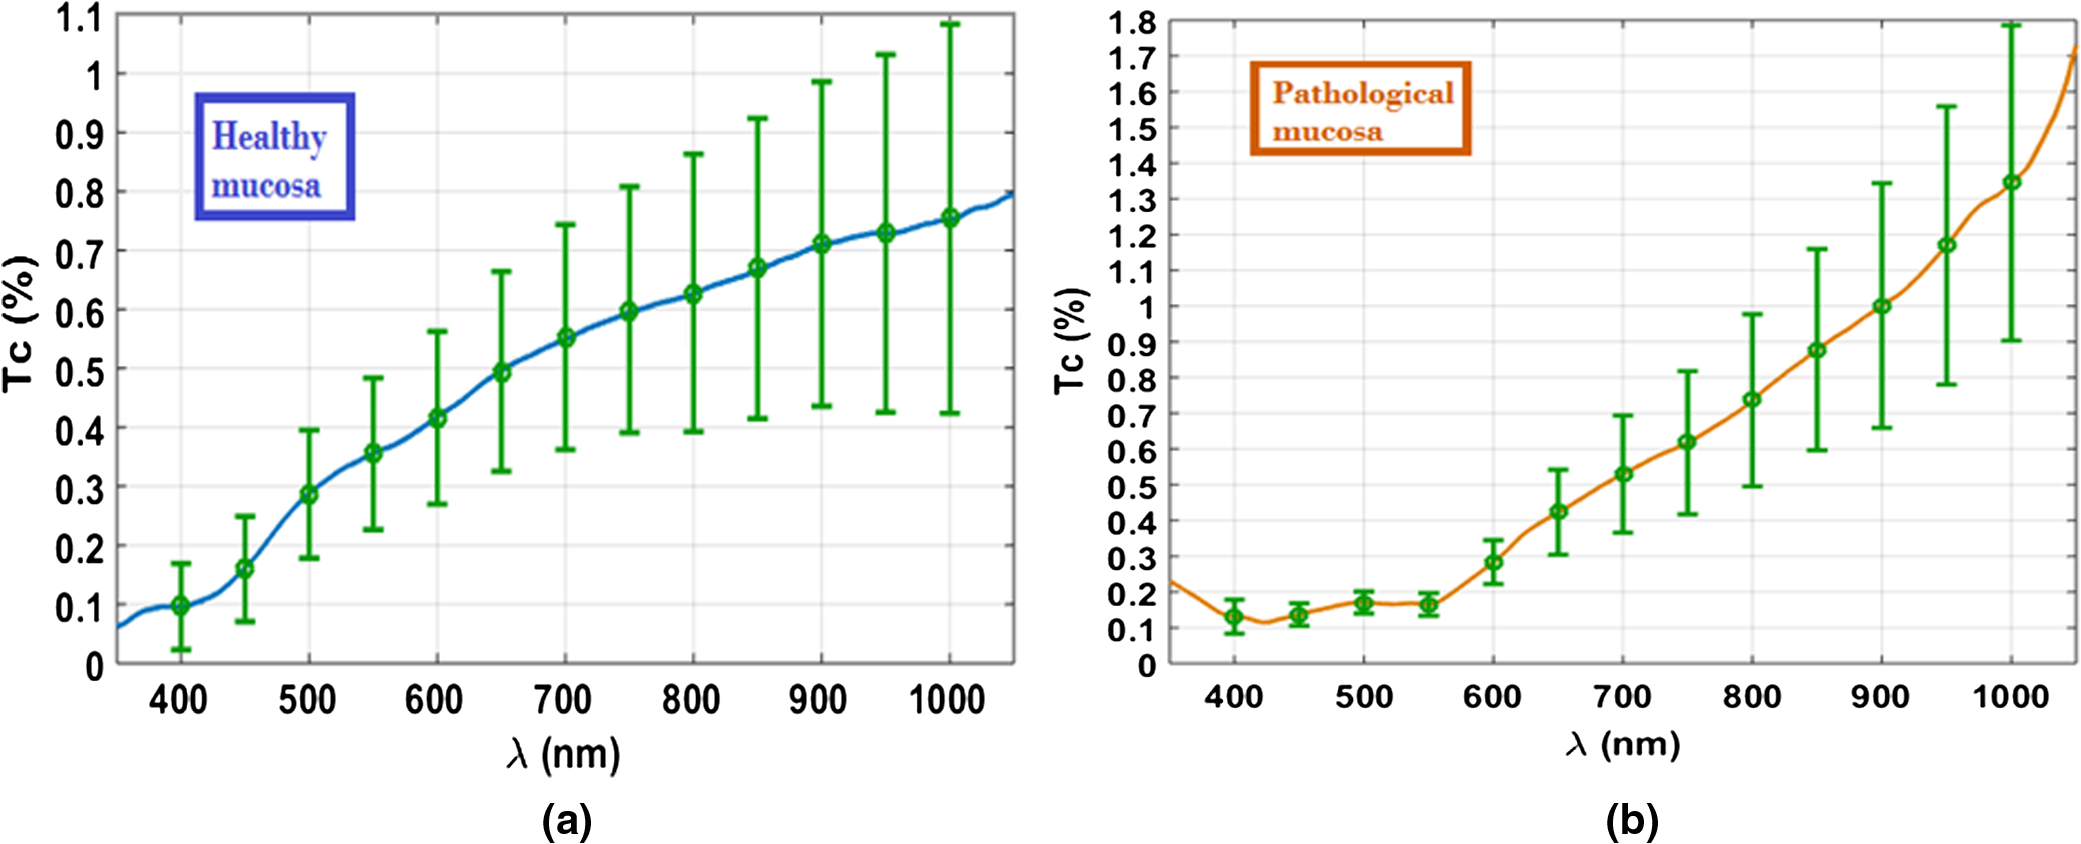
3.Experimental Results and CalculationsWhen we started measuring samples spectra, we immediately observed differences in natural spectra between healthy and pathological mucosa. Figure 5 presents the mean natural spectra for both tissues. As we can see from Fig. 5, although levels are in the same order or magnitude for both types of tissues, the pathological mucosa presents clearer hemoglobin absorption bands (dips at 414 nm and not resolved dips at 542 and 576 nm) due to higher blood content than healthy mucosa. Using all clearing solutions, we performed the treatments of healthy and pathological mucosa samples. Three studies with the same solution were performed with individual samples to obtain mean time dependencies. Figures 6 and 7 present the time dependencies obtained from some individual treatments of healthy and pathological mucosa. Fig. 6time dependencies obtained from healthy mucosa treated with: (a) 20% glucose, (b) 40% glucose, and (c) 54% glucose.  Fig. 7time dependencies obtained from pathological mucosa treated with: (a) 20% glucose, (b) 35% glucose, and (c) 54% glucose.  As we can see from graphs in Figs. 6 and 7, healthy mucosa shows the beginning of the saturation regime at 5 min when treated with 20% and 54% glucose, and pathological mucosa shows the beginning of the saturation regime at 6 min for treatment with 20% glucose and at 5 min when treated with 54% glucose. The beginning of saturation is identified when reaches a maximum value and tends to stabilize. The saturation regime is identified by no effective net flux between the tissue and the outside. This means that on average, no water or OCA flows in or outside the tissue.15 When this occurs, stabilizes, meaning that the time dependency does not vary with time. Depending on the OCA concentration used, after the saturation is reached, can stay invariant with time, it can decrease or it can increase, but for the treatments studied, we can identify the saturation regime even for a short time period. For treating solutions with higher water content than the free water in the tissue, tends to decrease after saturation is reached, indicating that some water back flux into the tissue occurs after saturation. For treating solutions with smaller water content than the free water in the tissue, tends to increase after saturation is reached, indicating that OCA continues to flow into the tissue after saturation. For the graph in Fig. 6(c), the saturation beginning is identified at 4 min for shorter wavelengths and at 6 min for longer wavelengths. For this reason, in this particular case, we selected the value of 5 min as the beginning of saturation for the treatment of healthy mucosa with 54% glucose. For the treatments of healthy mucosa with 40% glucose and pathological mucosa with 35% glucose, we see that saturation is reached only at the end of 30 min. This means that for these treatments, in particular, glucose diffuses into the tissues during all the treatment due to equilibrium between the water in the immersing solution and the free water inside the tissue.13 Such differentiation between the glucose concentration in the solutions for healthy and pathological mucosa allows for estimating different free water content values for healthy and pathological colorectal mucosa. We will perform such estimation below, after calculating the diffusion time values for glucose in the two types of tissues. Biological tissues contain water in two different states—bound and free. Bound water is strongly connected to the other tissue components and cannot move inside the tissue or to the outside, except when a strong stimulation is applied. Free water, on the other hand, is located between the other tissue components and can easily move from one place to another or to the outside when stimulated to do so. According to Ref. 47, when an appropriate stimulation like an OC treatment is applied to tissue, bound water can be converted into free water, and free water can be moved to the outside. The inverse path can also be possible depending on the applied stimulation. Bound water, on the other hand, cannot move directly to the outside of the tissue or vice versa.47 The exchange of water between the bound and free states and between the free state and the outside can be described by the following equations:47 In Eqs. (4) and (5), represents the exchange rate between the outside and the free state, and represents the exchange rate between the free and bound states. The differences inside parenthesis in both equations represent the difference between water concentrations in the various locations (or states) inside and outside the tissue.47We will now consider the beginning of the saturation regime in the various treatments presented in graphs of Figs. 6 and 7 to proceed with calculations and estimate the glucose diffusion properties in colorectal mucosa tissues. To perform such calculations, we have developed a personalized software application48 that reads the spectra measured during the various treatments of a particular type of tissue and processes all data in sequential steps to calculate the OCA diffusion time. The first step done by this application after calculating the time dependencies for the selected wavelengths is done to split the time dependencies in two—one from the beginning of the treatment until the beginning of the saturation regime to be postprocessed and the remaining part to be neglected.48 After neglecting the data, after the beginning of the saturation regime, each time dependency within a treatment is displaced vertically to have at the beginning of the treatment and then normalized to its highest value, so they can be fitted with a curve described by Eq. (2).13,14 Figures 8 and 9 present similar graphs to the ones in Figs. 6 and 7 after performing these adjustments, but without considering the normalization procedure. No normalization was applied in the graphs of Figs. 8 and 9 for better visual perception of the individual time dependencies and to show that the behavior is accorded to the curve described by Eq. (2). Fig. 8Same time dependencies as in Fig. 6, but now considering only the time period before the beginning of the saturation regime, and after performing vertical displacement. Treatments of healthy mucosa with: (a) 20% glucose, (b) 40% glucose, and (c) 54% glucose.  Fig. 9Same time dependencies as in Fig. 7, but now considering only the time period before the beginning of the saturation regime, and after performing vertical displacement. Treatments of pathological mucosa with: (a) 20% glucose, (b) 35% glucose, and (c) 54% glucose.  All time dependencies in Figs. 8 and 9 represent the experimental data from the beginning of treatment to the beginning of the saturation regime. At this stage, the software application48 allows the user to open a new window for fitting purposes. Such a window contains several subwindows, one for each dataset that corresponds to a particular wavelength. In each of these subwindows, the curve fitting tool of MATLAB™ is available to let the user select the appropriate equation for the fitting curve. Since the curve used to fit each dataset is the one described by Eq. (2), when a particular fitting is done the correspondent diffusion time is estimated for that particular fitting. We have performed this fitting procedure for every dataset (one per wavelength) within each of the various treatments performed with healthy and pathological mucosa samples. As a result of these fittings, we have obtained the mean diffusion time values presented in Table 1. Table 1Mean and standard deviation values for the glucose diffusion time in healthy and pathological colorectal samples.
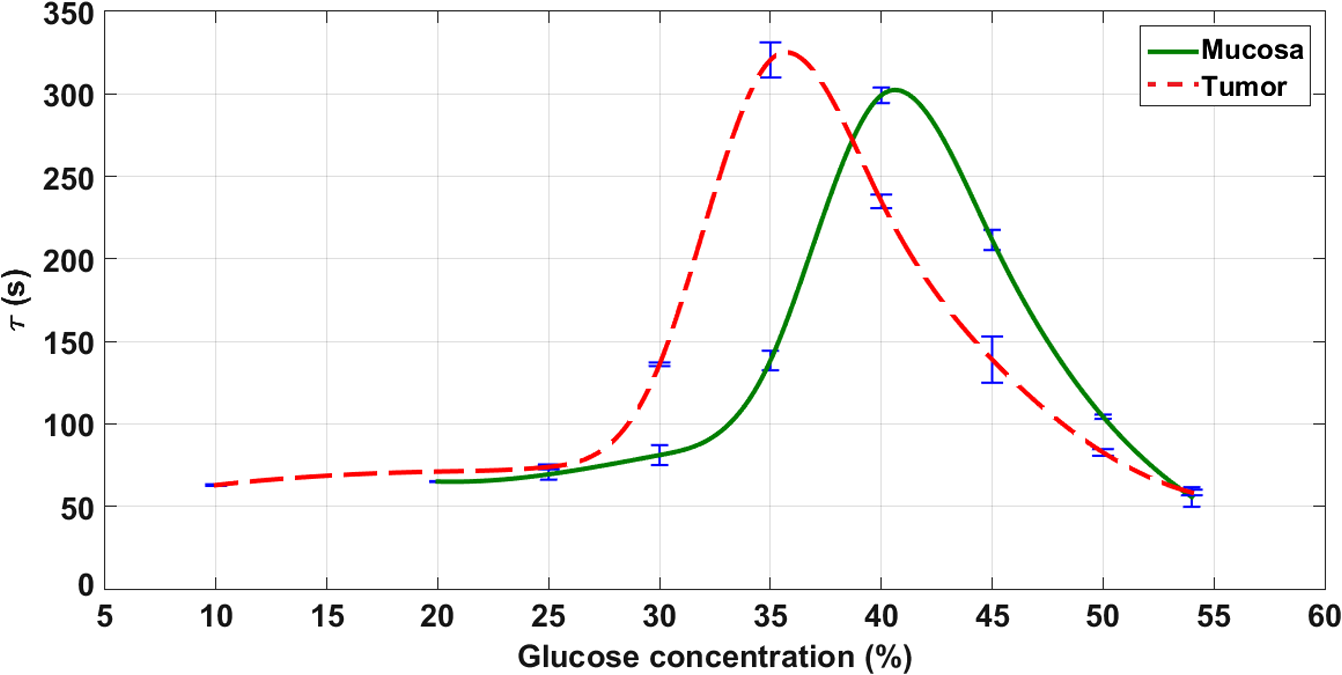
The values in Table 1 were presented in Fig. 10 to show the dependence between the diffusion coefficient of glucose in healthy and pathological mucosa with glucose concentration in the clearing solution. As presented in Fig. 10, the curves show differences between healthy and pathological mucosa. Several results can be obtained by analyzing graphs in Fig. 10. For healthy mucosa, we see that maximum glucose diffusion is obtained for a concentration of 40.6%. This means that equilibrium is established between the free water content in the tissue and the water in the treating solution for this case. As a result, the free water content in the healthy mucosa is 59.4% (100% to 40.6%). For the case of the pathological mucosa, the maximum diffusion is observed in Fig. 10 for a glucose concentration of 35.6% (5% smaller than in healthy mucosa). This result shows the first difference between healthy and pathological mucosa and it means that pathological tissues have higher water content than healthy tissues. A free water content of 64.4% (100% to 35.6%) for pathological mucosa is estimated from the graph in Fig. 10, meaning that cancer cells might steal water from surrounding tissues or alternatively bound water is converted into free water in cancer cells. Similarly, different water content results were already observed for other tissues.25,49 As discussed by authors of Ref. 25, higher free water content in pathology relative to healthy tissues might be due to conversion of bound water into free water within colorectal carcinoma polyps.25 Although the authors of Ref. 25 have studied glycerol diffusion in healthy and pathological breast tissues, they have found that the permeability coefficient to 60% glycerol in cancer tissues is 3.54-fold higher than in healthy tissues. These data are more or less related to the rate of glycerol turnover in healthy volunteers and cancer patients, which were significantly elevated in cancer patients.50 Each curve in Fig. 10 shows a peak at a particular glucose concentration depending on the tissue type. These peaks correspond to optimized glucose diffusion into the tissues and their values are the characteristic diffusion time values of glucose into healthy colorectal mucosa (302.4 s) and pathological mucosa (325.1 s). This difference between the glucose diffusion time values indicates that glucose takes more time to diffuse into pathological mucosa. The reasons for this higher diffusion time in cancer tissue can be various. From one hand, it is known that OC has two main mechanisms. The first is tissue dehydration that is associated with a water flow out of the tissue.2,13 The second is the RI matching mechanism that is associated with OCA flow into the tissue.2,13 Considering these fluxes and since pathological mucosa has higher water content than healthy mucosa, a larger magnitude water flow out will slow down glucose flowing into the tissue. On the other hand, cancer cells might provide far more glucose traps than normal cells due to cancer cell higher rate of glucose consumption.51 Figure 10 gives additional information. After estimating the diffusion time values for glucose, which characterize the RI matching mechanism, we can also estimate the diffusion time values for water in both types of tissues. Those values are also characteristic for the dehydration mechanism occurring in colorectal mucosa tissues. Considering the higher glucose concentration used (54%), we can consider that treatments with this solution will only stimulate tissue dehydration and no (or much less) glucose diffusion occurs.13 For healthy mucosa, we see a diffusion time of 55.7 s for the water flowing out. In the case of pathological mucosa, the diffusion time is 58.4 s. Both these values are smaller than 1 min, as we have also verified for skeletal muscle under treatment with different OCAs.13–15 The estimated values for the diffusion times of glucose and water in colorectal mucosa tissues allow for the calculation of the corresponding diffusion coefficients if we have the time dependencies of samples’ thickness during the treatments with the individual glucose concentrations. To make these calculations possible, we have performed thickness measurements using the setup in Fig. 4. For pathological mucosa samples, the maximum diffusion time is obtained for a treatment with 35.6% glucose and the minimum diffusion time for a treatment with 54% glucose. In the case of healthy mucosa samples, the glucose concentrations of interest are 40.6% and 54%. As an approximation, we have performed temporal thickness measurements from pathological mucosa samples during treatments with glucose in concentrations of 35% and 54%. For healthy mucosa samples, we used solutions with glucose concentrations of 40% and 54%. Three sets of thickness measurements were made from individual healthy colorectal mucosa samples under treatment with 40% and 54% glucose solutions. The same methodology was adopted to measure thickness time dependencies from pathological colorectal samples under treatment with 35% and 54% glucose solutions. The mean results from these studies are presented in Fig. 11. Fig. 11Mean thickness time dependencies for healthy (a) and pathological (b) mucosa samples trerated with different glucose concentrations. 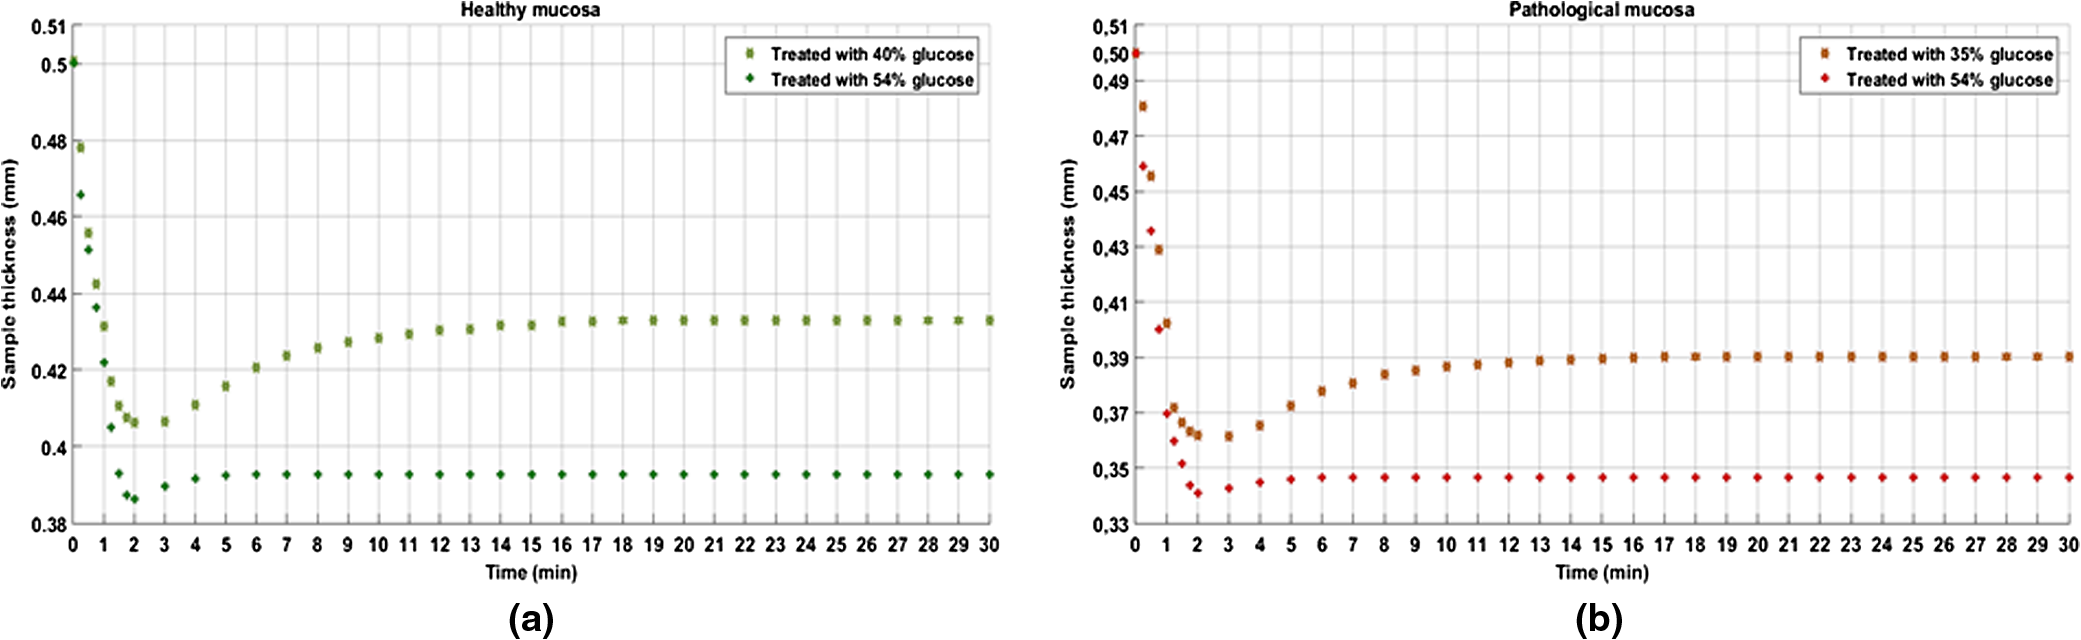 Starting with 0.5-mm thickness in all samples, we see different time dependencies for sample thickness. In both tissue types, we see that higher glucose concentration used in the treating solutions originates a higher thickness decrease within the first 2 min of treatment. As we see from graphs in Fig. 11, treatments with 54% glucose originate a strong thickness decrease at the beginning of treatment, followed with a stabilized thickness behavior for the rest of the treatment. Such behavior is consistent with the fact of unique water flow out of the tissue. On the other hand, the thickness time dependencies for pathological mucosa with 35% glucose and for healthy mucosa with 40% glucose show a significant and smooth sample thickness increase between the initial strong decrease and the final stabilized thickness behavior. Such time dependencies indicate the occurrence of smooth glucose diffusion into the tissues after the initial dehydration until the end of the treatment. To calculate the diffusion coefficients that characterize the dehydration and RI mechanisms of OC, we need to use correct sample thicknesses in Eq. (3). To do this, we need to retrieve from graphs in Fig. 11 the sample thicknesses that correspond to the diffusion time values obtained from graphs in Fig. 10. In this way, we started by fitting the discrete data in graphs of Fig. 11 with smooth spline curves, so we can obtain thickness values at precise times of treatment. Considering each glucose treatment presented in graphs of Fig. 11, we retrieved from the smoothed thickness data the sample thickness that corresponds to the diffusion time obtained from the same treatment in Fig. 10. Using these values in Eq. (3)2 along with the corresponding diffusion times, we have calculated the diffusion coefficients for glucose and water in healthy and pathological mucosa. Table 2 contains the characteristic diffusion properties of glucose and water that characterize the RI matching and dehydration mechanisms of OC in healthy and pathological mucosa. Table 2Diffusion properties of glucose and water in healthy and pathological mucosa.
The values in Table 2 are characteristic for the two main mechanisms in OC of colorectal mucosa tissues. We see that the dehydration mechanism is much faster than the RI matching because it occurs within the first minute of treatment as we have already seen for muscle tissue.13 The RI matching mechanism takes a longer time to complete both in healthy and pathological mucosa. Regarding the diffusion coefficients of glucose, we have obtained a value of for healthy mucosa, which is much closer to the value that we have previously obtained for skeletal muscle.13 Pathological mucosa shows a smaller diffusion coefficient than healthy mucosa possibly due to higher rate of glucose trapping by cells compared with normal cells.51 4.Conclusions and Future PerspectivesWe have applied a robust method to estimate the diffusion properties of glucose in ex vivo colorectal mucosa tissues. The results of the present study have demonstrated different diffusion properties for glucose and water in healthy and pathological (i.e., cancerous) colorectal mucosa tissues. The dehydration and RI matching mechanisms of OC are perfectly characterized by the diffusion time and diffusion coefficient values that we have estimated for the treatments of healthy and pathological colon mucosa. We have also verified that pathological colorectal mucosa has higher free water content (64.4%) than healthy mucosa (59.4%). Such information can be used for diagnosis or treatment procedures with other optical methods and to plan adequate OC treatments to use in such procedures, depending on the time of treatment available or the desired magnitude of the transparency effect to create in the tissues. We plan to continue this line of research. Similar studies can be performed for other biological tissues to estimate the differences in the diffusion properties of OCAs to differentiate between healthy and pathological tissues. Since we have obtained differences between both types of tissues, we plan also to study the optical properties of healthy and pathological colorectal mucosa. By measuring the RI and estimating the anisotropy, absorption, and scattering coefficients of healthy and pathological tissues, we expect to obtain different values that will allow perfect identification and differentiation between the two. By gathering such data, diagnosis or treatment procedures can be developed or optimized to be used in the fight against cancer. After obtaining the diffusion data for glucose and water on ex vivo tissues, we are planning to perform measurements in the future on an in vivo animal model to evaluate differences. However, based on our experimental data and direct measurements of tissue hydration for skin,52 we can predict that tissue physiological reaction (which is delayed due to physiological reaction inertia) will correct the time response on a longer timescale. Nevertheless, we expect similar results to those obtained from ex vivo samples on a shorter time interval ( to 20 min). The differences observed between healthy and pathological tissues should also be expected for an in vivo study or even with a higher magnitude due to the different blood supply and vasculature network development of the two types of tissues. AcknowledgmentsWe would like to show our appreciation for the availability of instrumental and technical resources from I3S-Porto and the help of Claudia Machado in preparing the tissue samples used in this research. This research was supported by the Portuguese Research grant FCT-UID/EQU/00305/2013. VVT was supported by the Russian Presidential grant NSh-7898.2016.2, the Russian Governmental grant 14.Z50.31.0004, and the National Research Tomsk State University Academic D. I. Mendeleev Fund Program. ReferencesE. A. Genina, A. N. Bashkatov, V. V. Tuchin,
“Glucose-induced optical clearing effects in tissues and blood,”
Handbook of Optical Sensing of Glucose in Biological Fluids and Tissues, 657
–692 CRC Press, Taylor & Francis Group, Boca Raton
(2009). Google Scholar
V. V. Tuchin, Optical Clearing of Tissues and Blood, SPIE Press, Bellingham, Washington
(2006). Google Scholar
G. Vargas et al.,
“Use of an agent to reduce scattering in skin,”
Lasers Surg. Med., 24
(2), 133
–141
(1999). http://dx.doi.org/10.1002/(ISSN)1096-9101 LSMEDI 0196-8092 Google Scholar
M. H. Khan et al.,
“Optical clearing of in vivo human skin: implications for light-based diagnostic imaging and therapeutics,”
Lasers Surg. Med., 34
(2), 83
–85
(2004). http://dx.doi.org/10.1002/(ISSN)1096-9101 LSMEDI 0196-8092 Google Scholar
A. N. Bashkatov et al.,
“Optical immersion as a tool for tissue scattering properties control,”
Perspectives in Engineering Optics, 313
–334 Anita Publications, New Delhi, India
(2002). Google Scholar
I. V. Larina et al.,
“Enhanced OCT imaging of embryonic tissue with optical clearing,”
Laser Phys. Lett., 5 476
–479
(2008). http://dx.doi.org/10.1002/lapl.200810019 1612-2011 Google Scholar
V. V. Tuchin et al.,
“Light propagation in tissues with controlled optical properties,”
J. Biomed. Opt., 2
(4), 401
–417
(1997). http://dx.doi.org/10.1117/12.281502 JBOPFO 1083-3668 Google Scholar
S. Plotnikov et al.,
“Optical clearing for improved contrast in second harmonic generation imaging of skeletal muscle,”
Biophys. J., 90
(1), 328
–339
(2006). http://dx.doi.org/10.1529/biophysj.105.066944 BIOJAU 0006-3495 Google Scholar
E. A. Genina et al.,
“Tissue optical immersion clearing,”
Expert Rev. Med. Devices, 7
(6), 825
–842
(2014). http://dx.doi.org/10.1586/erd.10.50 1743-4440 Google Scholar
K. Becker et al.,
“Chemical clearing and dehydration of GFP expressing mouse brains,”
PLoS One, 7
(3), e33916
(2012). http://dx.doi.org/10.1371/journal.pone.0033916 POLNCL 1932-6203 Google Scholar
K. Becker et al.,
“Dehydration and clearing of whole mouse brains and dissected hippocampi for ultramicroscopy,”
Cold Spring Harbor Protoc., 2013
(7), 683
–684
(2013). http://dx.doi.org/10.1101/pdb.prot075820 Google Scholar
K. Chung et al.,
“Structural and molecular interrogation of intact biological systems,”
Nature, 497 332
–337
(2013). http://dx.doi.org/10.1038/nature12107 Google Scholar
L. Oliveira et al.,
“Diffusion characteristics of ethylene glycol in skeletal muscle,”
J. Biomed. Opt., 20
(5), 051019
(2015). http://dx.doi.org/10.1117/1.JBO.20.5.051019 JBOPFO 1083-3668 Google Scholar
L. Oliveira et al.,
“The characteristic time of glucose diffusion measured for muscle tissue at optical clearing,”
Laser Phys., 23 075606
(2013). http://dx.doi.org/10.1088/1054-660X/23/7/075606 LAPHEJ 1054-660X Google Scholar
L. Oliveira et al.,
“Optical clearing mechanisms characterization in muscle,”
J. Innovative Opt. Health Sci., 9
(5), 1650035
(2016). http://dx.doi.org/10.1142/S1793545816500358 Google Scholar
M. G. Ghosn et al.,
“Differential permeability rate and percent clearing of glucose in different regions in rabbit sclera,”
J. Biomed. Opt., 13 021110
(2008). http://dx.doi.org/10.1117/1.2907699 JBOPFO 1083-3668 Google Scholar
Q. L. Zhao et al.,
“Quantifying glucose permeability and enhanced light penetration in ex vivo human normal and cancerous esophagus tissues with optical coherence tomography,”
Laser Phys. Lett., 8 71
–77
(2011). http://dx.doi.org/10.1002/lapl.v8.1 1612-2011 Google Scholar
O. Zhernovaya et al.,
“Blood optical clearing study by optical coherence tomography,”
J. Biomed. Opt., 18
(2), 026014
(2013). http://dx.doi.org/10.1117/1.JBO.18.2.026014 JBOPFO 1083-3668 Google Scholar
M. G. Ghosn et al.,
“Concentration effect on the diffusion of glucose in ocular tissues,”
Opt. Lasers Eng., 46
(12), 911
–914
(2008). http://dx.doi.org/10.1016/j.optlaseng.2008.05.004 Google Scholar
O. Nadiarnykh, P. J. Campagnola,
“SHG and optical clearing,”
Second Harmonic Generation Imaging, 169
–189 CRC Press, Taylor & Francis Group, Boca Raton, Florida
(2014). Google Scholar
P. Liu et al.,
“Discrimination of dimethyl sulfoxide diffusion coefficient in the process of optical clearing by confocal micro-Raman spectroscopy,”
J. Biomed. Opt., 18
(2), 020507
(2013). http://dx.doi.org/10.1117/1.JBO.18.2.020507 JBOPFO 1083-3668 Google Scholar
A. N. Bashkatov et al.,
“Glucose and mannitol diffusion in human dura mater,”
Biophys. J., 85
(5), 3310
–3318
(2003). http://dx.doi.org/10.1016/S0006-3495(03)74750-X BIOJAU 0006-3495 Google Scholar
R. Bertam and M. Pernarowski,
“Glucose diffusion in pancreatic islets of Langerhans,”
Biophys. J., 74
(4), 1722
–1731
(1998). http://dx.doi.org/10.1016/S0006-3495(98)77883-X BIOJAU 0006-3495 Google Scholar
A. C. Ribeiro et al.,
“Binary mutual diffusion coefficients of aqueous solutions of sucrose, lactose, and fructose in the temperature range from (298.15 to 328.15) K,”
J. Chem. Eng. Data, 51
(5), 1836
–1840
(2006). http://dx.doi.org/10.1021/je0602061 JCEAAX 0021-9568 Google Scholar
H. Q. Zhong et al.,
“Quantification of glycerol diffusion in human normal and cancer breast tissues in vitro with optical coherence tomography,”
Laser Phys. Lett., 7
(4), 315
–320
(2010). http://dx.doi.org/10.1002/lapl.v7:4 Google Scholar
K. Larin et al.,
“Optical clearing for OCT image enhancement and in-depth monitoring of molecular diffusion,”
IEEE J. Sel. Top. Quantum Electron., 18
(3), 1244
–1259
(2012). http://dx.doi.org/10.1109/JSTQE.2011.2181991 IJSQEN 1077-260X Google Scholar
H. Brenner et al.,
“Colorectal cancer,”
Lancet, 383
(9927), 1490
–1502
(2014). http://dx.doi.org/10.1016/S0140-6736(13)61649-9 LANCAO 0140-6736 Google Scholar
R. Subramaniam et al.,
“Mechanistic roles of epithelial and immune cell signaling during the development of colitis-associated cancer,”
Cancer Res. Front., 2
(1), 1
–21
(2016). http://dx.doi.org/10.17980/2015.1 Google Scholar
A. Pierangelo et al.,
“Ex-vivo characterization of human colon cancer by Mueller polarimetric imaging,”
Opt. Express, 19
(2), 1582
–1593
(2011). http://dx.doi.org/10.1364/OE.19.001582 OPEXFF 1094-4087 Google Scholar
S. D. Curran, L. H. Schwartz,
“Colorectal cancer imaging,”
Colorectal Cancer: Evidence-based Chemotherapy Strategies, 219
–230 Humana Press, New Jersey
(2007). Google Scholar
E. Rodriguez-Diaz et al.,
“Integrated optical tools for minimally invasive diagnosis and treatment at gastrointestinal endoscopy,”
Rob. Comput. Integr. Manuf., 27
(2), 249
–256
(2011). http://dx.doi.org/10.1016/j.rcim.2010.06.006 RCIMEB 0736-5845 Google Scholar
G. Keiser, Biophotonics–Concepts and Applications, Springer, Singapore
(2016). Google Scholar
G. Zonios et al.,
“Diffuse reflectance spectroscopy of human adenomatous colon polyps in vivo,”
Appl. Opt., 38
(31), 6628
–6637
(1999). http://dx.doi.org/10.1364/AO.38.006628 Google Scholar
V. Backman et al.,
“Imaging and measurement of cell structure and organization with submicron accuracy using light scattering spectroscopy,”
Proc. SPIE, 4613 101
–110
(2012). http://dx.doi.org/10.1117/12.465234 PSISDG 0277-786X Google Scholar
T. C. B. Schut et al.,
“In vivo detection of dysplastic tissue by Raman spectroscopy,”
Anal. Chem., 72
(24), 6010
–6018
(2000). http://dx.doi.org/10.1021/ac000780u ANCHAM 0003-2700 Google Scholar
S. K. Majumder et al.,
“Relevance vector machine for optical diagnosis of cancer,”
Lasers Surg. Med., 36
(4), 323
–333
(2005). http://dx.doi.org/10.1002/(ISSN)1096-9101 LSMEDI 0196-8092 Google Scholar
S. K. Chang et al.,
“Combined reflectance and fluorescence spectroscopy for in vivo detection of cervical pre-cancer,”
J. Biomed. Opt., 10
(2), 024031
(2005). http://dx.doi.org/10.1117/1.1899686 JBOPFO 1083-3668 Google Scholar
C. Hirche et al.,
“Ultrastaging of colon cancer by sentinel node biopsy using fluorescence navigation with indocyanine-green,”
Int. J. Colorectal Dis., 27
(3), 319
–324
(2012). http://dx.doi.org/10.1007/s00384-011-1306-5 IJCDE6 1432-1262 Google Scholar
J. Bedwell et al.,
“Fluorescence distribution and photodynamic effect of ALA-induced PP IX in the DMH rat colonic tumor model,”
Br. J. Cancer, 65
(6), 818
–824
(1992). http://dx.doi.org/10.1038/bjc.1992.175 BJCAAI 0007-0920 Google Scholar
L. Wang et al.,
“Tryptophan as a key biomarker to detect gastrointestinal tract cancer using non-negative biochemical analysis of native fluorescence and Stokes shift spectroscopy,”
Proc. SPIE, 9318 93180X
(2015). http://dx.doi.org/10.1117/12.2077304 PSISDG 0277-786X Google Scholar
Y. N. Mirabal et al.,
“Reflectance spectroscopy for in vivo detection of cervical precancer,”
J. Biomed. Opt., 7
(4), 587
–594
(2002). http://dx.doi.org/10.1117/1.1502675 JBOPFO 1083-3668 Google Scholar
L. P. Hariri et al.,
“Endoscopic optical coherence tomography and laser-induced fluorescence spectroscopy in a murine colon cancer model,”
Lasers Surg. Med., 38
(4), 305
–313
(2006). http://dx.doi.org/10.1002/(ISSN)1096-9101 LSMEDI 0196-8092 Google Scholar
J. M. Poneros et al.,
“Diagnosis of specialized intestinal metaplasia by optical coherence tomography,”
Gastroenterology, 120
(1), 7
–12
(2001). http://dx.doi.org/10.1053/gast.2001.20911 GASTAB 0016-5085 Google Scholar
A. F. Fercher et al.,
“Optical coherence tomography–principles and applications,”
Rep. Prog. Phys., 66
(2), 239
–303
(2003). http://dx.doi.org/10.1088/0034-4885/66/2/204 Google Scholar
A. J. Gomes et al.,
“In vivo measurement of the shape of the tissue-refractive-index correlation function and its application to detection of colorectal field carcinogenesis,”
J. Biomed. Opt., 17
(4), 047005
(2012). http://dx.doi.org/10.1117/1.JBO.17.4.047005 JBOPFO 1083-3668 Google Scholar
P. Giannios et al.,
“Complex refractive index of normal and malignant human colorectal tissue in the visible and near-infrared,”
J. Biophotonics, 10
(2), 202
–210
(2017). http://dx.doi.org/10.1002/jbio.201600001 Google Scholar
B. Schultz et al.,
“Spectroscopic ellipsometry on biological materials–investigation of hydration dynamics and structural properties,”
Thin Solid Films, 455–456 731
–734
(2004). http://dx.doi.org/10.1016/j.tsf.2004.01.060 THSFAP 0040-6090 Google Scholar
P. Peixoto et al.,
“Software development for estimation of optical clearing agent’s diffusion coefficients in biological tissues,”
J. Biomed. Photonics Eng., 1
(4), 255
–269
(2016). http://dx.doi.org/10.18287/JBPE-2015-1-4-255 Google Scholar
S. Chung et al.,
“In vivo water state measurements in breast cancer using broadband diffuse optical spectroscopy,”
Phys. Med. Biol., 53
(23), 6713
–6727
(2008). http://dx.doi.org/10.1088/0031-9155/53/23/005 PHMBA7 0031-9155 Google Scholar
J. H. F. Shaw and R. R. Wolfe,
“Fatty acid and glycerol kinetics in septic patients and in patients with gastrointestinal cancer–the response to glucose infusion and parenteral feeding,”
Ann. Surg., 205
(4), 368
–376
(1987). http://dx.doi.org/10.1097/00000658-198704000-00005 ANSUA5 0003-4932 Google Scholar
R. J. Gillies et al.,
“Causes and consequences of increased glucose metabolism of cancers,”
J. Nucl. Med., 49
(6), 24S
–42S
(2008). http://dx.doi.org/10.2967/jnumed.107.047258 JNMEAQ 0161-5505 Google Scholar
A. S. Kolesnikov et al.,
“THz Monitoring of the dehydration of biological tissues affected by hyperosmotic agents,”
Phys. Wave Phenom., 22
(3), 169
–176
(2014). http://dx.doi.org/10.3103/S1541308X14030029 Google Scholar
BiographySónia Carvalho is currently a third-year pathology resident at Portuguese Oncology Institute of Porto, Portugal. She received her MD degree in medicine in 2012 from the Faculty of Medicine of the University of Coimbra, Portugal. In January 2013, she started supervised medical practice at Centro Hospitalar de Lisboa Norte, Portugal. She participates in different medical and scientific activities within the scope of the residency program, and her main research focus, at present, is colorectal carcinoma. She is a member of the European Society of Pathology. Nuno Gueiral is an adjunct professor at the Physics Department of the Polytechnic Engineering School of Porto, Portugal. He obtained PhD degree in applied physics from the University of Vigo in 2016. He was author or coauthor on some papers and one chapter of Recent advances in Arthoplasty. He is a member of the Center for Innovation in Engineering and Industrial Technology (CIETI) and his main research interests are acoustics, metrology, and biomedical optics. Elisabete Nogueira received her MSc degree in electrical and computer engineering in 1992 from Porto University, Portugal, and her PhD in applied physics in 2000 from Minho University, Portugal. She is an adjunct professor and was recently head of the Physics Department of the Polytechnic Engineering School of Porto, Portugal. She is a senior researcher at the CIETI. Her research interests include acoustic propagation in human tissues (including cancer), nanomaterials, and biomedical optics. Rui Henrique received his MD degree in 1992, his PhD in medical sciences in 2006 and the habilitation in pathology and molecular genetics in 2011, all from the University of Porto. He is director of the Department of Pathology at Portuguese Oncology Institute of Porto and invited full professor of pathology and oncobiology at the Abel Salazar Biomedical Sciences Institute of the University of Porto, Portugal. He has authored or coauthored 175 international publications. His research interests are focused on the role of epigenetic alterations in genitourinary cancers and development of biomarkers. Luís Oliveira is an adjunct professor at the Physics Department of the Polytechnic Engineering School of Porto and a researcher at the CIETI, Portugal. He graduated in physics in 2000 and received his MSc and PhD degrees in biomedical engineering in 2007 and 2014, all from the University of Porto, Portugal. Has authored and reviewed several papers in tissue optics. His main research interests are tissue optics and control of tissue optical properties. Valery V. Tuchin is a professor and head of optics and biophotonics at Saratov National Research State University and several other universities and institutions. His research interests include tissue optics, laser medicine, tissue optical clearing, and nanobiophotonics. He is a fellow of SPIE and OSA, and has been awarded honored science worker of Russia, SPIE Educator Award, FiFiPro, Finland, Chime Bell Prize of Hubei Province, China, and Joseph W. Goodman Book Writing Award (OSA/SPIE). |
||||||||||||||||||||||||||||||||||||||||||||||||||||||||||||||||||||||||||||||||||||||||||||||||