
|
|
1.IntroductionMultiphoton excitation (MPE) microscopy facilitates three-dimensional (3-D) imaging of fluorescence-labeled molecules in in vivo biospecimens with favorable penetration depth, low invasiveness, and minimal photobleaching and photodamage.1–5 Because of the requirement of fast frame rate in applications of live samples, many studies have demonstrated that the temporal resolution of MPE fluorescence imaging exhibits a great improvement when temporal focusing MPE microscopy (TFMPEM) is applied.6–12 Compared with MPE fluorescence imaging that uses only spatial focusing excitation and point-by-point scanning to map the images, scanless temporal focusing directly obtains the maximal excitation probability only in the image plane through pulse propagation geometry.6–13 The TFMPEM configuration functions by spatially separating the frequencies of a short pulse through a diffraction device, collimating these beams using a lens, and recombining them using an objective lens. Finally, the different frequency components are overlapped in phase at the focal plane.6–8 This process appears to create a plane illumination that features a short, high-peak power pulse to excite the multiphoton fluorescence of specimens. Thus, by synchronizing the control signals of the axial-scanning piezo stage and electron-multiplying charge-coupled device (EMCCD), the volumetric imaging rate of TFMPEM was demonstrated to be .14 However, the lateral and axial resolutions of TFMPEM imaging that is based on a configuration of the widefield excitation are several hundred nanometers and several micrometers. The spatial resolution of TFMPEM remains a concern for bioimaging applications. Structured light illumination techniques, such as nonlinear structured illumination microscopy and HiLo microscopy for TFMPEM, were developed to increase the signal-to-noise ratio (SNR) of MPE images by reducing the scattering signals from the out-of-focus fluorescence and to improve the spatial resolution of TFMPEM in turbid media.15–17 The patterned illumination of TFMPEM can be created using the projection of a fringe and grid,18 a spatial light modulator,19–21 and a digital micromirror device (DMD).22 Additionally, TFMPEM combined with astigmatism imaging can indicate the positions of fluorescent particles and molecules in 3-D with applied positioning resolution of (lateral) and 21 nm (axial). The combination can additionally extract the particles and molecule transport trajectories to explore the motion behaviors of fluorescent particles and the interaction of molecules.23,24 Although these improvements in temporal and spatial resolutions enable TFMPEM to be a powerful platform for visualizing the dynamic distribution of molecules and cells and the architecture of subcellular structures in biotissues, TFMPEM is insufficient for performing efficient excitation of fluorophores with different two-photon absorption spectra in multifluorophore imaging through an illuminated configuration of fixed wavelength pulse lasers. Many fluorescence proteins and fluorophores used for biomedical studies have demonstrated the specific spectra of multiphoton absorption.25–30 The highly efficient MPE of fluorophores proves the superior SNR of MPE imaging, which is critical for deep imaging.31–33 Although the fluorescent excitation of two different fluorophores with overlapping two-photon absorption spectra using conventional TFMPEM with a single excitation wavelength can be achieved, the selection of fluorophores for biomedical applications is restricted.24 In spatial-focusing-only MPE microscopy using galvo scanners to map MPE fluorescence images, matching the maximum multiphoton absorption wavelength of different fluorophores is straightforward through adjustment of the incident wavelength of ultrafast pulse lasers, such as the mode-locked ultrafast Ti:sapphire pulse laser, the supercontinuum pulse laser, and the tunable ultrafast pulse fiber laser.31,34–36 However, adjusting the incident wavelength of TFMPEM in real time to obtain the optimum efficiency of MPE is difficult because of the use of a diffraction device, such as an optical diffuser,37 a diffraction grating,6–12,20,21,24 a dual-prism grating,38 or a DMD,14,17,22,23 which separates the frequencies of incident pulse at different diffraction angles. Therefore, TFMPEM with tunable wavelength excitation was implemented using an optical setup to automatically vary the incident angle of the ultrafast pulse light source at the diffraction grating depending on its central wavelength in this study. Moreover, the proposed system was used to visualize two-photon excitation (TPE) fluorescent section images of the Hela cell cytoskeleton and mouse muscle fibers through fast tunable-wavelength excitation. Furthermore, the intensity enhancement of a two-color TPE fluorescence image of multifluorophore-labeled specimens through optimum wavelength excitation in the fast tunable-wavelength excitation TFMPEM system was demonstrated. 2.Materials and Methods2.1.Sample PreparationTo fabricate a rhodamine 6G thin film, a polymethylmethacrylate solution doped with rhodamine 6G (Sigma) was spin-coated on glass cover slips at 6000 rpm for 60 s and baked in an oven at 120°C for 15 min. The thickness of the rhodamine 6G thin film was less than 200 nm.11 Mouse muscle specimens were permeabilized using 0.1% Triton X-100 in phosphate-buffered saline (PBS) buffer for 10 min. After the specimens were washed three times with PBS buffer, a diluted solution of Alexa Fluor 488-labeled phalloidin (Invitrogen) with a dilution of 100 was added to the specimens to stain the actin. After 2 h of incubation, the mouse muscle specimens were washed three times with a PBS solution with 0.05% Tween 20 (Sigma). The mouse muscle specimens were then used to obtain two photon fluorescence images of muscle fiber. The preparation of mouse specimens was approved by the Institutional Animal Care and Use Committee, National Central University, Taiwan. Hela cells were seeded on cover slips using Dulbecco’s modified Eagle’s medium (Gibco) supplemented with 10% (v/v) fetal bovine serum that contained 1.0-mM sodium pyruvate, 0.1-mM nonessential amino acids, 1.5-g/L sodium bicarbonate, and 2-mM l-glutamine. The cells were incubated at 37°C in 5% . After 24 h of incubation, some Hela cell specimens were fixed using 4% paraformaldehyde for immunofluorescence staining, and the other Hela cell specimens were retained to transfect the fluorescence protein. Hela cells were transfected with an enhanced green fluorescent protein (EGFP), which was fused with a cytoskeleton protein, actin. For the transfection process, a solution that contained of actin-EGFP plasmid DNA, of lipofectamine 2000 (Thermo), and of Opti-MEM (Thermo) was added to the Hela cells. After 48 h of incubation, the transfected Hela cell specimens were also fixed using 4% paraformaldehyde for the subsequent immunofluorescence staining. The tubulin of Hela cells was stained using a primary antibody against tubulin (; Sigma) and secondary antibodies labeled with Alexa Fluor 568 (Invitrogen). The mitochondria of transfected Hela cells were stained with a primary antibody against mitochondria (; Abcam) and secondary antibodies labeled with Alexa Fluor 568. Finally, antibodies exhibiting nonspecific binding were washed out using the PBS solution. 2.2.Optical System SetupThe configuration of the whole optical system setup is shown in Fig. 1(a). The excitation laser source is the mode-locked ultrafast Ti:sapphire laser (Chameleon version II, Coherent), which features a pulse width of 140 fs, a beam size of , a repetition rate of 80 MHz, and a wavelength tuning range of 680 to 1080 nm. A half-wave plate (Newport), which is mounted on the rotation stage, and a linear polarizer (Newport) are used to adjust the laser power. The power density of the excitation laser at the specimens was ; such a high power density was used to ensure that the TPE fluorescence intensity of the fluorophores at each excitation wavelength was adequate for recording the wavelength response of the TPE fluorescence intensity of fluorophores. For imaging, the power density at the specimens labeled using Alexa Fluor 568 can be decreased to through the optimum wavelength excitation of fluorophores. The excitation light passes through the beam expander and tunes the propagation angle of light for the excitation wavelengths from 770 to 920 nm as shown in Fig. 1(b). A detailed description of the variation of the propagation angle of light follows in Sec. 2.3. The first-order diffraction light is generated by illumination on an grating at the same position for different wavelengths. Consequently, the light passes through a lens system and an upright optical microscope (Olympus) combined with a water-immersion objective ( PlanApo, Olympus) featuring a numerical aperture of 1.2 to excite the fluorescence signal of specimens. The fluorescence signals of the multiphoton images were collected for the same objective and reflected by a multiphoton single-edge dichroic beamsplitter (FF705-Di01-25x36, Semrock). After the fluorescence signal passed through an imaging lens (, Thorlabs), the signal was filtered using an emission filter wheel featuring two bandpass filters (FF01-525/45-25 and FF01-585/40-25, semrock) and imaged on an EMCCD camera (iXon Ultra 897, Andor). To obtain 3-D images, the specimen was moved along the -axis using a motorized focus stage (Prior Scientific). These motion devices were all synchronized with a data acquisition card and a custom LabVIEW program interface, which controlled the center wavelength of the excitation light, the shutter, the rotation stage (Newport) for adjusting laser power, the linear motion stage (Throlabs) for varying the incident angle of light on the grating, the filter wheel for changing the emission filter, the motorized focus stage, and the EMCCD cameras for capturing the sequential section multiphoton fluorescence images at different depths and excitation wavelengths. The system can record 3-D image stacks at each excitation wavelength, and the excitation wavelength-scanned image stacks at the same position. 2.3.Design of the Tunable Wavelength in the Imaging SystemIn TFMPEM, the excitation light is diffracted by the diffraction component and illuminated on the sample plane after passing thorough the collimating and objective lenses of a system. The spatially separated excitation lights, after passing through the diffraction component, must be recombined and in phase at the focal plane of objective lens to excite multiphoton fluorescence, and the diffracted light of the center frequency of the light source follows the optical axis of the system. To implement TFMPEM with the capability of fast excitation wavelength tuning, the optical components should be moved to ensure that the diffracted light of the center frequency of the light source can follow the optical axis of the following system because the diffraction angle is a function of the wavelength of the excitation light. This can be achieved through two general approaches: (1) rotate the optical axis of the system according to the central frequency of the light source or (2) rotate the diffracted light according to the fixed optical axis of the system. The first approach is complicated because the collimating lens and all components of the microscope, including the dichroic mirror, objective lens, specimen, and camera, must be rotated. In the second approach, the diffraction component can be mounted on a rotation stage and rotated to ensure that the diffracted light is along the fixed optical axis of the system. However, the illumination plane of the recombined excitation lights is conjugated to the diffraction plane of the diffraction component; therefore, rotating the diffraction component induces a tilt angle between the illumination plane of the recombined excitation lights and the focal plane of the objective lens. This approach causes mismatch between the excitation plane of the TPE and the collection plane of the objective lens. An alternative method is to rotate the incident angle on the fixed diffraction component to ensure that the diffraction angle is along the fixed optical axis of the system. In this approach, the region projected on the fixed diffraction component must be the same for different wavelengths because it conjugates with the excitation plane. Accordingly, we developed an optical system in which a motorized linear stage is combined with a beam expander to adjust the angle of incidence on the diffraction device in TFMPEM. The mechanism of the optical system that adjusts the propagation angle of light for different excitation wavelengths was demonstrated [Fig. 1(b)]. The following concerns were considered for the selection of optical devices in the proposed TFMPEM. First, the diffraction component of a temporal focusing system can be utilized to diffract the frequencies of excitation light at different spatial angles. In this study, we used the grating as the diffraction component. The different frequencies of excitation light were recombined and overlapped in phase at the focal plane. The plane area for the MPE can be obtained through temporal focusing. Consequentially, the excitation light in the proposed TFMPEM was considered for different central wavelengths. On the basis of the concept of the temporal focusing system, the incident angle on the diffraction device plays an important role for the fast tuning excitation wavelength. The diffraction equation of the grating can be expressed as39 where is an integer and the diffraction order, is the central wavelength of the ultrafast laser, is the effective pitch of the grating, is the incident angle, and is the diffraction angle at the th-order diffraction. In the setup of the proposed system, the direction of the first-order diffracted light () is set at 0 deg (i.e., ) to ensure that the beam is spatially dispersed with the central frequency traveling along the optical axis of the following system despite changes in wavelength. The incident angle must be adjusted for the different central wavelengths of the laser according to the diffraction equation, and the incident angle is rewritten asFor the different groove densities of the grating, the incident angle at the central wavelengths from 700 to 1000 nm is shown in Fig. 2(a). The results indicated that the incident angle increased as the groove density increased. The incident angle for the groove densities of 600 and 830 () was from 24.8 deg to 36.9 deg and from 35.2 deg to 56.1 deg at the central wavelengths from 700 to 1000 nm, respectively. The case of a grating does not cover all the central wavelengths; there is only a small tunable range of the central wavelength, which is from 700 to 835 nm. Moreover, the axial resolution of TFMPEM can be expressed as40,41 where is the Rayleigh length of the focused spatially chirped beam, is the focal length of the objective, is wavevector, and are the monochromatic and full frequency spectrum spot sizes at the back focal plane of the objective. The constant is proportional to the focal length of the collimating lens and the groove density of grating. Assume that the focal length of the collimating lens is constant. According to Eq. (3), the higher groove density of grating increases the value of to provide the better confinement of axial excitation. Considering a trade-off between the tunable wavelength range and axial resolution of TFMPEM, the groove density of 830 () is used in this study.Fig. 2(a) Incident angles for the different central wavelengths of the laser for maintaining the first-order diffracted light with a diffraction angle of 0 deg for three conditions of the groove density of the grating. (b) Variation of the incident angle of the light source on the grating as a function of the shift of the focusing position of the first lens for three focal lengths of the second lens. (c) Simulated light propagation path for the excitation wavelengths from 770 to 920 nm.  Second, the excitation beam should illuminate the same position on the grating for the different wavelengths with their specific incident angles according to the preceding calculation. Thus, the grating is placed at the focal plane of the second lens of the beam expander in the optical system. The collimated expanded beam could illuminate the grating at a specific incident angle after it passed the second lens, when the focusing position of the first lens demonstrates a small shift, as shown in Fig. 1(b). Here, the incident angle of the excitation beam on the grating could be varied by controlling the shift of the first lens and maintaining the same illuminated position and diffraction angle on the grating for the different central wavelengths. Third, the variation amount of the incident angle caused by the shift of this focusing position was evaluated. The relation between the angle change, , of the output beam of the second lens and the shifting position, , of the first lens is expressed as where is the focal length of the second lens of the beam expander. Figure 2(b) shows that the amounts of angle change were 14.48 deg, 9.59 deg, and 7.18 deg after the first lens with a focal length of 40 mm was shifted to a focusing position of 25 mm for focal lengths of the second lens of 100, 150, and 200 mm, respectively. In our practice system, the initial settings of the excitation light were a central wavelength of 920 nm and alignment along the optical axis with the incident angle of as shown in Fig. 1(b). Furthermore, by combining Eqs. (2) and (4), the shifting distant for a central wavelength, , could be expressed asWe considered a laser with an initial beam size of 3 mm that passed through the first lens with a focal length of 40 mm. Moreover, we assumed that the second lens had a focal length and diameter of 100 and 50 mm, respectively. The divergence angle of the beam between the focusing positions of the first lens and the second lens was estimated at 2.147 deg. The maximum acceptable shift of the first lens on the motion stage was then determined. Furthermore, the optical path for an grating was simulated [Fig. 2(c)]. The presented optical system, which eliminates the mismatch between the excitation plane of the TPE and the collection plane of the objective lens, illuminates the same illumination position on the grating for different wavelengths. It uses a simple approach wherein the shift of the first lens of the beam expander is controlled for TFMPEM with excitation wavelength tuning. Moreover, the maximum and minimum efficiencies of the excitation light diffracted through the diffraction grating in the excitation wavelength tuning system were 65% and 59.6%, respectively, as the wavelength was varied from 770 to 920 nm. This tendency is consistent with the grating specifications. Therefore, the excitation power necessary to illuminate the specimens can be maintained by rotating the half-wave plate to adjust the incident power at each wavelength according to the characteristic efficiency of the diffraction grating. Thus, TFMPEM with a tunable wavelength range from 770 to 920 nm and the same illuminated position on the grating was demonstrated. 3.Experimental Results and Discussion3.1.Axial Resolution at Different Excitation WavelengthsTo determine the capability of axial sectioning at different wavelengths, a rhodamine 6G thin film with a thickness of less than 200 nm was examined. For temporal focusing excitation with wavelength scanning, the system was capable of axial sectioning and providing the same excited plane of the specimen at different laser wavelengths. Here, the rhodamine 6G thin film was axially scanned with a range of and a step size of using the motorized focus stage. Figure 3(a) shows the axial intensity profiles of TPE fluorescence of the rhodamine 6G thin film with the excitation wavelengths from 770 to 920 nm and a wavelength shift of 50 nm. Fig. 3(a) Axial normalized TPE fluorescence intensity profiles of the thin fluorescent film with excitation wavelengths from 770 to 920 nm and a wavelength shift of 10 nm. (b) Axial shift of the temporal focal plane position at the different wavelengths. 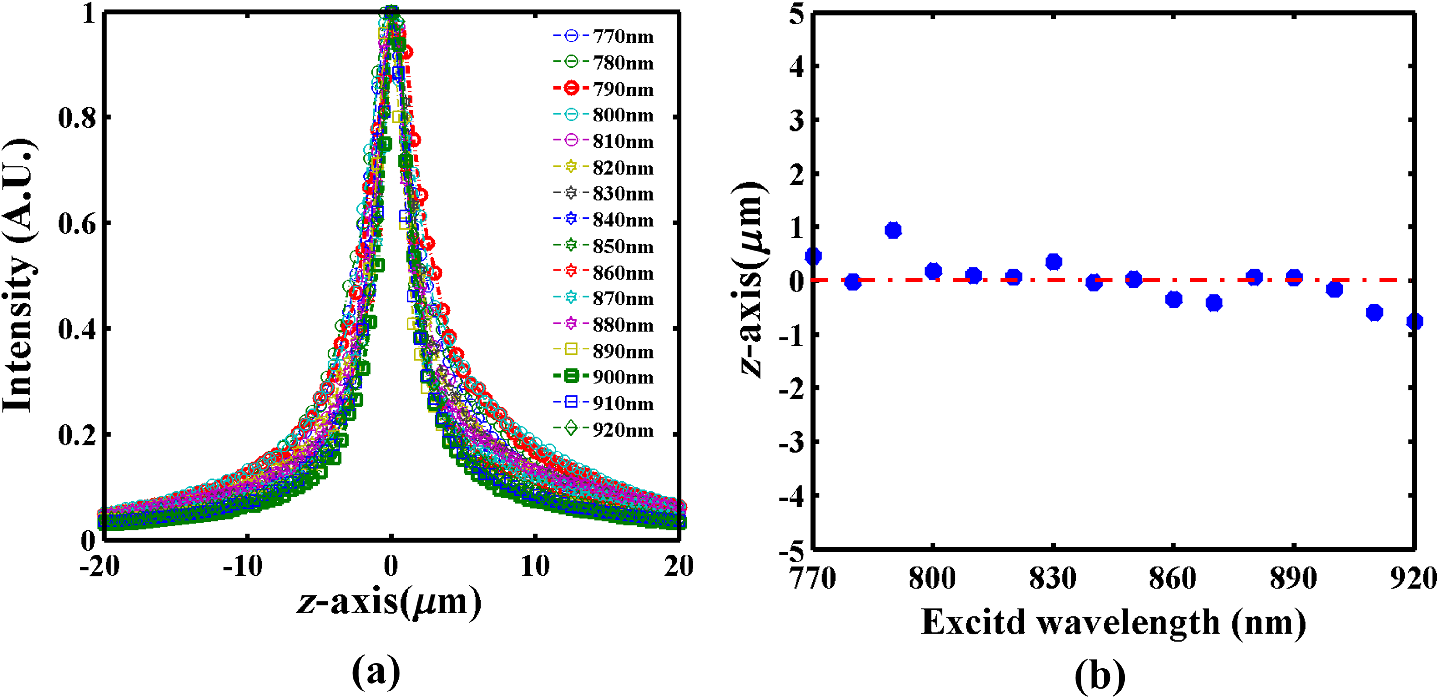 Examination of the full width at half maximum of the normalized intensity profile revealed that the width of axial confined excitation was for this wavelength range. This finding indicates that TFMPEM has axial sectioning capability at each wavelength. As shown in the axial intensity profiles in Fig. 3(a), we extracted the peak position of the intensity profile to determine the position of the focal plane at every excitation wavelength. The amount of axial shifting of the temporal focal plane at the different wavelengths is illustrated in Fig. 3(b). On the basis of a previous study, the temporal focal plane can be shifted axially by tuning the group velocity dispersion in the excitation path.9 Consequently, the variation in the temporal focal plane may be induced by the group velocity dispersion effect of the system. However, the shift of the temporal focal plane was less than . Therefore, the system provides the capability to illuminate the same excitation area at a specific section within the specimen and to achieve wavelength-scanned excitation. 3.2.Two-Photon Fluorescence Images with the Multiple-Wavelength ExcitationWe first present the multiple-wavelength excitation for TFMPEM in TPE fluorescence imaging of the mouse muscle fibers stained with Alexa Fluor 488-labeled phalloidin. Figure 4(a) illustrates the optical section imaging results at the same depth of mouse muscle fibers at every excitation wavelength with a wavelength shift of 20 nm in a wavelength range from 770 to 920 nm. The image intensities shown in Fig. 4(a) are the raw values of the fluorescence signals. For clarity, the contrast of the insets in the results for the excitation wavelengths from 810 to 910 nm in Fig. 4(a) was enhanced by approximately ninefold to reveal differences in morphology. The results indicated that the maximum fluorescence intensity and more favorable contrast of the mouse muscle fiber images were achieved using the excitation wavelength of 770 nm. Thus, to obtain higher quality in 3-D imaging, the excitation wavelength of 770 nm was used. The section images of the mouse muscle fibers at every position with a step shift of for visualizing their morphology and distribution are shown in Fig. 4(b). Moreover, TPE fluorescence images of the Hela cell tubules labeled using Alexa Fluor 568 were captured at different excitation wavelengths. The maximum excitation efficiency of TPE fluorescence was realized at an excitation wavelength of 790 nm, as shown in the inset of Fig. 4(c). Furthermore, Fig. 4(c) presents the intensity profiles of the TPE fluorescence signals along the yellow dashed line in the inset. Comparison of the intensity profiles through the different excitation wavelengths shows that the proposed system provides an approach that improves the contrast of TFMPEM images by selecting the optimized excitation wavelength to match the superior excitation efficiency of fluorophores. Fig. 4Widefield TPE fluorescence images of the muscle fibers stained with Alexa Fluor 488-labeled phalloidin at (a) different excitation wavelengths, (b) different depths with an excitation wavelength of 770 nm. (c) The fluorescence intensity profiles of the Hela cell tubules stained with Alexa Fluor 568 along the yellow dashed line of inset image for the different excitation wavelengths. Scale bars, . 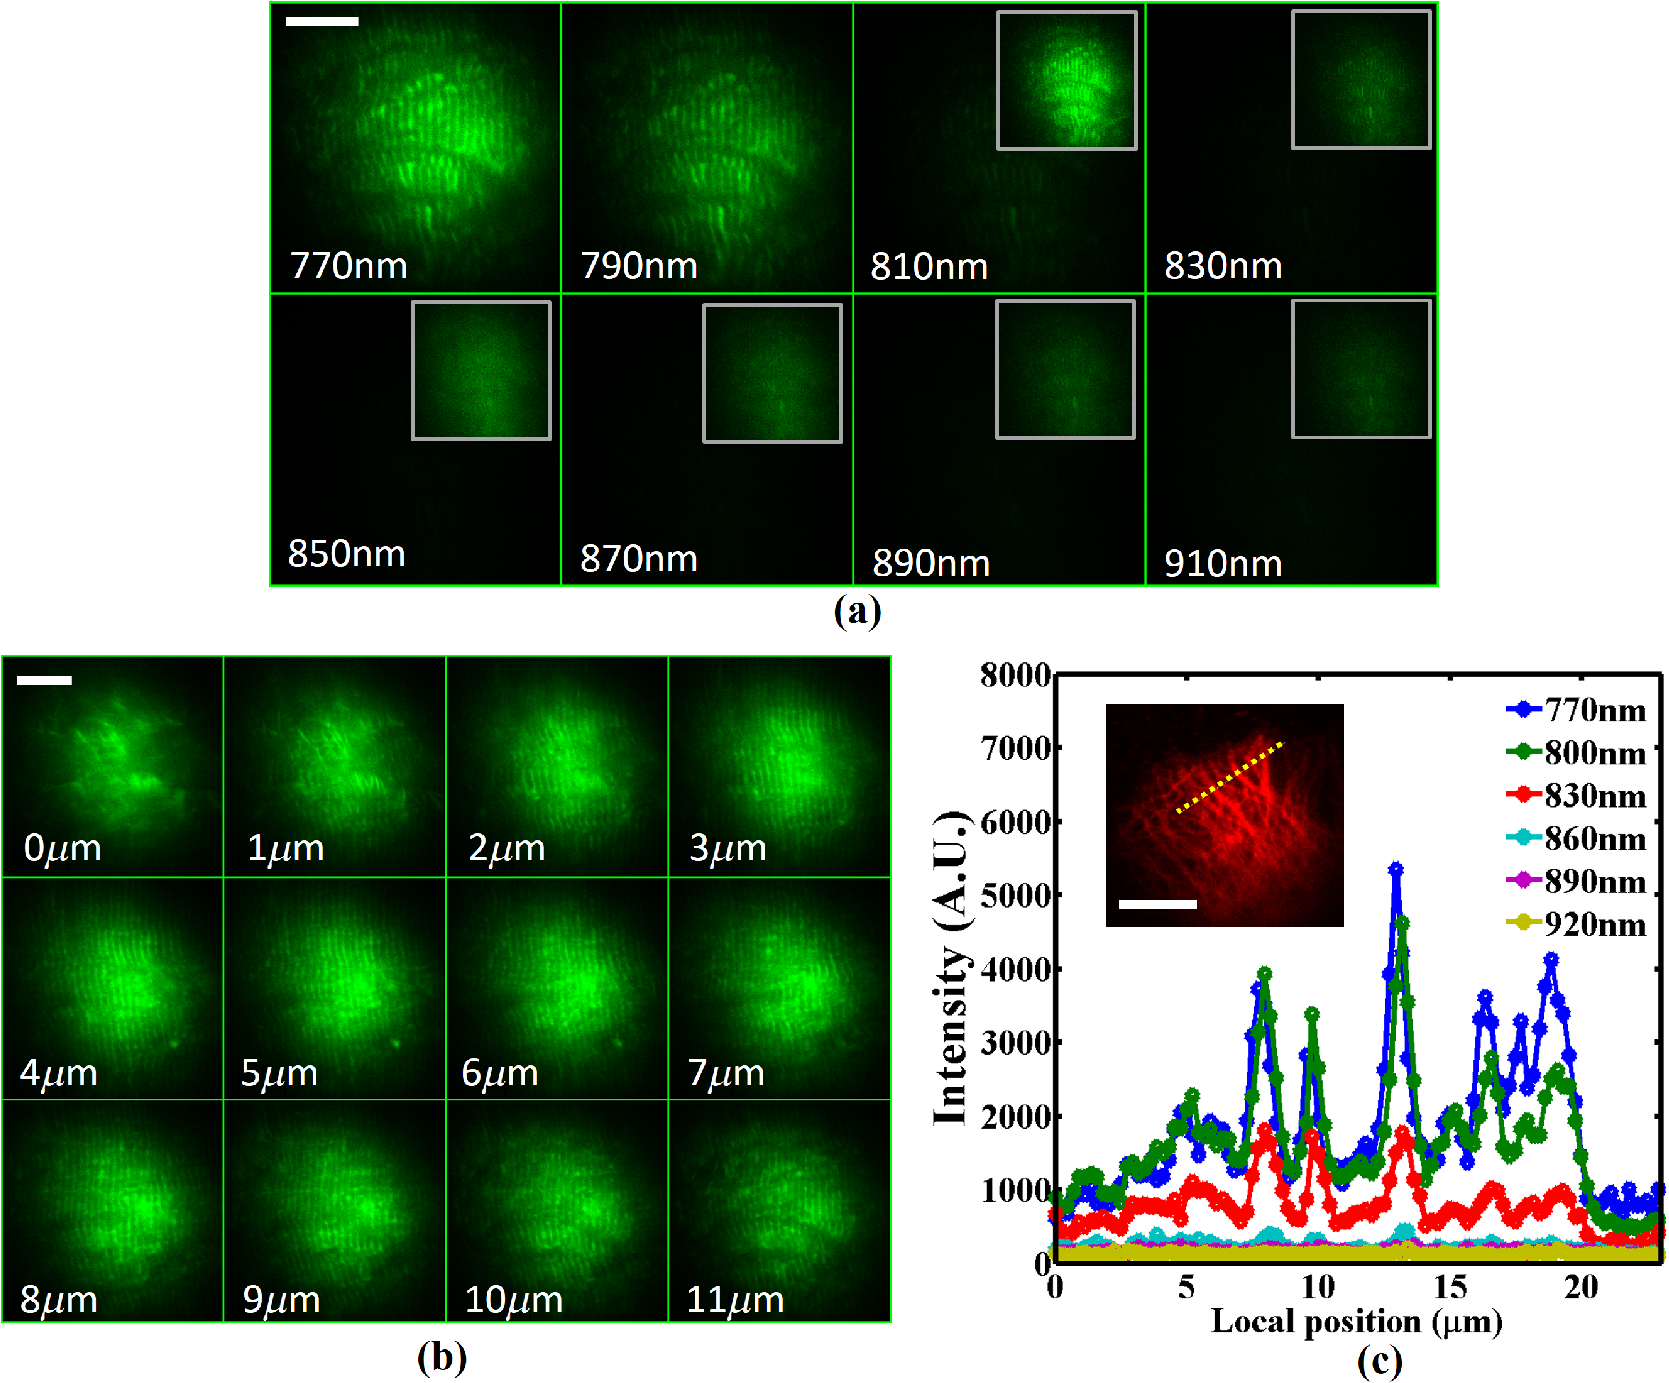 3.3.Intensity Enhancement of TPE Fluorescence Images of Two Types of Fluorophore-Labeled Specimens by Wavelength Selection ExcitationTo demonstrate the capacity of the proposed TFMPEM system for improving the quality of images in multifluorophore-labeled specimen measurements using wavelength selection excitation, the system was used to visualize the TPE fluorescence images of the mitochondria stained with Alexa Fluor 568 and the actin filaments labeled with EGFP in Hela cells. Figure 5 illustrates the merged section images of the mitochondria (labeled red) and the actin filaments (labeled green) at every excitation wavelength with a wavelength shift of 10 nm in a wavelength range from 770 to 920 nm. These fluorescence data of mitochondria and actin were recorded with exposure times of 0.1 and 4 s by switching the emission filter in front of the camera at every excitation wavelength. The fluorescence intensity of the mitochondria is clearly superior at an excitation wavelength of 790 nm, but the fluorescence intensity of the actin filaments is superior at an excitation wavelength of 900 nm. The excitation wavelength of the conventional TFMPEM system with a fixed single excitation wavelength for revealing the morphology of the mitochondria and actin filaments with the barely acceptable intensity of two labeled fluorophores simultaneously is 820 nm in Fig. 6(a). To acquire high-contrast merged images, the other approach using our TFMPEM system is shown in Fig. 6(b). On the basis of the results illustrated in Fig. 5, the maximum signals of TPE fluorescence images for the mitochondria with an excitation wavelength of 790 nm and actin filaments with an excitation wavelength of 900 nm are shown in Fig. 6(b). Accordingly, higher-quality merged TPE fluorescence images of the mitochondria and actin filaments can be obtained using wavelength selection excitation. Additionally, according to Figs. 4(a) and 5, the normalized TPE fluorescence intensity of Alexa Fluor 488, Alexa Fluor 568, and EGFP from the TPE fluorescence images of the muscle fibers, the mitochondria, and the actin filaments with excitation wavelengths from 770 to 920 nm was determined as shown in Fig. 7. The results indicate that the wavelength response of the normalized TPE fluorescence intensity of fluorophores is similar to that of the two-photon absorption of fluorophores in previous works.29,42–44 Fig. 5Section TPE fluorescence images of mitochondria (red) and actin filaments (green) of Hela cells with TPE wavelengths from 770 to 920 nm and a wavelength shift of 10 nm. The mitochondria and actin filaments were labeled with Alexa Fluor 568 and EGFP. Scale bar, .  Fig. 6Merged TPE fluorescence images of mitochondria (red) and actin filaments (green) (a) with an excitation wavelength of 820 nm and (b) with an excitation wavelength of 790 nm for mitochondria and with an excitation wavelength of 900 nm for actin filaments in Hela cells. (c) Bright field image. Scale bar, .  4.ConclusionsA proposed approach for fast wavelength scanning TFMPEM imaging can successfully obtain multiwavelength-excited and 3-D rendered fluorescence images of fluorescence-labeled biosamples. We present an approach for achieving fast TFMPEM wavelength scanning. The ultrafast pulse source with different central wavelengths generated from the mode-locked ultrafast Ti:sapphire laser changed the illuminated angle and maintained the same illumination position and diffraction angle on the diffraction grating to enable maintaining the same optical path after passing through the diffraction grating. Furthermore, the tunable-wavelength range, which depended on the groove density of the grating, the diffraction angle, the focal length of lenses, and the shifting distance of the first lens, was estimated. Because of the trade-off between the tunable-wavelength range and axial resolution of temporal focusing MPE imaging, a wavelength scanning range from 770 to 920 nm was implemented in this study. Moreover, a width of the axial confined excitation of and a shifting distance of the temporal focal plane of less than were demonstrated. In TFMPEM imaging of the Hela cell mitochondria and cytoskeleton and mouse muscle fibers, the proposed system can achieve the fast different wavelength excitation and 3-D imaging. The results of wavelength scanning excitation in multifluorophore-labeled specimen measurement show that the proposed system provides an approach for enhancing the fluorescent signals and improving the imaging quality of two-color TFMPEM by exciting the wavelength with the maximum TPE of different fluorophores compared with conventional TFMPEM with a fixed single-wavelength excitation. This presented system is useful for the fast multicolor imaging of temporal focusing MPE microscope in multifluorophore-labeled biosamples. AcknowledgmentsWe thank Prof. Shean-Jen Chen for the critical comments. This work was supported by the Ministry of Science and Technology, Taiwan under grants MOST 105-2112-M-008-007-MY3. ReferencesW. R. Zipfel et al.,
“Nonlinear magic: multiphoton microscopy in the biosciences,”
Nat. Biotechnol., 21
(11), 1369
–1377
(2003). http://dx.doi.org/10.1038/nbt899 NABIF9 1087-0156 Google Scholar
E. E. Hoover et al.,
“Advances in multiphoton microscopy technology,”
Nat. Photonics, 7
(2), 93
–101
(2013). http://dx.doi.org/10.1038/nphoton.2012.361 NPAHBY 1749-4885 Google Scholar
N. G. Horton et al.,
“In vivo three-photon microscopy of subcortical structures within an intact mouse brain,”
Nat. Photonics, 7
(3), 205
–209
(2013). http://dx.doi.org/10.1038/nphoton.2012.336 NPAHBY 1749-4885 Google Scholar
R. Kawakami et al.,
“Visualizing hippocampal neurons with in vivo two-photon microscopy using a 1030 nm picosecond pulse laser,”
Sci. Rep., 3 1014
(2013). http://dx.doi.org/10.1038/srep01014 SRCEC3 2045-2322 Google Scholar
F. Helmchen et al.,
“Deep tissue two-photon microscopy,”
Nat. Methods, 2
(12), 932
–940
(2005). http://dx.doi.org/10.1038/nmeth818 1548-7091 Google Scholar
D. Oron et al.,
“Scanningless depth-resolved microscopy,”
Opt. Express, 13
(5), 1468
–1476
(2005). http://dx.doi.org/10.1364/OPEX.13.001468 OPEXFF 1094-4087 Google Scholar
G. H. Zhu et al.,
“Simultaneous spatial and temporal focusing of femtosecond pulses,”
Opt. Express, 13
(6), 2153
–2159
(2005). http://dx.doi.org/10.1364/OPEX.13.002153 OPEXFF 1094-4087 Google Scholar
M. E. Durst et al.,
“Simultaneous spatial and temporal focusing in nonlinear microscopy,”
Opt. Commun., 281
(7), 1796
–1805
(2008). http://dx.doi.org/10.1016/j.optcom.2007.05.071 OPCOB8 0030-4018 Google Scholar
A. Straub et al.,
“High speed multiphoton axial scanning through an optical fiber in a remotely scanned temporal focusing setup,”
Biomed. Opt. Express, 2
(1), 80
–88
(2011). http://dx.doi.org/10.1364/BOE.2.000080 BOEICL 2156-7085 Google Scholar
A. Vaziri et al.,
“Ultrafast widefield optical sectioning microscopy by multifocal temporal focusing,”
Opt. Express, 18
(19), 19645
(2010). http://dx.doi.org/10.1364/OE.18.019645 OPEXFF 1094-4087 Google Scholar
L.-C. Cheng et al.,
“Spatiotemporal focusing-based widefield multiphoton microscopy for fast optical sectioning,”
Opt. Express, 20
(8), 8939
–8948
(2012). http://dx.doi.org/10.1364/OE.20.008939 OPEXFF 1094-4087 Google Scholar
J. Jiang et al.,
“Fast 3-D temporal focusing microscopy using an electrically tunable lens,”
Opt. Express, 23
(19), 24362
(2015). http://dx.doi.org/10.1364/OE.23.024362 OPEXFF 1094-4087 Google Scholar
P. T. C. So et al.,
“High-throughput nonlinear optical microscopy,”
Biophys. J., 105
(12), 2641
–2654
(2013). http://dx.doi.org/10.1016/j.bpj.2013.08.051 BIOJAU 0006-3495 Google Scholar
C.-Y. Chang et al.,
“Fast volumetric imaging with patterned illumination via digital micro-mirror devicebased temporal focusing multiphoton microscopy,”
Biomed. Opt. Express, 7
(5), 1727
–1736
(2016). http://dx.doi.org/10.1364/BOE.7.001727 BOEICL 2156-7085 Google Scholar
H. Choi et al.,
“Improvement of axial resolution and contrast in temporally focused widefield two-photon microscopy with structured light illumination,”
Biomed. Opt. Express, 4
(7), 995
–1005
(2013). http://dx.doi.org/10.1364/BOE.4.000995 BOEICL 2156-7085 Google Scholar
K. Isobe et al.,
“Enhancement of lateral resolution and optical sectioning capability of two-photon fluorescence microscopy by combining temporal-focusing with structured illumination,”
Biomed. Opt. Express, 4
(11), 2396
–2410
(2013). http://dx.doi.org/10.1364/BOE.4.002396 BOEICL 2156-7085 Google Scholar
L.-C. Cheng et al.,
“Nonlinear structured-illumination enhanced temporal focusing multiphoton excitation microscopy with a digital micromirror device,”
Biomed. Opt. Express, 5
(8), 2526
–2536
(2014). http://dx.doi.org/10.1364/BOE.5.002526 BOEICL 2156-7085 Google Scholar
D. Kim et al.,
“High-throughput three-dimensional lithographic microfabrication,”
Opt. Lett., 35
(10), 1602
–1604
(2010). http://dx.doi.org/10.1364/OL.35.001602 OPLEDP 0146-9592 Google Scholar
E. Papagiakoumou et al.,
“Patterned two-photon illumination by spatiotemporal shaping of ultrashort pulses,”
Opt. Express, 16
(26), 22039
(2008). http://dx.doi.org/10.1364/OE.16.022039 OPEXFF 1094-4087 Google Scholar
O. D. Therrien et al.,
“Wide-field multiphoton imaging of cellular dynamics in thick tissue by temporal focusing and patterned illumination,”
Biomed. Opt. Express, 2
(3), 696
–704
(2011). http://dx.doi.org/10.1364/BOE.2.000696 BOEICL 2156-7085 Google Scholar
E. Papagiakoumou et al.,
“Scanless two-photon excitation of channelrhodopsin-2,”
Nat. Methods, 7
(10), 848
–854
(2010). http://dx.doi.org/10.1038/nmeth.1505 1548-7091 Google Scholar
J. N. Yih et al.,
“Temporal focusing-based multiphoton excitation microscopy via digital micromirror device,”
Opt. Lett., 39
(11), 3134
–3137
(2014). http://dx.doi.org/10.1364/OL.39.003134 OPLEDP 0146-9592 Google Scholar
C.-H. Lien et al.,
“Dynamic particle tracking via temporal focusing multiphoton microscopy with astigmatism imaging,”
Opt. Express, 22
(22), 27290
(2014). http://dx.doi.org/10.1364/OE.22.027290 OPEXFF 1094-4087 Google Scholar
F.-C. Chien et al.,
“Dual-color dynamic tracking of GM-CSF receptors/JAK2 kinases signaling activation using temporal focusing multiphoton fluorescence excitation and astigmatic imaging,”
Opt. Express, 23
(24), 30943
(2015). http://dx.doi.org/10.1364/OE.23.030943 OPEXFF 1094-4087 Google Scholar
C. Xu et al.,
“Measurement of two-photon excitation cross sections of molecular fluorophores with data from 690 to 1050 nm,”
J. Opt. Soc. Am. B, 13
(3), 481
–491
(1996). http://dx.doi.org/10.1364/JOSAB.13.000481 JOBPDE 0740-3224 Google Scholar
M. A. Albota et al.,
“Two-photon fluorescence excitation cross sections of biomolecular probes from 690 to 960 nm,”
Appl. Opt., 37
(31), 7352
–7356
(1998). http://dx.doi.org/10.1364/AO.37.007352 APOPAI 0003-6935 Google Scholar
N. S. Makarov et al.,
“Two-photon absorption standards in the 550–1600 nm excitation wavelength range,”
Opt. Express, 16
(6), 4029
–4047
(2008). http://dx.doi.org/10.1364/OE.16.004029 OPEXFF 1094-4087 Google Scholar
M. Drobizhev et al.,
“Absolute two-photon absorption spectra and two-photon brightness of orange and red fluorescentproteins,”
J. Phys. Chem. B, 113
(4), 855
–859
(2009). http://dx.doi.org/10.1021/jp8087379 JPCBFK 1520-6106 Google Scholar
M. Drobizhev et al.,
“Two-photon absorption properties of fluorescent proteins,”
Nat. Methods, 8
(5), 393
–399
(2011). http://dx.doi.org/10.1038/nmeth.1596 1548-7091 Google Scholar
L.-C. Cheng et al.,
“Measurements of multiphoton action cross sections for multiphoton microscopy,”
Biomed. Opt. Express, 5
(10), 3427
–3433
(2014). http://dx.doi.org/10.1364/BOE.5.003427 BOEICL 2156-7085 Google Scholar
J. R. Unruh et al.,
“Two-photon microscopy with wavelength switchable fiber laser excitation,”
Opt. Express, 14
(21), 9825
–9831
(2006). http://dx.doi.org/10.1364/OE.14.009825 OPEXFF 1094-4087 Google Scholar
D. Kobat et al.,
“In vivo two-photon microscopy to 1.6-mm depth in mouse cortex,”
J. Biomed. Opt., 16
(10), 106014
(2011). http://dx.doi.org/10.1117/1.3646209 JBOPFO 1083-3668 Google Scholar
C.-Y. Chang et al.,
“Wavefront sensorless adaptive optics temporal focusing-based multiphoton microscopy,”
Biomed. Opt. Express, 5
(6), 1768
–1777
(2014). http://dx.doi.org/10.1364/BOE.5.001768 BOEICL 2156-7085 Google Scholar
D. Entenberg et al.,
“Setup and use of a two-laser multiphoton microscope for multichannel intravital fluorescence imaging,”
Nat. Protoc., 6
(10), 1500
–1520
(2011). http://dx.doi.org/10.1038/nprot.2011.376 1754-2189 Google Scholar
C. Xu et al.,
“Recent advances in fibre lasers for nonlinear microscopy,”
Nat. Photonics, 7
(11), 875
–882
(2013). http://dx.doi.org/10.1038/nphoton.2013.284 NPAHBY 1749-4885 Google Scholar
K. Wang et al.,
“Three-color femtosecond source for simultaneous excitation of three fluorescent proteins in two-photon fluorescence microscopy,”
Biomed. Opt. Express, 3
(9), 1927
–1977
(2014). http://dx.doi.org/10.1364/BOE.3.001972 BOEICL 2156-7085 Google Scholar
J.-Y. Yu et al.,
“Wide-field optical sectioning for live-tissue imaging by plane-projection multiphoton microscopy,”
J. Biomed. Opt., 16
(11), 116009
(2011). http://dx.doi.org/10.1117/1.3647570 JBOPFO 1083-3668 Google Scholar
H. Dana et al.,
“Remotely scanned multiphoton temporal focusing by axial grism scanning,”
Opt. Lett., 37
(14), 2913
–2915
(2012). http://dx.doi.org/10.1364/OL.37.002913 OPLEDP 0146-9592 Google Scholar
M. C. Hutley, Diffraction Gratings, Academic Press, London
(1982). Google Scholar
M. E. Durst et al.,
“Simultaneous spatial and temporal focusing for axial scanning,”
Opt. Express, 14
(25), 12243
(2006). http://dx.doi.org/10.1364/OE.14.012243 OPEXFF 1094-4087 Google Scholar
A. Straub et al.,
“High speed multiphoton axial scanning through an optical fiber in a remotely scanned temporal focusing setup,”
Biomed. Opt. Express, 2
(1), 80
–88
(2010). http://dx.doi.org/10.1364/BOE.2.000080 BOEICL 2156-7085 Google Scholar
A. Diaspro et al.,
“Two-photon fluorescence excitation and related techniques in biological microscopy,”
Q. Rev. Biophys., 38
(2), 97
–166
(2005). http://dx.doi.org/10.1017/S0033583505004129 QURBAW 0033-5835 Google Scholar
H. Hosoi et al.,
“Hidden electronic excited state of enhanced green fluorescent protein,”
J. Phys. Chem. B, 112
(10), 2761
–2763
(2008). http://dx.doi.org/10.1021/jp711628u JPCBFK 1520-6106 Google Scholar
J. Mütze et al.,
“Excitation spectra and brightness optimization of two-photon excited probes,”
Biophys. J., 102
(4), 934
–944
(2012). http://dx.doi.org/10.1016/j.bpj.2011.12.056 BIOJAU 0006-3495 Google Scholar
|


