
|
|
1.IntroductionDiffused optical spectroscopy and tomography (DOS and DOT) techniques have been investigated extensively in the past two decades for their utility in breast cancer diagnosis and treatment monitoring.1–8 One critical parameter in breast tissue characterization is the normal tissue optical properties. Different DOS or DOT systems using continuous-wave (CW), frequency-domain (FD), and time-resolved (TR) methods have been used to measure bulk tissue optical properties of normal breast. Depending on the experimental set-up, patients were measured in three positions: (1) a supine or sitting position with a hand-held probe placed on top of the examined breast, referred to as FD reflectance or TR reflectance measurement;9–12 (2) a prone position with source and detector fibers distributed around the examined breast, referred to as mixed CW, FD, or TR reflectance and transmittance measurement or ring geometry;3,13,14 and (3) a prone or a standing position with the examined breast sandwiched between source and detector plates, referred to as FD transmittance or TR reflectance or transmittance measurement.15–21 In these studies, the measured breast tissue bulk optical absorption coefficient and the reduced scattering coefficient were reported (see Table 1). In some studies, the patients’ race, which affects measured optical or physical properties, was also investigated.2,13,22 Table 1Comparison of reported optical parameters for normal breast at NIR.
aMethod: Measurement techniques that were used. CW, continuous wave; FD, frequency domain; TR, time-resolved. Using the CW method with a ring geometry, Jiang et al. measured the breast tissue background optical properties ( and ) of three healthy volunteers and the normal breast tissue adjacent to a lesion in six patients.13 The patients’ race was not found to affect measured optical properties. The and measured from breast tissue adjacent to the lesion were 0.072 to and 7.5 to , which were comparable to those from the healthy volunteers of to and to . Using an FD reflectance with patients in a supine position, Shah et al. measured breast tissue optical properties of 14 healthy subjects.9 A significant difference was found between the pre- and postmenopausal subjects (premenopausal: to and to and postmenopausal: to and to ). Using the same technique, Cerussi et al. measured breast optical properties of 28 healthy subjects.10 They found the hemoglobin, water, and scatter power were on a decreasing trend with age for subjects older than 50. They also found the scatter power correlated with water concentration, and correlated negatively with lipid. Using an FD transmittance geometry, Durduran et al. measured the optical properties of 52 healthy volunteers.16 Investigation was focused on the correlation of optical properties, blood volume, and oxygen saturation () with the body mass index (BMI) and age, and only a weak correlation was found between blood volume and BMI, and and BMI. By using an FD system with a ring geometry, Poplack and Pogue et al. first measured 11 patients and later 23 healthy volunteers’ breasts at five wavelengths within 660 to 808 nm.3,23 The total hemoglobin (tHb) and were found to be significantly associated with the BMI and breast density, but no significant association was found between and either BMI or breast density. Recently, Fang et al. measured the optical properties of 68 breasts from 49 healthy volunteers and later 138 normal breasts from 125 subjects using a hybrid CW/FD DOT system with a transmittance geometry. Their study was focused on comparing the DOT measurements of hemoglobin and scattering maps with coregistered x-ray images of different categories of breast tissues.20,21 By utilizing the TR reflectance method with a single wavelength and a single source and detector pair, Suzuki et al. studied 30 healthy Japanese volunteers and found a high correlation of the breast tissue and with age, BMI, and menstrual status.15 Later, Svensson et al. used a portable TR system to study water, lipid, and hemoglobin concentration variations of 36 normal subjects.11 Their results also showed that larger source and detector separation (2 versus 1.5 cm) resulted in higher tHb and values measured. Using a similar method, Mo et al. measured breast optical properties of 19 healthy Singapore women, and reported high correlations of tissue , , and tHb with age, menopausal status, and BMI.12 Grosenick et al. developed a TR transmittance system using a single-fiber for delivery and a single fiber-bundle for collecting setup to measure breast tissue optical properties of 35 patients and later 87 patients with lesions.17,18 The tHb concentration and were also studied by comparing tumor and background tissues. Using a similar method, Spinelli et al. reported the tHb, , lipid, and water concentration from absorption spectrum of 113 measurements from both breasts of 150 subjects.19,24 Correlations of these physiological properties with age, breast thickness, and BMI were found. We have developed an ultrasound (US)-guided FD-DOT technique using a hybrid hand-held probe for breast cancer diagnosis and treatment assessment within the wavelength range used by other groups as summarized in Table 1.7,8,25 From measured light reflectance, lesion optical absorption maps at four optical wavelengths were reconstructed and the hemoglobin concentration maps of tHb, oxygenated hemoglobin (), and deoxygenated-hemoglobin (Hb) were calculated.26 Results have shown higher sensitivity and specificity in diagnosing early stage (Tis-T1) breast cancers from benign lesions.26 Compared with the systems developed by other groups, our system using a hand-held probe with patients imaged in a supine position can be easily incorporated into a conventional US pulse-echo scanning with no need to adjust the probe size to fit a patient’s breast. However, to probe breast lesions in the depth range of 1 to 4 cm, the source-to-detector separation of 3 to 8 cm is needed. At this range of source-to-detector separations, the chest wall affects measurements of background tissue optical properties.27,28 We have developed several methods to minimize the chest wall effect, including a two-layer modeling29 and a two-layer reconstruction method,30 and a two-step fitting and reconstruction with a dual-probe measurements (a small probe for the first layer and a larger probe for both layers).31 Despite the promising results, the clinical application of these methods is limited due to their intense computation and a slower convergence rate.29,31 In a recent paper, Yoshizawa et al. reported the effect of chest wall on light reflectance measurements using their TR-DOS system with a 3 cm source-to-detector distance, and showed a function characterizing the tHb concentration in terms of chest wall depth.32 Based on their measurements, they reported the tHb concentration ranging between 10 and , and this range reduced to 10 to by taking out cases whose chest wall depths were smaller than 2 cm. In this study, we have evaluated the correlation between the fitted background tissue optical properties and the chest wall depth from 297 patients measured with our FD-DOT system. The background optical properties were measured from the contralateral reference breast at the mirror position of the lesion. To the best of our knowledge, our study has the largest patient population and diverse lesion types and the results will be a valuable reference for the research community in DOS and DOT breast imaging field. We have also developed an automated chest wall depth detection algorithm from coregistered US images to compute the chest wall depth for each patient and validated the depth by an expert with US images. This algorithm not only allows us to automatically estimate the chest wall depth of this large patient database but also provides a valuable tool to guide operators to match the chest wall depth from both lesion and reference breast to produce the best imaging reconstruction results. Since chest walls appear as linear structures in coregistered breast US images, a Hough transform based on structure segmentation using a Gabor filter is applied together with simple edge detection and denoising techniques to automatically detect chest wall depth.33–37 Using the lesion tHb values reported in Ref. 26, we have subtracted the background hemoglobin level from each patient’s tHb to improve the diagnosis between malignant and benign lesions. 2.Materials and Methods2.1.Study SubjectsA total of 297 female patients were evaluated in this study. All patients signed the informed consent and the protocol was approved by local Institution Review Boards. The data reported in this study were deidentified according to the institution approved protocols. The characteristics of study subjects can be found in Ref. 26. Briefly, from the total of 300 female patients included for analysis in the referenced study, three patients were further excluded because digital coregistered US images were not available. Of the 297 patients used for analysis in this study, 12 individuals with no US identifiable lesions at the time of the DOT study were taken as a control. Of the rest, six patients have two lesions. Thus we have total 285 patients and 291 lesions for analysis (the mean age is 50 years, ranging from 17 to 94 years). Of the investigated lesions, 232 were diagnosed to be benign and 59 were malignant. The patients with benign lesions were further subcategorized into seven groups including: proliferative lesions (Prolif.), fibroadenoma (FA), fat necrosis and inflammatory changes (FN), fibrocystic changes (FC), cystic changes (Cyst), lymph node (LN), breast tissue, and other benign categories. Among the 297 patients, 18 had US images revealing deep chest walls beyond 5 cm and could not be estimated accurately. These patients were not used for analysis of the chest wall effect on background tissue optical property measurements. 225 had disclosed their race (black , Asian , Hispanic , and white ), of which three white patients have two measurements each at two different normal reference locations because their two breast lesions were in different quadrants. Thus, we have a total of 303 measurements from 297 subjects analyzed for lesion diagnosis, 285 measurements from 280 subjects analyzed for chest wall effect, and 228 measurements from 225 subjects analyzed for skin color effect on reflectance measurements. 2.2.US-Guided DOT Imaging and Data ProcessingThe specifications of our US-guided FD-DOT system are described elsewhere.26,38 Briefly, the coregistered US images and optical measurements were acquired simultaneously first from a lesion breast and then from the contralateral normal breast at the mirror position of the lesion [Fig. 1(a)]. For each patient, the measurement location at the lesion side was chosen so that the lesion was located in the middle of the US image in the lateral dimension [Fig. 1(c)]. Four laser diodes sequentially delivered four optical wavelengths of 740, 780, 808, and 830 nm to the tissue and the reflected light was detected by 10 optical fiber bundles which coupled detected light to 10 parallel photomultiplier tube detectors. The measurement procedure and geometry of the US probe and optical source and detector fibers are shown in Figs. 1(a) and 1(b). The source powers measured at fiber tips were: 14 to 18 mW (740 nm), 17 to 23 mW (780 nm), 17 to 23 mW (808 nm), and 24 to 28 mW (830 nm). The wavelengths 785, 808, and 830 nm are often used in DOS and DOT systems (see Table 1) because of the need for deep tissue penetration. 740 nm provides more robust estimation of deoxygenated hemoglobin in the NIR spectrum. Fig. 1An example of measurement procedure and geometry (a) and (b). The coregistered hybrid probe was placed on a lesion first and 4 to 6 measurements were taken. Then, the probe was placed on the contralateral mirror position of the lesion, which was used as reference, and 4 to 5 measurements were taken. The US transducer or probe was located in the middle and optical source and detector fibers were surrounding the US probe. (c) Typical coregistered US image taken at a normal breast (left) and lesion breast (right). A scale bar indicating 1-cm mark shows similar chest wall depth for both lesion and normal reference sites. (d) Reference measurement at 780 nm, amplitude (logarithmic scale, left) and phase (right) versus source, and detector distance. Fitted slopes were and which were used for computing bulk tissue and . 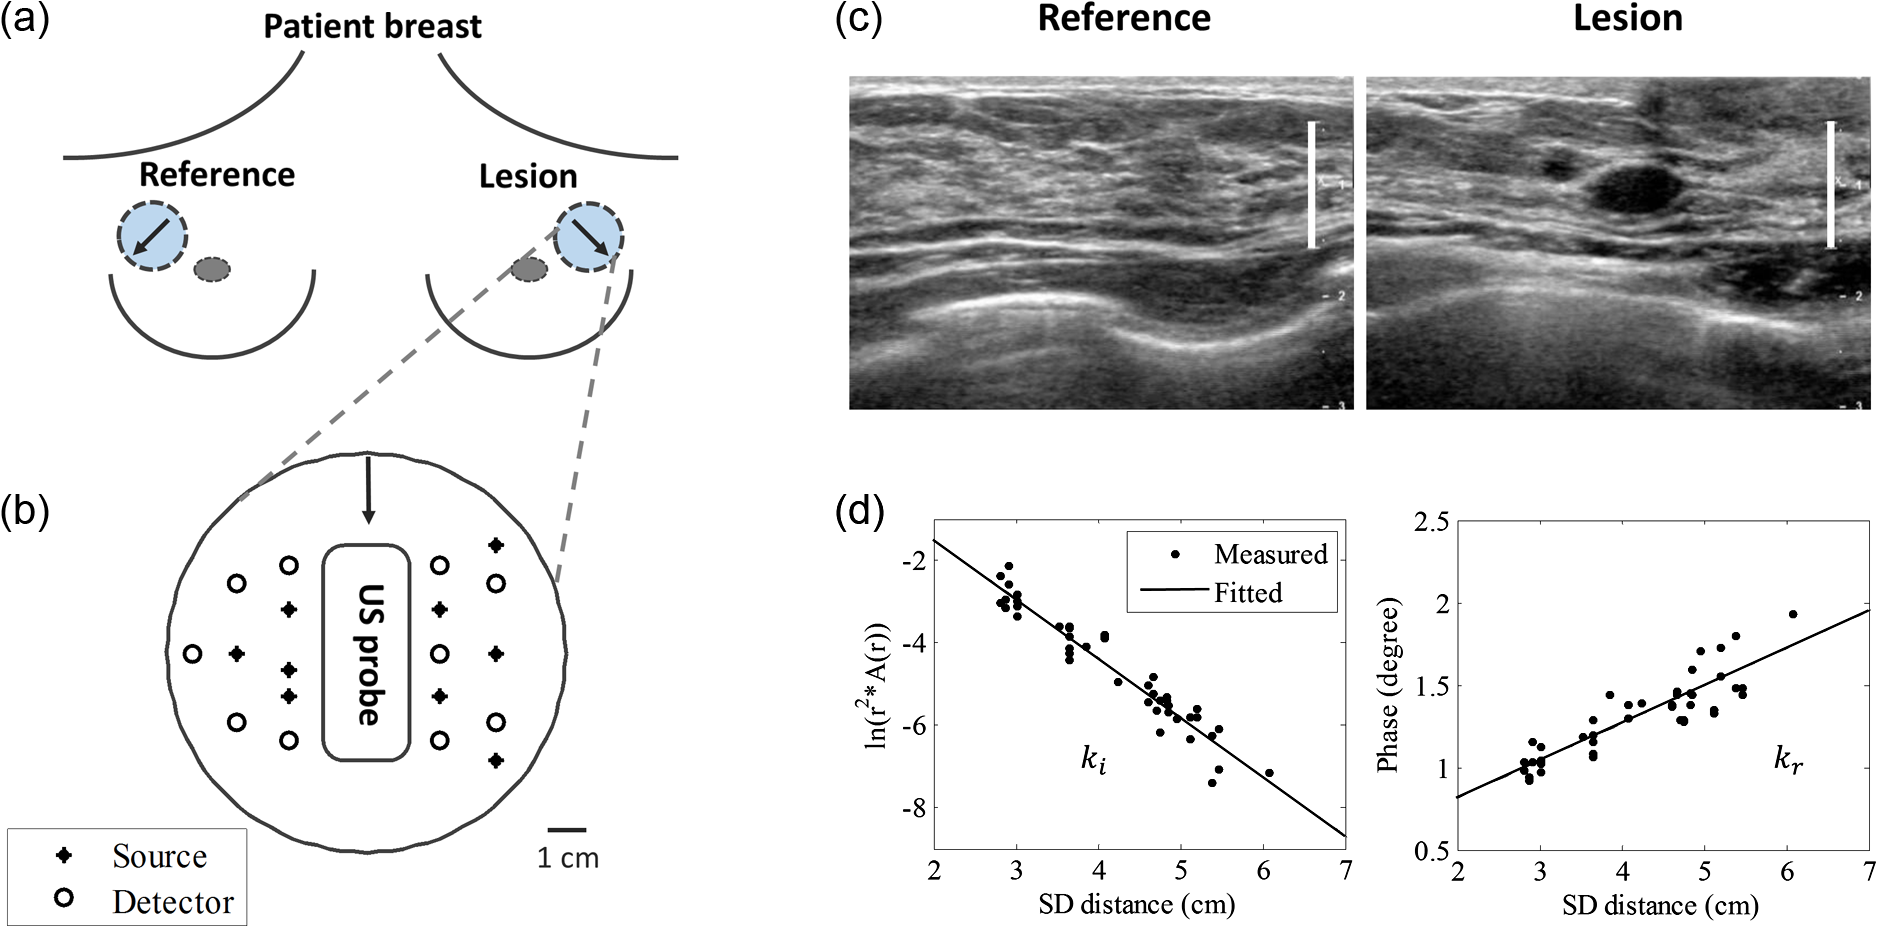 Background tissue and were fitted from the reflectance measurements made at the contralateral normal breast using a semi-infinite analytical solution.39 For each wavelength, the absorption and reduced scattering coefficients are fitted as39 where is the modulation frequency and is the speed of light. and are the fitted slopes of amplitude (logarithmic scale) and phase versus source and detector distance [Fig. 1(d)].About 4 to 6 data sets were acquired at the lesion breast first and then 4 to 5 data sets at the contralateral normal breast (reference). The average and obtained from 4 to 5 measurements made at the contralateral breast were used to characterize each patient’s background tissue optical properties. Reconstruction of an absorption () map of a lesion at each wavelength is based on the Born approximation and conjugate gradient search for optimization.25 The tHb map of a lesion was directly computed by summation of and Hb from reconstructed maps given from40 For each lesion, the average of maximum values of 4 to 6 computed tHb maps was used to characterize the lesion. Bulk tissue or background tissue tHb concentration was calculated from fitted values at four optical wavelengths. To minimize the chest wall effect, the lesion tHb was subtracted from the background hemoglobin level, which represents a relative tHb concentration. 2.3.Chest Wall Depth DetectionWe defined chest wall depth as the distance from the skin to the top layer of chest wall muscle. An automated chest wall depth detection method was developed and applied to the coregistered US images. Detection of the chest wall is based on the fact that chest wall muscles appear as line structures in US images [see Fig. 2(a)].41 Therefore, line detection algorithms could be used for automatic detection. We chose Hough transform as a line detection method because it is simple and robust when combined with any edge detection method.42 In Hough transform, the Cartesian position of a pixel transforms into a parametric plane where it appears as a sinusoidal curve. Each pixel obtains their corresponding curve and intersects with other curves if they are on the same line. The more the number of pixels on a line, the brighter that specific spot in the plane. Based on the user set threshold or automatic voting procedure, low amplitude spots are discarded to avoid unwanted detections. Fig. 2(a) Breast US image with chest wall marked with arrows. (b) Edge detected binary image from (a). (c) Detected chest wall location on the original input image. The yellow and red stars indicate the separation points between line pieces. Green lines indicate the detected linear structures after restriction applying.  Canny edge detection method is first applied to generate a binary image as shown in Fig. 2(b).43 Canny edge detection is a very robust and popular edge detection technique. Along with the intensity gradient on the image, it applies Gaussian noise filtering, edge thinning, and hysteresis tracking using a double threshold to obtain better edge detection. The goal of the edge detection in an image is to determine the boundaries of structures. It is expected that chest wall boundaries will be visible after edge detection. However, in typical breast US images, edge detection provides chest wall boundaries along with boundaries of other structures. It is clear from Fig. 2(b) that if Hough transform is applied to the edge detected image without any restriction, it will detect several unnecessary structures. For example, due to subcutaneous fat and breast tissue interfaces some linear structures are appeared at the top of the US image. There are other linear structures also visible in the image. Hough transform detects all these linear structures. To avoid these unnecessary detections, we modeled the chest as a linear structure which is mainly horizontal with a small slope and it should appear at the lower half of the image. To find the structure that agrees with this model, the search area for the chest wall was defined at the lower half of the US image and lines which have more than a 20-deg slope were discarded. Finally, lines consisting of less than 30% of the number of pixels in the longest detected line are discarded since linear structures associated with the chest wall should have the highest number of pixels. After applying Hough transform and the above-mentioned restrictions, the surviving linear structures are marked in green lines as shown in Fig. 2(c). Finally, the mean value of all the points of these detected lines is considered as the chest wall depth. A flow diagram of the entire procedure is given in Fig. 3. In order to estimate the accuracy of this method, we measured the chest wall depth both by algorithm and manually by an experienced US breast imager, refereed as an operator. We quantified the error as Empirically for cases with errors which correspond to 2 to 4 mm for the average chest wall depth of 2 to 3 cm, we used automatically detected values. For cases with errors , the operator re-evaluated the chest wall depths and reassigned or confirmed the values. 2.4.Statistical AnalysisPearson correlation method was used to examine the correlations of the fitted and with the chest wall depth. A two-sample -test was also performed to compare the mean difference of tHb between the malignant group and each benign subgroup (Table 5, -values). In order to evaluate the diagnostic performance of tHb levels in classification of malignant and benign lesions, the tHb levels were used as the predictor variable and the responding variable is a binary corresponding to the status of the tumor diagnosis based on biopsy. For analysis #1, the respond variable is unity for early stage malignant tumors (Tis-T1) and zero for benign lesions; for analysis #2, the responding variable is unity for all malignant tumors including Tis-T1 and late stage cancers (T2-T4) and zero for benign lesions. The false-positive rate (1-specificity) and true-positive rate (sensitivity) were computed in MATLAB® to generate the receiver operating characteristic curve (ROC). In each ROC plot, the area under the ROC (AUC) and the corresponding 95% confidence interval were calculated using package pROC.44 The statistical difference of ROCs with and without subtracting background was evaluated by two tests in pROC: (1) the Venkatraman’s test on two ROC curves and (2) the bootstrap test on AUCs as opposed to the actual ROC curves. The Venkatraman’s method evaluates the integrated absolute difference between ROCs at all operating points with a test statistics (corresponding to statistics in pROC), whose null distribution is generated by permuting the pooled ranks of two predictor variables within a study subject.45 In our study, the permutation was executed 2000 times as a default. The Bootstrapping method tests the equality of AUCs for two diagnoses.44 It defines a statistics by dividing the difference of the original two AUCs with a standard deviation (), which is the standard deviation of the AUCs’ difference and is computed 2000 times with bootstrap replicates. In each replicate, original diagnostic measurements are resampled with replacement. As the statistics follows a normal distribution, -value is calculated based on the observed score. For both tests, the -value was computed by a two-tailed paired test and statistical significance was considered at . 3.ResultsWe compared an operator manually and an algorithm automatically detected chest wall depths. Using an error measure defined in Eq. (4), the percentage of cases with error was 67%. For cases with error (33%), the operator re-evaluated the chest wall depths and reassigned or confirmed the values. For all cases, the average algorithm detection error was 14%, which corresponds to 2 to 4 mm for the average chest wall depth of 2 to 3 cm. We then analyzed the correlation between fitted background and and the chest wall depth of the reference side which does not have known lesions at the time of the study based on the evaluations of the attending radiologists from available mammograms, US, and or magnetic resonance imaging. The fitted and at four optical wavelengths are correlated with the chest wall depth as shown in Fig. 4 and Table 2 with -values less than 0.0001. At each wavelength, the fitted has a much higher correlation coefficient than that of the fitted . Analysis of different races shows that as the skin color gets lighter (the skin color was based on a patient’s race as disclosed at the time of the consent), the correlation coefficient between and the chest wall depth is higher, while the correlation between and the chest wall depth does not change much with skin color. This is likely caused by the deeper penetration of the diffused light when the skin color is lighter. There is no significant difference of chest wall depth between the white and black race groups and between the white and Asian and Hispanic groups; however, the correlation coefficients at four wavelengths for the white group is significantly larger than for the black () and Asian and Hispanic groups (), but no significant difference was found on the correlation coefficients between the black and Asian and Hispanic groups (). Table 3 shows the fitted and values of the entire population and different races. No significant difference of or was found between any two racial groups. Fig. 4Fitted and versus chest wall depth at different wavelengths measured at normal reference side.  Table 2Correlation coefficient (r) between fitted μa and μs′ with chest wall depth of entire population and different races (total n=285, black n=45, Asian and Hispanic n=46, white n=137).
Table 3Breast tissue bulk optical properties (mean±std) measured at four optical wavelengths of entire population and different races (total n=285, black n=45, Asian and Hispanic n=46, white n=137).
We further calculated the hemoglobin concentrations from fitted bulk tissue at four wavelengths. The correlation coefficients () and -values between chest wall depth and computed background hemoglobin values were, tHb: , ; : , ; and Hb: , , which are statistically significant. We have shown in a previous study that the lesion maximum hemoglobin concentration can be used to differentiate benign from malignant lesions.26 We have investigated the improvement of using this method in differentiating benign and malignant lesions by subtracting the corresponding background hemoglobin concentration. Figure 5 shows the differences without and with subtraction of the corresponding background from each patient between malignant group (both Tis-T1 and T2-T4) and benign subgroups of Prolif., FA, FN, FC, Cyst, and LN. Numerical differences, standard deviations (std), and -values were computed between malignant and benign subgroups and are shown in Table 4. The error bars in Fig. 5 and std values in Table 4 indicate the standard deviations of the difference between the malignant group and each benign subgroup. They were computed using the stds and sample sizes () of two groups under comparison as . An increased difference was found between the malignant group and 6 of the 7 benign groups in a range of 2 to , except for the tissue and other benign group, because of the small sample size. The largest difference after subtraction was found from fibroadenoma (FA) due to the relatively young patients with dense breast tissue and a shallower chest wall depth in this group. The mean age for the benign subgroups were: , , , , , , and years for Prolif., FA, FN, FC, Cyst, tissue and other benign, and LN, respectively. Their average chest wall depths were , , , , , , and , respectively. Fig. 5Total hemoglobin difference () and std between the malignant group () and benign subgroups (Prolif , FA , FN , FC , Cyst , tissue and other benign , and LN ), and all benign group (). -values were computed by comparing ΔtHb (difference between malignant and benign subgroup) with and without background subtraction using Welch’s t-test, for all benign groups except for two (tissue and other benign and LN), due to smaller sample sizes resulting in large -value.  Table 4Total hemoglobin differences (ΔtHb), standard deviations (Std) and p-values between the malignant and benign sub-groups with and without subtracting the background.
The ROC curves (sensitivity versus specificity) using a threshold of tHb level for predicting early stage malignant lesions (Tis-T1) and all malignant lesions (Tis-T1 and T2-T4) from the benign cases are given in Fig. 6. was chosen as the optimal threshold for diagnosis using relative lesion tHb after subtracting the background values, and was used as the optimal threshold for diagnosis using the reconstructed tHb without subtracting the background values. We compared both ROCs and AUCs in R package pROC44 using tHb levels before and after subtracting the background. When comparing the ROC curve after background subtraction against the one before subtraction, we obtained for Tis-T1 diagnosis and for all malignant lesion diagnosis. As shown in Fig. 6, we observed a significantly higher AUC for Tis-T1 diagnosis with an increased AUC of 3.0% () and all malignant lesion diagnoses with an increased AUC of 2.8% (). The above results have demonstrated that background subtraction method has consistently improved diagnostic performance for early breast lesions. Fig. 6ROC curves for (a) Tis-T1 and (b) all malignant cases (Tis-T1 and T2-T4) using the lesion tHb with and without subtracting background values. The 95% confident intervals of AUC were given in the figures.  Table 5 shows the sensitivity, specificity, positive predictive value (PPV), and negative predictive values (NPV) in diagnosing malignant tumor from the benign lesions using tHb data with and without subtracting the background data. Results show an improvement of 1.7% to 2.5% in sensitivity and specificity, 6.8% to 7.4% improvement in PPV, and around 0.4% to 0.6% improvement in NPV after subtracting the background values. Table 5Sensitivity, specificity, PPV, and NPV of malignant tumor diagnosis by using threshold of tHb before (th=80 μM) and after (th=64 μM) subtracting background value.
4.Discussion and SummaryThe fitted and measured in the reflection geometry using larger source and detector separations are not true representations of tissue background optical properties due to the influence of the chest wall underneath the breast tissue. This suggests that diagnosis between malignant and benign lesions is best performed by using relative hemoglobin concentrations after subtracting corresponding background values computed from fitted at multiple optical wavelengths. Another advantage of using relative hemoglobin values for diagnosis is that this method eliminates the effect due to hemoglobin level fluctuations in certain type of patients who may have anemia or be under some drug effect. For those patients, the background blood hemoglobin concentration differs significantly from the normal values. For each patient, we typically collect 4 to 6 sets of measurements from the contralateral breast at slightly different locations. The separation between each set of measurements varies from a few seconds to tens of seconds because of hand-held operation. The fitted background tHb of each patient is the average of these 4 to 6 data sets. In general, the fitted tHbs for each patient are very close with an average standard deviation of . Skin color does affect the light penetration, therefore, the fitted background values from dark skin color patients are less affected by the chest wall depth. We understood that there are individual differences of skin color from each race group; however, our assumption that the skin color order from dark to light: black > Asian and Hispanic > white, was based on the general trend and our result shows an agreement with this trend. The Asian and Hispanic group has a mixed skin color, and no significant difference on the correlation of fitted with chest wall depth was found compared with the black group. The sample size of each group is large and it should not affect reported results. As shown in Table 3, the fitted and for the three groups are very similar. The relative tHb computed with reconstructed was used as the predictor for generating ROC curves for the study. When comparing the closeness of two ROC curves with and without background subtraction by the Venkatraman’s method in R package pROC, we observed statistically different ROC curves for Tis-T1 diagnosis [, Fig. 6(a)], but similar ROC curves for all malignant lesion diagnosis [, Fig. 6(b)]. Consistent with this, the background subtraction method yielded a statistically higher AUC for Tis-T1 diagnosis [, Fig. 6(a)]. However, we also obtained a higher AUC for all malignant lesion diagnoses [, Fig. 6(b)]. The inconsistent result is likely due to differential statistics employed in two different ROC tests. As can be seen in either case of Fig. 6, the 95% CIs of two AUCs with and without subtracting background overlap with each other. In general, if confidence intervals do not overlap, it suggests a significant difference between two parameter estimates; however, the reverse is not always true and our data might be this case. Given the observed difference of two AUCs (Tis-T1 diagnosis: 3%; all malignant lesion diagnosis: 2.8%), the 2000 times of bootstrap resampling method generated small empirical standard deviations, for Tis-T1 diagnosis and for all malignant cases, resulting in large values and significant -values accordingly. Nevertheless, improvement of our subtracting method for all malignant lesion diagnosis can only be considered as marginal and needs to be confirmed by future studies. We also studied the distribution of tHb versus age, and found the trend was generally in agreement with that reported by Cerussi et al.10 However, our data were more scattered than the results reported in Ref. 10. The chest wall effect still played a role on our data even though we selected measurements with the chest wall depth deeper than 2 cm. Moreover, as shown in Table 1, the measured is in the range of 0.025 to and in the range of 5.0 to , while our measured is in the range of 0.0001 to and is in the range of 0.6 to . Although is similar to the reported values, is lower. The tHb values were measured to be in the range of 1 to , which is similar to the range of 0 to reported in Ref. 10, and lower than the range of 10 to reported in Ref. 32. We have tried to remove the chest wall effect by using shorter source-detector measurements.27,29–31 Results show that although the correlation coefficient was smaller when shorter source-detector measurements were selected, the fitted was still correlated with the chest wall depth but not for the source and detector range we have. We have developed an automated chest wall detection algorithm to mark the chest wall depth from coregistered US images. It is also a valuable tool to guide operators to position the hand-held probe at the matched chest wall positions of reference and lesion breasts to achieve the best performance in computing perturbations and reconstructing accurate lesion optical properties. In summary, this paper reviewed breast tissue optical properties measured by diffuse optical spectroscopy or tomography techniques. Our measurements from 297 patients show significant correlation between the measured optical properties and the chest wall depth where even the background were similar to those reported in the literature. By subtracting background tHb computed from fitted background of all wavelengths, the relative tHb improves sensitivity, specificity, and positive and NPVs in breast cancer diagnosis. AcknowledgmentsThis work has been supported by the National Institutes of Health (R01EB002136) and Connecticut Bioscience Fund. ReferencesB. J. Tromberg et al.,
“Imaging in breast cancer: diffuse optics in breast cancer: detecting tumors in pre-menopausal women and monitoring neoadjuvant chemotherapy,”
Breast Can. Res., 7
(6), 1
(2005). http://dx.doi.org/10.1186/bcr1358 BCTRD6 Google Scholar
R. Choe et al.,
“Differentiation of benign and malignant breast tumors by in-vivo three-dimensional parallel-plate diffuse optical tomography,”
J. Biomed. Opt., 14
(2), 024020
(2009). http://dx.doi.org/10.1117/1.3103325 JBOPFO 1083-3668 Google Scholar
S. P. Poplack et al.,
“Electromagnetic breast imaging: results of a pilot study in women with abnormal mammograms,”
Radiology, 243
(2), 350
–359
(2007). http://dx.doi.org/10.1148/radiol.2432060286 RADLAX 0033-8419 Google Scholar
X. Intes,
“Time-domain optical mammography SoftScan: initial results,”
Academic Radiol., 12
(8), 934
–947
(2005). http://dx.doi.org/10.1016/j.acra.2005.05.006 Google Scholar
L. Spinelli et al.,
“Characterization of female breast lesions from multi-wavelength time-resolved optical mammography,”
Phys. Med. Biol., 50
(11), 2489
–2502
(2005). http://dx.doi.org/10.1088/0031-9155/50/11/004 PHMBA7 0031-9155 Google Scholar
F. Collettini et al.,
“Diagnostic performance of a near-infrared breast imaging system as adjunct to mammography versus X-ray mammography alone,”
Eur. Radiol., 22
(2), 350
–357
(2012). http://dx.doi.org/10.1007/s00330-011-2276-2 Google Scholar
Q. Zhu et al.,
“Early-stage invasive breast cancers: potential role of optical tomography with US localization in assisting diagnosis,”
Radiology, 256
(2), 367
–378
(2010). http://dx.doi.org/10.1148/radiol.10091237 RADLAX 0033-8419 Google Scholar
Q. Zhu et al.,
“Breast cancer: assessing response to neoadjuvant chemotherapy by using US-guided near-infrared tomography,”
Radiology, 266
(2), 433
–442
(2013). http://dx.doi.org/10.1148/radiol.12112415 RADLAX 0033-8419 Google Scholar
N. Shah et al.,
“Noninvasive functional optical spectroscopy of human breast tissue,”
Proc. Nat. Acad. Sci. U. S. A., 98
(8), 4420
–4425
(2001). http://dx.doi.org/10.1073/pnas.071511098 Google Scholar
A. E. Cerussi et al.,
“Sources of absorption and scattering contrast for near-infrared optical mammography,”
Acad. Radiol., 8
(3), 211
–218
(2001). http://dx.doi.org/10.1016/S1076-6332(03)80529-9 Google Scholar
T. Svensson et al.,
“Characterization of normal breast tissue heterogeneity using time-resolved near-infrared spectroscopy,”
Phys. Med. Biol., 50
(11), 2559
–2571
(2005). http://dx.doi.org/10.1088/0031-9155/50/11/008 PHMBA7 0031-9155 Google Scholar
W. Mo et al.,
“Quantitative characterization of optical and physiological parameters in normal breasts using time-resolved spectroscopy: in vivo results of 19 Singapore women,”
J. Biomed. Opt., 14
(6), 064004
(2009). http://dx.doi.org/10.1117/1.3257251 JBOPFO 1083-3668 Google Scholar
H. Jiang et al.,
“Near-infrared optical imaging of the breast with model-based reconstruction,”
Acad. Radiol., 9
(2), 186
–194
(2002). http://dx.doi.org/10.1016/S1076-6332(03)80169-1 Google Scholar
T. Yates et al.,
“Optical tomography of the breast using a multi-channel time-resolved imager,”
Phys. Med. Biol., 50
(11), 2503
–2517
(2005). http://dx.doi.org/10.1088/0031-9155/50/11/005 PHMBA7 0031-9155 Google Scholar
K. Suzuki et al.,
“Quantitative measurement of optical parameters in normal breasts using time-resolved spectroscopy: in vivo results of 30 Japanese women,”
J. Biomed. Opt., 1
(3), 330
–334
(1996). http://dx.doi.org/10.1117/12.239902 JBOPFO 1083-3668 Google Scholar
T. Durduran et al.,
“Bulk optical properties of healthy female breast tissue,”
Phys. Med. Biol., 47
(16), 2847
–2861
(2002). http://dx.doi.org/10.1088/0031-9155/47/16/302 PHMBA7 0031-9155 Google Scholar
D. Grosenick et al.,
“Time-domain optical mammography: initial clinical results on detection and characterization of breast tumors,”
Appl. Opt., 42
(16), 3170
–3186
(2003). http://dx.doi.org/10.1364/AO.42.003170 APOPAI 0003-6935 Google Scholar
D. Grosenick et al.,
“Time-domain scanning optical mammography: II. Optical properties and tissue parameters of 87 carcinomas,”
Phys. Med. Biol., 50
(11), 2451
–2468
(2005). http://dx.doi.org/10.1088/0031-9155/50/11/002 PHMBA7 0031-9155 Google Scholar
L. Spinelli et al.,
“Bulk optical properties and tissue components in the female breast from multiwavelength time-resolved optical mammography,”
J. Biomed. Opt., 9
(6), 1137
–1142
(2004). http://dx.doi.org/10.1117/1.1803546 JBOPFO 1083-3668 Google Scholar
Q. Fang and D. A. Boas,
“Monte Carlo simulation of photon migration in 3D turbid media accelerated by graphics processing units,”
Opt. Express, 17
(22), 20178
–20190
(2009). http://dx.doi.org/10.1364/OE.17.020178 OPEXFF 1094-4087 Google Scholar
Q. Fang et al.,
“Combined optical and X-ray tomosynthesis breast imaging,”
Radiology, 258
(1), 89
–97
(2011). http://dx.doi.org/10.1148/radiol.10082176 RADLAX 0033-8419 Google Scholar
L. Blaine et al.,
“Age and race related changes in marnmographic parenchymal patterns,”
Cancer, 63 2537
–2539
(1989). http://dx.doi.org/10.1002/(ISSN)1097-0142 CANCAR 0008-543X Google Scholar
B. W. Pogue et al.,
“Quantitative hemoglobin tomography with diffuse near-infrared spectroscopy: pilot results in the breast,”
Radiology, 218
(1), 261
–266
(2001). http://dx.doi.org/10.1148/radiology.218.1.r01ja51261 RADLAX 0033-8419 Google Scholar
A. Pifferi et al.,
“Four-wavelength time-resolved optical mammography in the 680 980-nm range,”
Opt. Lett., 28
(13), 1138
–1140
(2003). http://dx.doi.org/10.1364/OL.28.001138 OPLEDP 0146-9592 Google Scholar
N. G. Chen et al.,
“Simultaneous near-infrared diffusive light and ultrasound imaging,”
Appl. Opt., 40
(34), 6367
–6380
(2001). http://dx.doi.org/10.1364/AO.40.006367 APOPAI 0003-6935 Google Scholar
Q. Zhu et al.,
“Assessment of functional differences in malignant and benign breast lesions and improvement of diagnostic accuracy by using US-guided diffuse optical tomography in conjunction with conventional US,”
Radiology, 280
(2), 387
–397
(2016). http://dx.doi.org/10.1148/radiol.2016151097 RADLAX 0033-8419 Google Scholar
Y. Ardeshirpour et al.,
“Effect of the chest wall on breast lesion reconstruction,”
J. Biomed. Opt., 14
(4), 044005
(2009). http://dx.doi.org/10.1117/1.3160548 JBOPFO 1083-3668 Google Scholar
C. Xu and Q. Zhu,
“Estimation of chest-wall-induced diffused wave distortion with the assistance of ultrasound,”
Appl. Opt., 44
(20), 4255
–4264
(2005). http://dx.doi.org/10.1364/AO.44.004255 APOPAI 0003-6935 Google Scholar
M. Das et al.,
“Analytical solution for light propagation in a two-layer tissue structure with a tilted interface for breast imaging,”
Appl. Opt., 45
(20), 5027
–5036
(2006). http://dx.doi.org/10.1364/AO.45.005027 APOPAI 0003-6935 Google Scholar
C. Xu et al.,
“Image reconstruction method for a two-layer tissue structure accounts for chest-wall effects in breast imaging,”
J. Biomed. Opt., 13
(6), 064029
(2008). http://dx.doi.org/10.1117/1.3041497 JBOPFO 1083-3668 Google Scholar
Y. Xu and Q. Zhu,
“Estimation and imaging of breast lesions using a two-layer tissue structure by ultrasound-guided optical tomography,”
J. Biomed. Opt., 20
(6), 066002
(2015). http://dx.doi.org/10.1117/1.JBO.20.6.066002 JBOPFO 1083-3668 Google Scholar
N. Yoshizawa et al.,
“Effect of the chest wall on the measurement of hemoglobin concentrations by near-infrared time-resolved spectroscopy in normal breast and cancer,”
Breast Can., 23
(6), 844
–850
(2016). http://dx.doi.org/10.1007/s12282-015-0650-7 Google Scholar
A. Mostafa et al.,
“Extraction of tumor features from ultrasound images for diffused optical tomography reconstruction,”
in Optical Tomography and Spectroscopy,
JTu3A. 14
(2016). Google Scholar
J. Revell et al.,
“Applied review of ultrasound image feature extraction methods,”
in The 6th Medical Image Understanding and Analysis Conf.,
173
–176
(2002). Google Scholar
F. Zana and J.-C. Klein,
“Segmentation of vessel-like patterns using mathematical morphology and curvature evaluation,”
IEEE Trans. Image Process., 10
(7), 1010
–1019
(2001). http://dx.doi.org/10.1109/83.931095 IIPRE4 1057-7149 Google Scholar
B. S. Manjunath and W.-Y. Ma,
“Texture features for browsing and retrieval of image data,”
IEEE Trans. Pattern Anal. Mach. Intell., 18
(8), 837
–842
(1996). http://dx.doi.org/10.1109/34.531803 ITPIDJ 0162-8828 Google Scholar
M. Haghighat et al.,
“CloudID: trustworthy cloud-based and cross-enterprise biometric identification,”
Expert Syst. Appl., 42
(21), 7905
–7916
(2015). http://dx.doi.org/10.1016/j.eswa.2015.06.025 Google Scholar
C. Xu et al.,
“Ultrasound-guided diffuse optical tomography for predicting and monitoring neoadjuvant chemotherapy of breast cancers recent progress,”
Ultrason. Imaging, 38
(1), 5
–18
(2016). http://dx.doi.org/10.1177/016173461558028010.1177/0161734615580280 Google Scholar
R. Danen et al.,
“Regional imager for low‐resolution functional imaging of the brain with diffusing near‐infrared light,”
Photochem. Photobiol., 67
(1), 33
–40
(1998). http://dx.doi.org/10.1111/php.1998.67.issue-1 PHCBAP 0031-8655 Google Scholar
S. Prahl, Optical Absorption of Hemoglobin,
(1999) http://omlc.ogi.edu/spectra/hemoglobin/index.html Google Scholar
J. H. Youk et al.,
“Imaging findings of chest wall lesions on breast sonography,”
J. Ultrasound Med., 27
(1), 125
–138
(2008). http://dx.doi.org/10.7863/jum.2008.27.1.125 JUMEDA 0278-4297 Google Scholar
D. H. Ballard,
“Generalizing the Hough transform to detect arbitrary shapes,”
Pattern Recognit., 13
(2), 111
–122
(1981). http://dx.doi.org/10.1016/0031-3203(81)90009-1 Google Scholar
J. Canny,
“A computational approach to edge detection,”
IEEE Trans. Pattern Anal. Mach. Intell., PAMI-8 679
–698
(1986). http://dx.doi.org/10.1109/TPAMI.1986.4767851 ITPIDJ 0162-8828 Google Scholar
X. Robin et al.,
“pROC: an open-source package for R and S+ to analyze and compare ROC curves,”
BMC Bioinf., 12
(1), 77
(2011). http://dx.doi.org/10.1186/1471-2105-12-77 BBMIC4 1471-2105 Google Scholar
E. Venkatraman and C. B. Begg,
“A distribution-free procedure for comparing receiver operating characteristic curves from a paired experiment,”
Biometrika, 83
(4), 835
–848
(1996). http://dx.doi.org/10.1093/biomet/83.4.835 BIOKAX 0006-3444 Google Scholar
BiographyFeifei Zhou is a PhD candidate of Biomedical Engineering Department of the University of Connecticut. She received her BS degree in biomedical engineering from Huazhong University of Science and Technology in China and her MS degree in biomedical engineering from the University of California, Davis. Her research is focused on ultrasound-guided diffuse optical tomography and fluorescence imaging. Atahar Mostafa is a PhD student in the Biomedical Engineering Department at Washington University in St. Louis. He received his BS degree in electrical and electronics engineering from the Bangladesh University of Engineering and Technology in Bangladesh and his MS degree in electrical engineering from the University of Saskatchewan in Canada. His research is focused on ultrasound-guided diffuse optical tomography. Quing Zhu is a professor in biomedical engineering and radiology department at Washington University in St. Louis. She has been named a fellow of OSA, SPIE, and is an associate editor of IEEE Photonics Society and editorial board member of Photoacoustic and Biomedical Optics. Her research is focused on ultrasound-guided diffuse optical tomography for breast cancer diagnosis and treatment monitoring, coregistered ultrasound, and photoacoustic tomography for ovarian cancer diagnosis, optical coherent tomography, and photoacoustic microscopy. |
|||||||||||||||||||||||||||||||||||||||||||||||||||||||||||||||||||||||||||||||||||||||||||||||||||||||||||||||||||||||||||||||||||||||||||||||||||||||||||||||||||||||||||||||||||||||||||||||||||||||||||||||||||||||||||||||||||||||||||||||||||||||||||||||||||||||||||||||||||||||||||||||||||||||||||||||||||||||||||||||||||||||||||||||||||||||||||||||||||||||||||||||||||||||||||||||||||||||||||||||||||||||||||||||||||||||||||||||||||||||||||||||||||||||||||||||||||||||||||||||||||||||||||||||||||||||||||||||||||||||||||||||||||||||||||||||||||||||||||||||||||||||||||||||||||||||||||||||||||||||||||||||||||||||||||||||||||||||||||||||


