
|
|
1.IntroductionUnder conditions that permit proliferation, formation of biofilms on surfaces is ubiquitous1 for many different types of microbes. Biofilms have special properties, providing a space that allows a microbial population to efficiently and deterministically go through the biological stages of growth and regeneration. Over the course of their development, biofilms1 attain a complex internal structure containing channels and a heterogeneous distribution of organic materials and microbes of different phenotypes.2 Biofilms are important because they host a vastly different microbial biology than do bulk fluid media, and permit different signaling than that employed by planktonic microbes.3 In addition, biofilms are believed to be involved in more than 80% of the sources of infectious diseases.1 Because of their dynamic and complex structures, biofilms have been extremely difficult to characterize. In this work, we seek to understand the hydrology of these films, i.e., the properties, distribution, and circulation of water in the films. We use Raman spectroscopy, near-infrared absorption spectroscopy, and physical optics, i.e., optical interference to measure the hydration and optical thickness of biofilms. We show that biofilms have the capacity to form a hydrated interior layer, capable of displaying well-defined interference fringes, when the film is removed from the culture medium. Measurement of the interference patterns is a new method of characterization of biofilms. We show that biofilms produced under different conditions and by different organisms all have the capacity to produce this layered structure. Some properties of this hydrated layer depend on the biology of the biofilm, i.e., microbial species, maturation time, substrate, culture medium, exposure to light, and possibly other factors. Oscillations in optical loss or “fringes” result from the interference between a straight-through beam and a beam reflected from the two interior surfaces of a thin film.4 Their observation allows calculation of the thickness and refractive index of the film. Several criteria must be fulfilled for the interference to be observable. First, there must be a discontinuity in the refractive index across both surfaces of the film (the geometric mean of the index of refraction differences determines the amplitude of the fringes2). Second, the refractive index must be sufficiently homogeneous throughout the material. Third, the interfaces of the film must be smooth on the scale of the wavelength of the light. Fourth, the optical thickness of the film must be greater than a quarter of the wavelength of the light. The fringes, which span the near ultraviolet to near-infrared spectral range, allow simultaneous calculation of optical thickness and index of refraction. Conveniently, it is also easy to observe a vibrational overtone absorption band for water5 at 1451 nm. From the strength of the 1451-nm absorption, we obtain the total water content of the films. Across a broad range of bacteria and growth conditions, there is a correspondence between the thickness calculated from the interference fringes and the strength of the 1451-nm absorption feature. Given the vast knowledge3 of thin film optical interference and the readily attainable spectroscopic characterization of the chemical composition of a thin film, there are surprisingly few studies that characterize the hydration properties and the chemical properties of biofilms. 2.Experiments2.1.Materials and MethodsBL21 Gold (DE3) E. coli (EC) with a pET27b(+) sapB vector insert was obtained from Dr. R.P. Doyle (Syracuse University, Syracuse) grown in Luria-Bertani (LB) with of kanamycin () (IBI Scientific, Peosta, Iowa). Wild type P. aeruginosa (PAO1) were obtained from Dr. Guirong Wang (Upstate Medical University, Syracuse) and both bacteria were cultured and prepared for experiments as described below. PAO1-green fluorescent protein (PAO1-GFP) strain (plasmid pSMC2 expresses GFP) was obtained from Dr. Guirong Wang (Upstate Medical University, Syracuse). Phosphate-buffered saline (PBS) ( solution) (ICN Biomedical Inc., Aurora, Ohio), DifcoTM M9 Minimal Salts and NaCl (Fisher Scientific), Bacto™ Tryptone (Becton, Dickson and Company Sparks, Maryland), and yeast extract (aMReSCO, Solon, Ohio) were used without further purification. Films grown on quartz utilized Hellma Analytics High Precision 1 cm cuvettes made of Quartz Suprasil (#101-10-40). The surface quality, i.e., roughness of the quartz cuvettes, i.e., substrates are assumed smooth to light wavelength across the entire UV-VIS range based on the specifications of comparable quartz discs also produced by Heraeus, the entity that we believe produces the quartz for both Hellma cuvettes and Starna cells. Films grown on polystyrene utilized disposable polystyrene cuvettes (, Dynalon 1.5 mL UV-VIS range Semi-Micro Cuvette #302225-0002). The polystyrene surface certainly has less hydroxyl than any quartz and the roughness is determined by the viscosity and surface tension of the plastic present at cooling. Here, we assume that the roughness is probably even less than that for quartz but we cannot verify this at this time. Microscopy was done on films grown on the same materials obtained from broken cuvettes. Polystyrene and quartz surfaces were rinsed with ethanol and dried before introducing a culture that would provide a film for analysis. All the bacterial strains were grown in LB medium containing tryptone, yeast extract, and NaCl at 37°C. The pH of the medium was maintained at 7.0 with NaOH. The medium was then autoclaved at 121°C for 15 min in a water bath. Nearly all OD600 spectra were obtained using a Perkin Elmer Lambda 950 UV/Vis spectrophotometer, but some results were obtained using an Agilent Cary 60 UV/Vis. Spectral scans to observe fringes as in Fig. 2 used the Lambda 950 UV/VIS set to a 2-nm slit width, 1.0-s integration time, and 1.0-nm data interval. Before scanning the sample, the spectrometer was first normalized (“autozeroed”) with an empty cuvette over the same wavelength range. For the time drive experiment in Fig. 3, data were collected using the Perkin Elmer instrument at 1451- and a 2-nm slit width for 15-s interval over various durations of time, as indicated in the figures. Some films in Fig. 4 were grown in a cuvette with a different type of stirring and temperature control, the sample being housed in a custom-made temperature-controlled base. Using a flexible temperature probe attachment connected to a Vernier LabQuest2 Logger Pro, temperature data were collected to ensure constant temperature conditions. The anodized aluminum base height is 3.5 cm and the cuvette height is 4.5 cm. These dimensions ensure that the sample, i.e., cuvette is covered by the walls of the base to allow homogeneity in heating and or cooling of the sample, but still allow facile removal of the cuvette from the base for rinsing and other operations. A magnetic stirrer/micro stir bar was added to the setup in order to maintain constant stirring of samples during the experiments. The stirrer itself was modified from a commercial device so that the rotating magnet could be placed close to the side of the base in order to pull the stir bar to the side of the cuvette. This ensured that the stir bar axis of rotation was perpendicular to the side surfaces of the cuvette on which the biofilms grew. Sample preparation for UV/VIS study in Figs. 6 and 7: The culture was slowly poured out of the cuvette and the excess liquid was removed from the top of the cuvette. The data were collected, and the walls of the cuvette were gently rinsed with 1 mL of PBS or deuterated PBS (DPBS), as indicated in the figures. The PBS or DPBS was removed in the same way as the initial culture. This procedure was repeated for each rinse. EC sample preparation for biofilm drying experiment (Figs. 6 and 7): To prepare native culture (NC), 5 mL of LB with of kanamycin was inoculated with EC and allowed to grow over a 24-h period in an incubator at 37°C with shaking at 250 rpm. Then of NC was used to inoculate a new 5.0 mL sample of LB with of kendomycin. Then 3.50 mL of newly inoculated culture were placed in the quartz cuvette, covered with Parafilm®, and placed in a stationary temperature-controlled cuvette holder to maintain a constant temperature of 37°C and allowed to grow overnight. The culture was gently poured out of the cuvette; the top of the cuvette was gently dabbed on a paper towel and then placed into the UV/Vis for the time drive experiment. Data were collected at 1451 nm for 15-s interval over various durations of time. P. aeruginosa (PAO1) sample preparation for developmental stage synchronized experiment (Fig. 11) was as follows. PAO1 was retrieved from stock and cultured in LB medium overnight at 37°C with shaking at 250 rpm. The cultured PAO1 gave an optical density close to 1 () and was subcultured by adding of overnight culture to 25 mL of fresh LB medium and shaken at 250 rpm and 37°C for an additional 2 h to obtain an OD600 close to 0.1 ( for the bacteria.) Multiple aliquots of 1 mL of the subcultured PAO1 (initial ) were further cultured in disposable polystyrene cuvettes (see above for cuvette specification). The cuvettes were covered with Parafilm® (to prevent evaporation) and placed stationary in an incubator at 37°C for 24 h before use. At the desired hour, the LB medium was removed, and the interior of the cuvette was rinsed two times with PBS. An additional of PBS was added to the emptied cuvette (with biofilm on the wall) and immediately covered with Parafilm® to prevent evaporation of water from the biofilm. For microscopy experiments, a flat section of a broken cuvette of either material was placed into a cuvette in which a bacterial population was being cultured. After the designated procedure to produce a film was completed (a specified time point was reached), the flat section was placed on a thin steel plate that forms the base of a space within which the film could be studied. A compartment was created by a middle microscope slide acting as a spacer for another slide on top of that. The top slide was tightly secured to the bottom metal sheet, with the spacer in between, using metal clasps. The metal base provided a convenient surface to use for focusing and depth reference. The middle microscope slide included a rectangular annulus with a center section cut out to form the closed space within which the film could be studied. The outer seams were sealed with grease and some PBS could be introduced into the space to stabilize the film against drying without being in direct contact with the film. Raman measurements were made using a Renishaw InVia confocal Raman microscope with , , , and magnifying objectives. The instrument has 532- and 785-nm lasers, and operates in reflection mode. The fluorescence microscope instrument was an LSM 710 by Carl Zeiss. 2.2.General Fringe AnalysisWith a layer of film () with a porous material () on one side and substrate () (thick quartz or polystyrene) on the other, and light incident normally from the air side, interference occurs between light passing straight through the film and light reflected at the film–quartz and film–air interfaces.4 Because the reflection coefficients are small, only the light reflected once at each interface is considered. The ratio of its electric field to that of the straight-through light is equal to which, for and , never exceeds 1%. Thus, interference between the two beams produces a sine wave whose electric field is times that of the straight-through light, so the intensity of the fringe pattern (peak to trough)4 is times that of the straight-through light. For small, this factor is approximately . Since absorbance , which is measured, is defined as , where is intensity, the difference in absorbance, maximum minus minimum, is or . Given measured , one can obtain from which the refractive index of the film may be calculated using Eq. (1), which is a quadratic equation for are shown in Fig. 1.The condition for constructive interference for a film of constant optical thickness () in normal incident, incoherent light is as follows:4 where the ½ comes from a phase shift accompanying one reflection. This condition allows interpretation of interference fringes observed in our experiments. Note that only the index inside the film determines the fringe positions independent of any changes in index of the substrate or the materials in contact with the other side of the film.Note that an absorption spectrum is measured through both sides of a cuvette so, unless one film is removed, the spectrum represents two films simultaneously. Equations (1) and (2) show that the same pattern is obtained for both films and, since is small, the interference pattern should be just the sum of those for individual films. An experiment in which a fringe pattern was measured on a film-lined cuvette, and then remeasured after the biofilm on one side of the cuvette was removed, confirmed this expectation. As one check on reproducibility, we simultaneously produced a set of five films on different identical (same production lot) polystyrene cuvettes under identical conditions/materials (90- to 110-min incubation times) and, using the observed fringe positions after the first rinse of the native films, calculated the thicknesses of the interfering layer. The standard deviation of the set of five calculated thicknesses was about 11% relative to the average thicknesses. To check the effect of stirring, experiments were conducted involving light directed in both perpendicular directions and with removal of opposing films; they showed that the thickness of simultaneously produced films on all four sides was within to 2%. We give this as a crude range because it is not possible to measure the films on perpendicular sides simultaneously or without rehydration between measurements. Thus, the thicknesses given below correspond to the analog average of the two films on opposing sides of the cuvette. 3.Results3.1.Types of Experiments and Specific Data AnalysisEquation (3) suggests two kinds of measurements, both of which are given in this paper. First, one can monitor the apparent absorption at a single wavelength as the film dries or changes in some other way so that the optical thickness changes. Results of this kind are shown in Fig. 4. The apparent absorption shows (1) a series of sinusoidal oscillations with maxima occurring when the thickness of the film satisfies Eq. (3). Each time a full oscillation is completed, i.e., for every change in phase, the film has changed its optical thickness by . Thus, by counting the fringes (maxima) as the thickness reduces due to, e.g., drying the original thickness can be calculated. We assume the index of refraction remains constant in this and the next experiment, and that the film has uniform and constant transverse extent in the region probed by the light. Second, one can measure absorption as a function of wavelength, as in Fig. 6, and find the positions of a set of consecutive absorption maxima. Fitting those to Eq. (3) allows a direct calculation of , the optical thickness of a film, assuming that the thickness does not change during the measurement of a spectrum ( to 8 min). A fractional error of less than 1% in peak position and the calculated value of is typical, giving an error of several tens of nanometers for optical thicknesses that are typically in the 2 to 5 thousand nanometer range. The physical thickness and the index of refraction cannot be calculated separately using just the positions of the maxima. They could be calculated from measurements at two different angles of incidence.6–8 This would be subject to complicating effects of finite substrate thickness that do not exist for normal incidence. More practical is the use of Eq. (1), which is a quadratic equation for , given , , and (see Fig. 1). One can also calculate from if the value of is known. Fig. 1Index of refraction of film as a function of fringe amplitude, as calculated from Eq. (3) (since 3 is a quadratic, there are two roots). Solid circles are for quartz substrate and squares for polystyrene substrate. Index of refraction of alginate , index of for quartz or 1.57 for polystyrene.  Figure 1 shows () as a function of the layer index of refraction , assuming (1) that the layer is between porous, relatively dry alginate ( assumed for the sake of illustration to be 1.2) and solid substrate ( for quartz or 1.57 for polystyrene),9,10 and (2) that is between and . (The for dry alginate is about midway between the indices of refraction of wet alginate,11–14 1.334, and air, 1.00.) We assume dry alginate because the dry layer has a smaller volume fraction of water than the layer producing fringes. We use 1.46 for the of the quartz because it is the average value for our grade of quartz10 over the wavelength range of the observed fringes. Using a different value for changes the minimum possible value of the film index but does not change the qualtitative analysis. With this set of assumptions, it appears that cannot exceed 0.004 for a quartz substrate or 0.008 for a polystyrene substrate for any reasonable value of the interfering film index of refraction. 3.2.Fringe MeasurementFigure 2 shows raw spectral data (with cuvette background subtracted) for a film produced by EC on a quartz substrate after various treatments. (These four spectra correspond to the 1st, 3rd, 8th, and 11th points in the time series shown in Fig. 7.) Because the films reduce the net reflection loss at each of the internal cuvette surfaces, the baseline subtraction of the dry cuvette leaves the difference spectrum in slightly negative absorbance in the far UV and other parts of the spectrum. However, the actual absorbance at, e.g., 1451 nm will always be referenced to the absorbance at 1310 nm, i.e., we report . The effects of lamp, grating, and detector changes needed to span the whole spectral range can be easily seen. Fig. 2Typical raw spectra of (a) native film (thin solid line), (b) the same film subsequently rinsed with PBS (dashed line), (c) after a subsequent rinse with deuterated PBS (heavy solid line), and (d) after a final PBS rinse (+ signs).  Fringes are visible in all four traces (upper inset of Fig. 2). Evidently, some types of structures that support optical interference form spontaneously when a biofilm is removed from its birthplace and is allowed to drain by gravity. Note that the fringes can be analyzed for optical thickness regardless of the artifacts mentioned above because only their positions, i.e., wavelengths are important. Also, the calculation of in Eq. (2) requires the change of absorbance across fringes, so absorbance differences between fringe maxima and adjacent fringe minima can be used to calculate the index of refraction without correcting for these artifacts. The absorbance near 3000 nm of the native film and that of the same film after a PBS rinse always exceed the dynamic range of the instrument (OD 10.00) but, after a DPBS rinse and a subsequent PBS wash, the film can be accommodated since the absorbance is reduced to about OD 2.75. The explanation is the H-to-D isotope shift accompanying exchange, which also explains the well-known15 loss in absorbance of the 1451-nm feature. The loss here is essentially total. The lower inset shows that the 1451-nm feature is shifted to 1988 nm and the 1932-nm feature is shifted to 2608 nm. In both cases, the ratio of vibrational frequencies is about 1.36, which compares well with the expected value of . Despite rinsing, the small feature between about 220 and 300 nm, associated with protein and nucleic acids, is always visible, although reduced in intensity by rinsing.16,17 The fringe patterns can be analyzed to obtain the optical thickness by fitting the peak frequencies to Eq. (3). We examined the first trace in Fig. 2 (native film) and worked with the 24 peaks with wavelengths from 381 nm through 1167 nm. To obtain the best fit to Eq. (3), we calculated wavelengths according to as functions of two parameters: the optical thickness and the value of for the peak at 321 nm ( was decreased by 1 for each subsequent peak). We then calculated the squared deviations between measured and calculated wavelengths and minimized the sum of the squared deviations with respect to the two parameters. The resulting values were and , with the sum of squared deviations being 211. For the “rinsed film,” the same analysis yielded and , with the sum of squared deviations being 1700. Plots of calculated wavelength versus measured wavelength for these data are shown in Fig. 3. Fig. 3Calculated peak position is plotted against measured peak position for three films: first graph is for native EC/LB film, middle is EC/LB after one wash, last is EC/LB after two washes. The best-fit lines are shown. Their slopes are, respectively, 1.001, 0.990, and 0.981; values are, respectively, 1.000, 0.998, and 0.999.  3.3.Single-Wavelength Timed DryingFigure 4 shows the second type of experiment: absorbance at 1451 nm was measured as a function of time. The bulk medium could be poured or sucked out and the experiment begun in 10 s or less. Subsequent measurements were made every 15 s for the four combinations of substrate and organism: quartz or polystyrene with EC or PAO1. All four display a drop in absorbance over several hours and all display fringes. Water is lost, first to draining (gravity-induced advancement of the boundary of the surface fluid) and later by evaporation. Observation of fringes requires that the index of refraction be relatively constant throughout the layer and that the thickness must not change much during the time of the measurement, i.e., 7 min per spectral scan. The single-wavelength drying experiments in Fig. 4 show the film thickness and water content change by at most only a few percent on that time scale. Furthermore, the spectral fringe data and the timed fringe data yield consistent thickness results (data not shown here). Fig. 4Absorbance at 1451 nm versus time for EC or PAO1 on quartz or polystyrene substrates. Readings were taken every 15 s. Note that the peak at 1451 nm is due to water in the film.3 Fringes are evident in each of the four traces. The apparent absorbance always reaches a minimum and, eventually, very small spikes ( absorbance units) appear, showing film cracking, as the apparent absorption loss increases due to increased scattering loss. 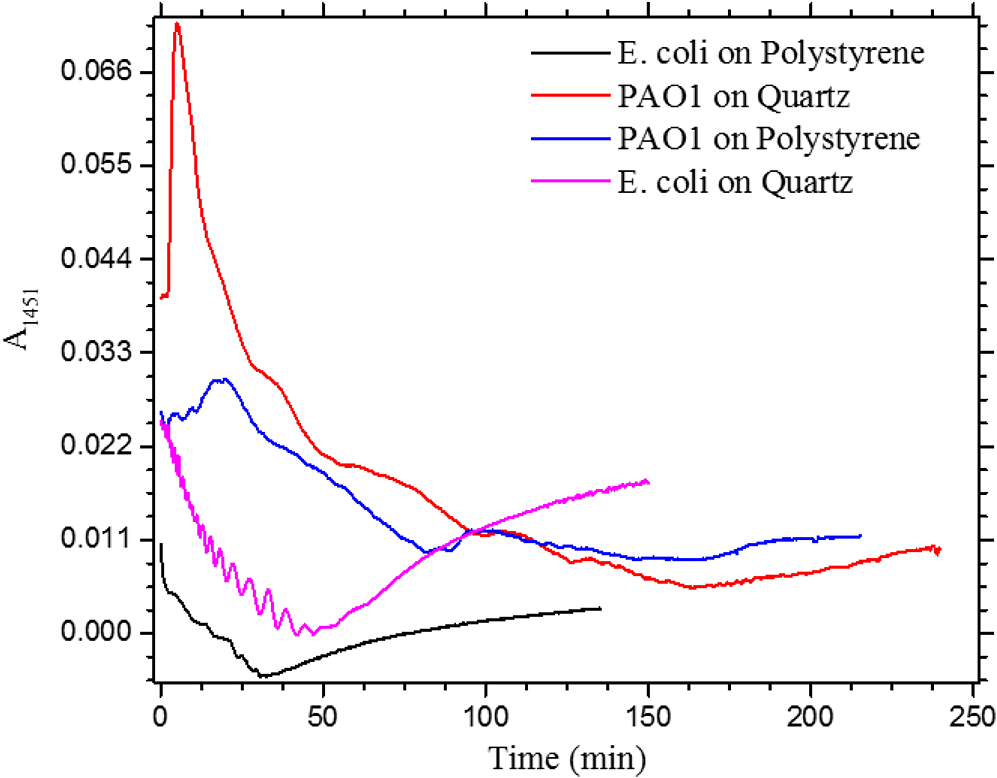 Fringes are observed later, when the interfering subsurface layer becomes thinner. Since a peak is observed each time the condition for constructive interference, Eq. (3), is satisfied, the time between consecutive peaks is the time to decrease the thickness of the layer by one wavelength of light. If all peaks are observed, the original value of is the number of maxima multiplied by [see Eq. (3)]. In the lowest plot (EC on polystyrene), seven fringes are observed, indicating an optical thickness of at least . In the second lowest (EC on quartz), 17 fringes were observed, so the thickness is at least . Figure 4 shows that, with the same substrate, PAO1 films always contain more water than EC films. When comparing the same organism, films on quartz always have more water than films deposited on polystyrene. After the time at which the absorptions of the films approach global minima, the EC and the PA01 films behave somewhat differently. In the EC films, fringes no longer appear and the absorption begins a smooth rise with high-frequency noise superimposed. This marks the beginning of the films’ cracking, as direct visual observation reveals. Cracking apparently occurs in EC films after 2000 s for polystyrene and 3100 s for quartz. Cracking does not appear to begin in PAO1 films until an additional several thousand seconds has elapsed. The EC films also display very small-amplitude fringes corresponding to the formation of uniform films with thicknesses multiples of 1451 nm, once the interfering layer is completely gone. The amplitude of these fringes is at most 10% of that of the early-time fringes. 3.4.Water Content and Film ThicknessIn Fig. 5, is plotted against the optical thickness for all films for which both could be measured. For some of the films, there were no fringes, even though was substantial, and this will be discussed below. These films involve two different organisms, two different substrates, and both LB and minimal media. The data include the results for a single film during hydration and dehydration treatments like those shown in Fig. 6. The trend line using all the data is shown: slope is absorbance units/nanometer. The small error (7%) in the slope suggests little would be gained by going to a nonlinear fit. In fact, the sum of squared deviations (calculated–measured) is 0.024 for the linear fit and 0.020 for the quadratic. For the three choices of bacteria and substrate, the slopes are , , and absorbance units/nanometer. The latter two values are statistically indistinguishable. While the first value, for EC on quartz, seems much higher, it is strongly affected by three data points out of 60, so we are not inclined to state this conclusively without more data. Fig. 5Absorbance at 1451 nm is plotted against optical thickness (from fringes) for all films for which both can be measured. films on quartz, films on polystyrene, films on quartz. Dashed line is best-fit line through origin, showing overall trend. 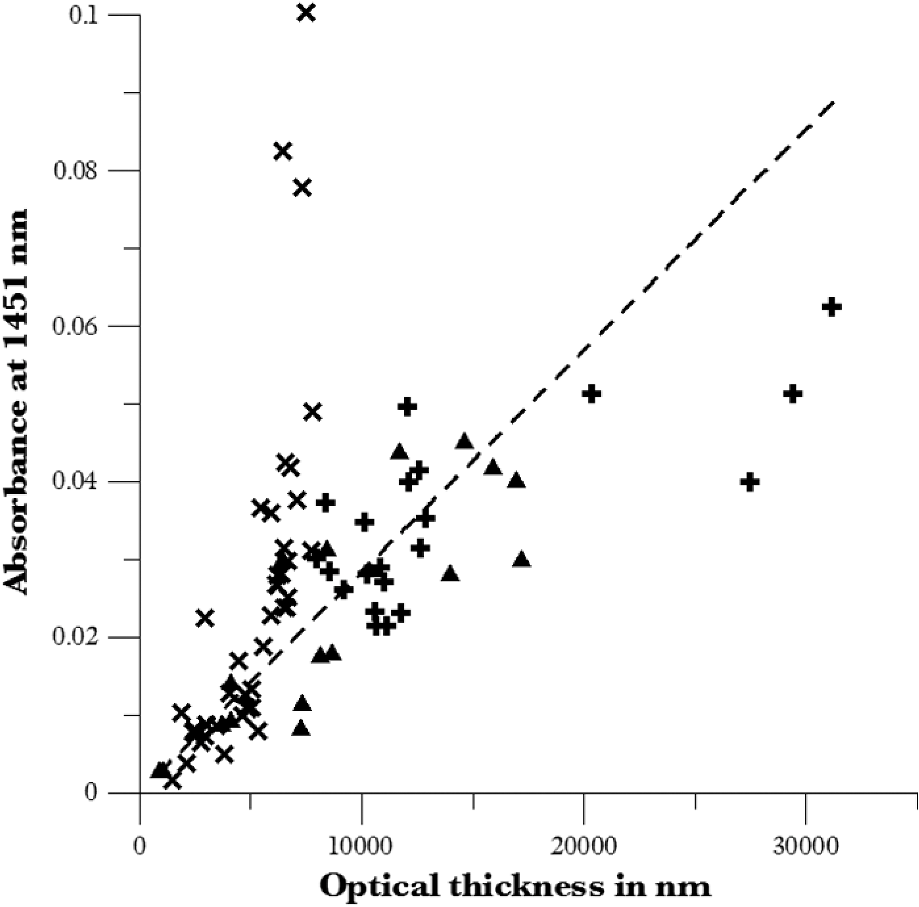 Presently, we believe that the trend line for all films is qualitatively correct, although the EC films may contain more water per unit thickness than the PA01 films. Considering all bacteria, substrates, and experimental conditions, is proportional to the optical thickness , i.e., the range of hydration level for any particular thickness is small. Thus, the water content per unit thickness is about the same regardless of (1) the species of organism, (2) the culture medium used, or (3) the choice of substrate. The effect of successive PBS rinses for the same film (EC on quartz) is shown in Fig. 6. These spectra correspond to the third, fourth, and fifth points in Fig. 7, except that in Fig. 7, one of the rinses was with DPBS. All the spectra show interference fringes. Referring to Fig. 1, note that there are two possible roots for the index of refraction of the layer for a given even given a value for . However, the interfering layers contain significant water, which has an index of 1.34, and decreases as the film dries. Therefore, we choose the higher root for and conclude that is closer to than to . Fig. 6Absorption spectra for a single film (EC on quartz) after successive rinses with PBS. The spectra correspond to the third, fourth, and fifth points in Fig. 7. The average optical thickness is for the three measurements. The 1451-nm absorbance intensity changes in unison with the thickness, as shown in Fig. 5.  Fig. 7Absorbance (dark triangles) and optical thickness calculated from fringes (dark squares) for a single film (EC on quartz) undergoing successive dryings and rehydration with PBS or DPBS (D). “Dry” indicates that the film was air dried while the previous spectrum was being collected. Between 120 and 150 min, film spectra did not have 1451-nm spectral features, so A1451 is not plotted. Two spectra, taken between 150 and 190 min, before rehydration with PBS, did not display fringes, so these points were not plotted. When the film was rehydrated with PBS, fringes were again visible. 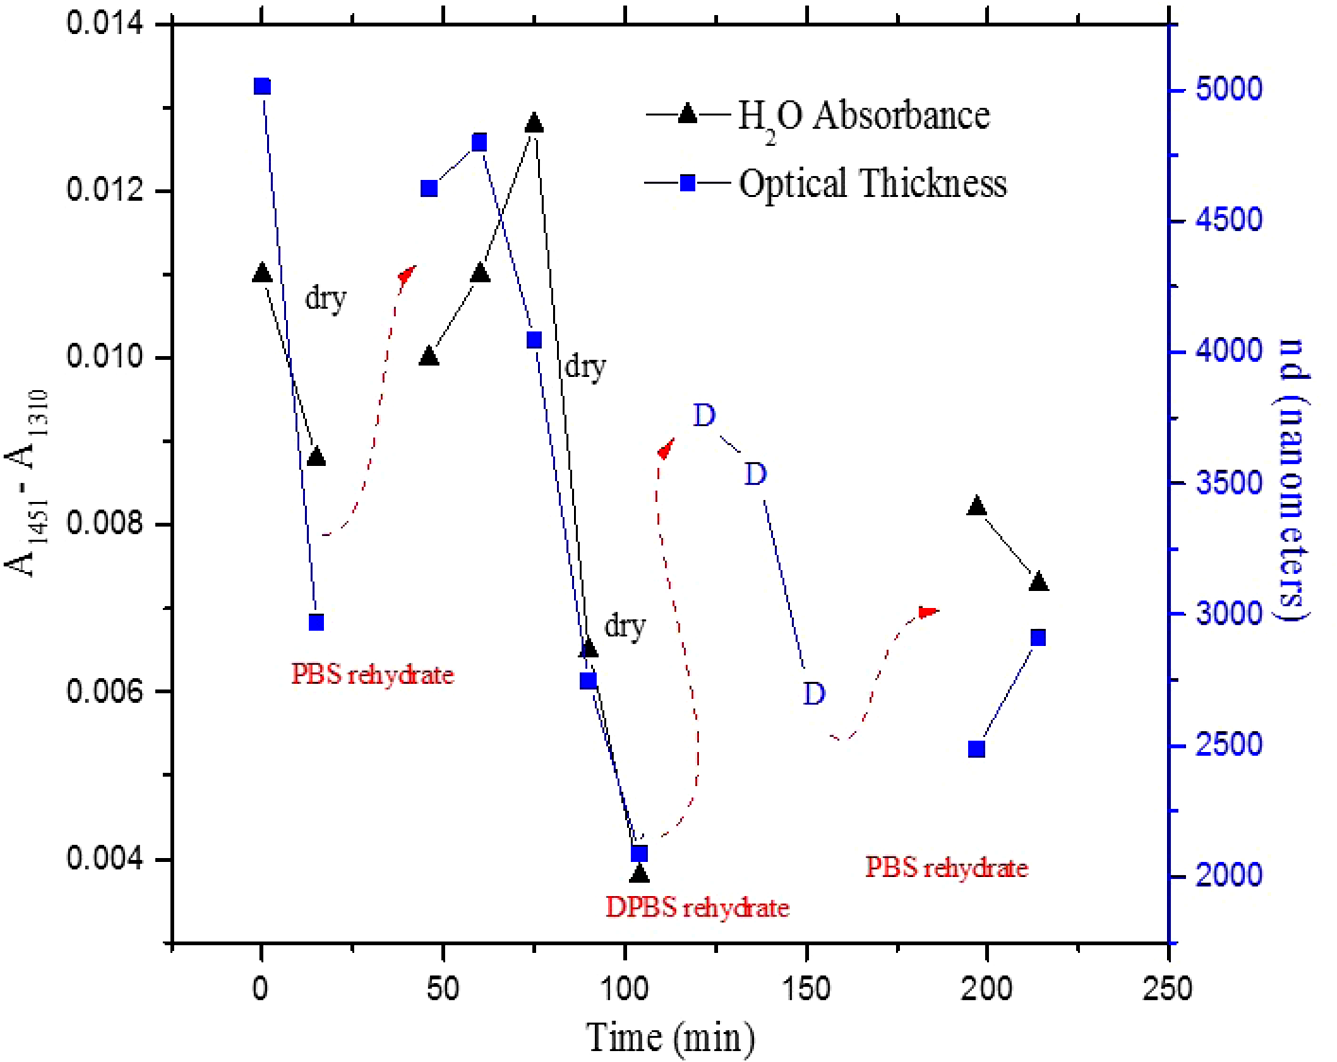 Note that the fringe spacing and the absorbance at 1451 nm are essentially unchanged by rinses after the first rinse. From the fringe spacing, the optical thickness is 4848, 4730, and 3984 nm for the three spectra, i.e., . Thus, the rinse-and-dry cycling does not affect the film’s ability to retain water. Figure 7 shows, for a film (EC on quartz) undergoing successive drying and rehydration cycles, the optical thickness calculated from the fringe positions along with the corresponding absorbance at the 1451-nm water peak. The 1451-nm absorbance intensity changes in unison with the thickness, as was noted above. These spectra are typical of many which illustrate the effects of hydration, drying, and deuteration. The successive treatments result in films being thinned by nearly a factor of 2 before being rehydrated and swelled using PBS to nearly the same initial thickness, while retaining sufficient surface smoothness and internal homogeneity to form fringes. Figure 7 shows that the absorption at 1451 nm and the optical thickness calculated from the fringes vary together. There is apparently a limit to how much water can be retained after draining since the interfering layer is never thicker than about regardless of the total thickness of the biofilm, i.e., how much carbohydrate material is present. Figure 7 shows that a film rehydrated with PBS after hydration with DPBS and air drying did not recover its full initial thickness, whereas films rinsed with only PBS did. This could reflect the cumulative effect of all the previous rinses or the disruption of the hydrogen bonded network by deuteron exchange.18 However, Fig. 6 shows that three rehydration cycles with PBS did not diminish the capacity of the film to retain water or return to its full initial thickness. Thus, the deuteron exchange is more likely responsible for the decrease shown in Fig. 7. 3.5.Alternate Measures of Film ThicknessInformation about the actual thickness of the entire biofilm is obtained from confocal optical measurements. Figure 8 shows the results of confocal fluorescence measurements (excitation wavelength of 480 nm) on a biofilm formed by PAO1-GFP on polystyrene for 24 h at 37°C. The green fluorescence indicates the presence of bacteria. The panels show the series of fluorescence images for successive depths, passing through air, biofilm, and then polystyrene. Each cross-section is . The difference in depth between successive images is . Fig. 8Confocal images with an excitation wavelength of 480 nm of PAO1-GFP biofilm formed on polystyrene surface over 24 h at 37°C. The confocal planes are for stepwise penetration of the biofilm, with spacing between successive planes of . 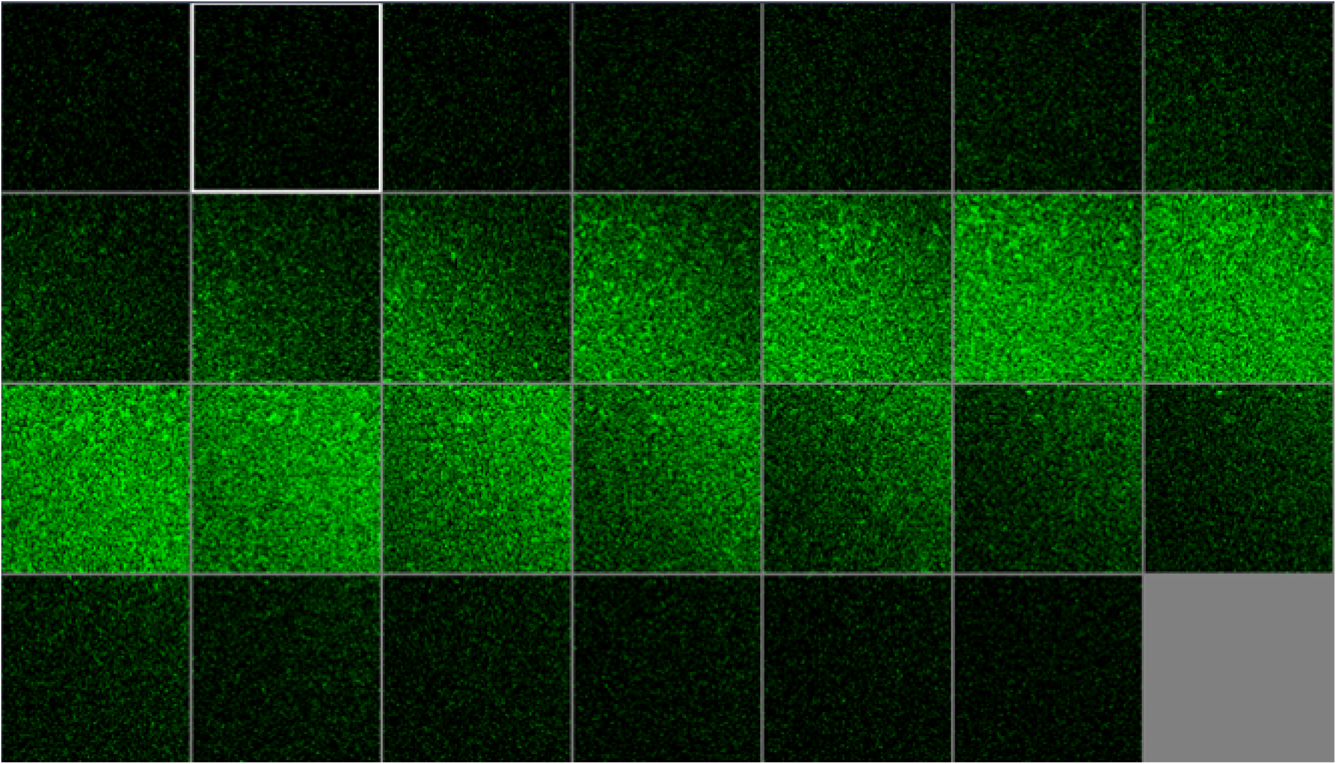 Starting in the upper left corner, the first eight images show no fluorescence above background, the ninth image shows weak (relative to the succeeding images) fluorescence, the next eight images show maximum fluorescence (all about the same), the two following show progressively decreasing fluorescence intensity, and the remaining eight show no fluorescence above background. Therefore, bacteria are present in the ninth through the 19th images, corresponding to a total thickness of about or . By curve-fitting the fluorescence intensities, we obtain a somewhat smaller thickness, i.e., . This is about 1 order of magnitude larger than the thickness of the water-rich layer as measured by thin-film interference fringes. The thickness of the bacteria-containing layer in other films, as measured by confocal fluorescence, was as high as several hundred . Still, the thickness of the water layer for these films was never larger than . Note that the thickness of the water layer is determined by how much water is retained in the films after draining and some evaporation of surface fluid. The thickness measured by confocal fluorescence is the thickness of the bacteria-containing layer in the original film. A third thickness may be obtained by confocal Raman measurements. Figure 9 shows a Raman spectrum obtained using a 532-nm excitation confocal Raman microscope of a wet biofilm (PAO1 on polystyrene), and also a Raman spectrum of dip coated film made from commercial sodium alginate on polystyrene. The PAO1-produced and sodium alginate films have multiple features in common. The relatively weak features between 1300 and , both sharp and broad, coincide with polystyrene features. More importantly, both of the spectra contain a sharp feature19 near , although the relative intensities are not the same. A strong feature with broad base peaks18 near exhibits the same behavior in depth profiles as the feature. The Raman spectra of the sodium alginate film thus suggest that biofilm is also a polysaccharide. Fig. 9532-nm excitation Raman spectrum of PAO1 biofilm and authentic sodium alginate film on polystyrene substrate.  The amount of biofilm material in a spatial region can be estimated (on a relative scale) from the intensity of the Raman peaks. In the confocal Raman measurements, the spatial regions are horizontal slices through the film at heights separated by . As for the fluorescence measurements (Fig. 8), not all locations at a particular height show the same intensity. This is consistent with the inhomogeneous nature of these films and explains the scatter in the points in Fig. 10. Fig. 10Depth profiles for two PAO1 on polystyrene biofilms, showing Raman counts (due to alginate) at various heights. Separation between successive heights is . Dashed lines are quartic fits, inserted for clarity. (a) Intensities measured from right to left, i.e., starting in air and passing through film to substrate. (b) Intensities measured from left to right.  Figure 10 shows two depth profiles obtained by confocal Raman measurements (532-nm excitation, Raman feature) on two biofilms, both PAO1 on polystyrene. One profile was obtained by starting at the air–film interface and probing successively deeper until Raman features of the substrate were observed; the other profile was obtained by going in the opposite direction, i.e., from the substrate–film interface outward to the air–film interface. Relative intensity, or concentration of biofilm material, is plotted for successive heights, from 70 to , in steps of (20 points). The dashed lines are quartic fits, inserted for emphasis. The upper plot shows that the biofilm layer is about thick, whereas the lower plot shows a thickness of about . For these films, the thickness of the layer containing bacteria, from confocal fluorescence measurements, is about . Thus, the bacteria are concentrated in a sublayer of thickness about half that of the complete biofilm (much thicker than the water-rich layer). One cannot determine from these measurements whether this sublayer is at the top, bottom, or middle of the alginate layer. 3.6.Relation to Bacterial Life CycleAdditional experiments were conducted to relate the properties of the films, such as the propensity to form an interfering layer, to the stage of bacterial life cycle during which the biofilms were produced. Six cultures were initiated simultaneously and grown in parallel and the films produced by these identical cultures were assessed, after various incubation times, for fringes and 1451-nm absorption. The results are shown in Fig. 11. One sample for the 550-min incubation was inadvertently lost. Fig. 11Results of measurement of 1451-nm absorbance that displayed fringes (dark triangles), measurement of 1451-nm absorbance that displayed no fringes (dark circles) and film thickness (dark squares) for identical films produced in parallel for various formation times. The absorbance measurement always produces a result but not all films produce interference fringes for thickness measurement.  The first observation one can make from Fig. 11 concerns the scatter in the points for larger times. The root-mean-square deviation in or in is almost as large as the mean, much larger than the experimental error, and much larger than the spread for other sets of supposedly identical films. These large variations cause some of the scatter in the data of Fig. 5 and make it important to always carry out multiple measurements on “identical” films. Another observation is that both and increase with formation time, which means the ability to retain water increases as the film is being built. The results in Fig. 11 also confirm that and increase together. More interesting is the observation that some films do not display interference fringes. Nearly all the films for the smallest incubation times, which are produced during the “lag phase,” display fringes. These are relatively thin films with correspondingly small 1451-nm absorptions. For films with incubation times between 500 and 600 min, produced during the “exponential” or stationary growth phase, no fringes are observed, although the water absorption shows that more water is present than in the films produced during the lag phase. However, for these films, the strength of the water absorption varies wildly. For even longer incubation times, extending to the late stationary or “death” phase, we observe fringes in some, but not all the films. Films showing substantial but no fringes clearly contain water, but, if a layer exists, it does not satisfy one or more of the criteria for displaying fringes. 4.DiscussionDonlan1 defines a biofilm as an “assemblage of microbial cells that is irreversibly associated with a surface…” Since much of the practical interest in biofilms lies in undermining the advantages of bacteria derived from them, we present optical and spectroscopic measurements on biofilms, grown on either a quartz (hydrophilic) or polystyrene (hydrophobic) substrate, following draining and gentle rinsing, and while drying. There are results on two different bacteria, two different substrates, and one culture medium. Film development time, synchronized with the developmental stages of the cultures, was varied, as well as stirring, rinsing, and drying conditions. The new observation presented in this work is that most of the biofilms examined, after draining to remove the growth medium, exhibit interference fringes from the UV to the NIR. To our knowledge, this has not been reported before. The physical interpretation of the fringes and the conditions necessary for their observation have been summarized above: they indicate formation of a thin layer. This layer can remain stable for minutes and hours. Its thickness, calculated unambiguously from the fringe spacing, is correlated with the strength of the NIR absorption at 1451 nm. Including isotopic shifts, the reference to the literature5,15 clearly assigns this NIR absorption feature to water. The bulk of the material comprising the biofilm is polymeric carbohydrate having a Raman spectrum much like alginate. The thickness of this material and the thickness of the region holding the bacteria are always much greater than the thickness of the interfering layer as obtained from the wavelengths of the interference fringes. This must be the case if the interfering layer is contained within the carbohydrate matrix. The formation of biofilms at interfaces (liquid-gas, solid-gas, etc.) is well documented20–22 so that the biofilm structure and behavior observed here is relevant to these situations. Since biofilms are often found at locations associated with transient wetting and drying, as in a liquid–gas interface, the “hydrology” examined in this paper is relevant to the environment bacteria experience in nature. Thus, understanding the properties of the hydrated layer helps our understanding the biology of biofilms. 4.1.Properties of Hydrated LayerThe primary concern of this paper is the relationship between the fully hydrated native biofilm in the culture medium and the hydrated interfering layer that forms in the biofilm after removal from the culture medium. The interfering layer is probably bounded by the substrate on one side and dehydrated alginate on the other for reasons presented below. The dehydrated layer-interfering layer interface is within the carbohydrate material, as represented in Fig. 12. Fig. 12Schematic diagram showing structure of biofilm at various stages. (1) Biofilm in contact with growth medium on left and substrate on right. (2) Biofilm after removal of medium and draining of surface fluid, before evaporation of interior fluid. (3) Biofilm after some of residual interior liquid has condensed into a water-rich layer adjacent to substrate (darker color). The remainder of the film is dryer than the layer (lighter color). (4) Biofilm after air drying, which thins the water-rich layer. Thicknesses are not to scale.  Measurements on films produced by various bacterial species, with various growth conditions, substrates, hydration states, and other parameters that could affect the properties of the films, show that the ability to produce an interfering hydrated layer is widespread. It is even possible to observe the formation of such layers in alginate films produced without bacteria, as will be reported in a separate publication. Thus, this ubiquitous tendency reflects the biofilm composition (polymeric carbohydrate and water) rather than being biological in origin. Note that materials exuded by the bacteria into the medium can modify the medium and the biofilm in contact with the medium, and this modification can serve the purposes of the film’s residents, i.e., the bacterial culture.16,23–26 There is apparently a limit to how thick the interfering layer can be. Its thickness, as obtained by analysis of the interference fringes, is never more than regardless of the total thickness of the biofilm. The thickness of the layer containing bacteria, from confocal fluorescence measurements, is about half that of the total film (alginate) thickness from confocal Raman spectroscopy. Thus, in the late stage of film construction, the bacteria are not found everywhere, but are concentrated in a layer about half as thick as the biofilm. It is not clear from our observations where within the film the organisms might be found, e.g., whether nearer the substrate or nearer the film–air interface. Note that PAO1 films generally retain more water than the EC films and also that the quartz-substrate films always retain more water than the polystyrene-substrate films. This is possibly associated with the more hydrophilic nature of quartz versus polystyrene and with the materials exuded by the PAO1 organisms into the fluid medium versus those exuded by EC.16,27,28 The index of refraction of the hydrated layer as determined from our data is 1.3343,10,11 quite different from that of either substrate. We expect that there will be adhesion of the bacteria to either substrate if they come close. Perhaps the bacteria can sense the presence of the substrate by the presence of the hydrated layer. 4.2.Layer FormationA possible mechanism for formation of the layer that gives interference fringes is shown in Fig. 12. Stage 1 is after the bacteria secrete an alginate or alginate-like polymeric material, which forms the bulk of the biofilm and plates out onto all contacted surfaces.16,22,29,30 This is a strongly hydrogen-bonding material, like all polysaccharides in aqueous media, due to the presence of multiple hydroxyl groups on each monomer, and is infinitely miscible with water.16,22,25 When the film is drained, bulk liquid medium is removed by gravity and evaporation, until only a thin coating exists on the surface of the alginate and some medium remains in the interior. After the surface water is gone (stage 2), the presence of water in the interior is shown by the absorption at 1451 nm (). At this point, the region closest to the air is losing water to evaporation and the water left in the interior is in the form of small droplets or perhaps individual water molecules. This water is distributed throughout the interior of the film, in channels or spaces in the carbohydrate framework.16,31,32 In this form, the water cannot show interference fringes, since there is no layer. Because of the extensive hydrogen bonding between water and the bulk carbohydrate in the film, we propose that the material in the interior does not begin to lose water until essentially all the surface water is gone. Subsequent to the loss of surface water, water molecules continue to leave the film by evaporation. Simultaneously, water molecules in the interior move in all directions until, because of surface tension, smaller droplets coalesce into larger ones, which are more stable. The movement may be by evaporation–condensation, diffusion on interior surfaces, or other mechanisms. Eventually, the larger coalesced droplets distort because of the planarity of the substrate, the biofilm and surface tension, into a layer which can show fringes. This is illustrated as stage 3 in Fig. 12. Air drying removes water from the drained biofilm, which means mainly from the water-rich layer. It is likely that, because of hydrogen bonding, some water remains distributed over the internal surfaces of the film, and probably is difficult to remove without affecting the film’s structure. As shown experimentally, the thickness of the water-rich layer decreases as the water content of the film decreases, with the index of refraction remaining constant. This is shown as stage 4 in Fig. 12. Another explanation for formation of the thin, water-rich layer after draining of the film is based on the well-known fact that biofilms are not uniform. Zhang and Bishop33 showed that from the top (free surface) to the bottom of a biofilm, the porosity decreases by a factor of 2 and the mean pore size by a factor of 5. Thus, movement of water in the lower layers is (1) much more difficult than movement of water in the upper layers and (2) is confined to moving parallel to the substrate surface. Thus, water may remain in the lower layers after the upper layers have been depleted of water. The movement of fluid parallel to the substrate encourages the formation of a film with the same orientation. Surface tension will further stabilize this situation and help create a smooth enough surface to allow interferences to be observed. To estimate how much water must leave the hydrated biofilm before the stable interfering layer forms, we estimate the index of refraction of the relatively dry alginate side of the interface. For observable fringes, it is necessary that the index of refraction of the layer differ from the indices of refraction of the phases bounding it, presumably relatively dry alginate ( between 1.00 and 1.334, the index for hydrated alginate)10,11 and solid substrate (, ).6,7 Since for the fringes decreases as the film dries, the higher value is chosen for in Fig. 1. Thus, the index of refraction of the film is always closer to the index of refraction of the substrate than to that of dry alginate. With this information, absorbance spectra, such as those in Fig. 6, can be used to calculate one index of refraction when two others are known, based on Eq. (1). We first calculate near 600 nm by subtracting the average absorbance at two adjacent minima from the absorbance at the included maximum. The results for are 0.00170, 0.00194, and 0.00154 for the three interference patterns shown in Fig. 6. The closeness of the three results (average 0.00173 and standard deviation 0.00020) confirms our finding that a dried film can be fully rehydrated. Since these spectra were taken through a cuvette, so that the beam passes through two identical films, the actual for one film is half what one measures in the spectrum, i.e., 0.00086. Since spectroscopic and other evidence indicates that the film is essentially hydrated alginate, its index is close to 1.334, the index for hydrated alginate,10,11 only slightly higher than . The substrate is quartz, with .7 Solving Eq. (1) with gives . This “dry” alginate (the remainder of the biofilm when the water-rich layer has formed adjacent to the substrate) probably still contains some water. Since the index of refraction of air-filled void spaces is close to 1.00, one can calculate the void volume fraction from , which gives . The index of refraction remains relatively constant as the layer becomes thinner or thicker with drying or rehydration. Note that the classical index of refraction in a nonmagnetic material is the square root of the material dielectric constant, from Maxwell’s equations.34,35 Thus, the dielectric environment of the hydrated carbohydrate film is virtually identical to that of water itself. 4.3.Biological ImplicationsWhen a film is removed from the liquid in which it is immersed, the organism-friendly environment inside a biofilm is preserved in the interfering water-rich layer, which has a dielectric constant similar to that of the hydrated film. Since the dielectric constant of a material governs its response, i.e., the reorientation and redistribution of charge caused by an electric field, we suggest that the surface charge distribution of bacteria36,37 is not perturbed when the bacteria traverse spatial regions with the same dielectric environment. Bacterial movement within and between the surrounding mostly aqueous liquid and the fully hydrated film is, therefore, facile and without physiological consequence.16,30,31 If the surface charge density of bacteria interacts with the local environment, it may cause adhesion and impeded motion of the bacteria through the medium.38,39 In Fig. 5, in which the variation of with is shown, the thickness of the layer producing fringes is proportional to the amount of water present, reinforcing the notion that the interfering layer is a hydrated alginate-like material. Furthermore, the hydration within the interfering layer is relatively unchanged during the drying/thinning process since (1) the index of refraction remains the same and (2) the hydrated films thin as they lose water. The constant of proportionality between and may depend on the substrate, the bacteria and the conditions of biofilm formation. For the three choices of bacteria and substrate shown in Fig. 5, the slopes are , , and (all in absorbance/nm). Considering results for individual films during treatments like those described in Fig. 7, i.e., a single film at various levels of hydration, the proportionality is excellent. The same is true for many other films, with different values for other parameters, observed at varying levels of hydration. However, the apparent water content per unit thickness is roughly the same regardless of (1) the species of organism, (2) the culture medium used, or (3) the choice of substrate. When native PAO1 films on polystyrene showing an interfering water layer 10 to thick were soaked in 5M NaCl for 30 min, they were found to be swelled by as much as 30%. Fringe analysis indicated that the hydrated layer in these films expanded by 30% to 50%. We note that the ability to draw fluid, i.e., salt water, as observed for these films, is known for alginate aerogels/hydrogels.40 Rinsing experiments with various species such as divalent metals like might prove interesting given their potential role in conventional hydrogels as cross linkers.41–43 Since these films are able to sequester water and possibly also NaCl from relatively concentrated aqueous salt solutions, the exchange of protons for protons is facile and nondestructive. The exchange of protons for deuterons is also facile and partly reversible, but possibly somewhat destructive of the film’s internal structure.18 This is apparent in Fig. 7: films hydrated with PBS and then dried and rehydrated retain the same amount of water after draining, whereas films hydrated with DPBS before drying and rehydration with PBS retain significantly less. The hydration/dehydration sequence, either by direct immersion in liquid/draining or vapor deposition/evaporation, may dilute the nonstructural components of the hydrated layer. Note that the first rinse of a native film with PBS always reduces the strength of the 180 nm and 240 to 260 nm absorptions, but that these features are never completely removed even after four PBS washing cycles. RNA, DNA, and proteins are well known to absorb in these spectral regions.15,16,29,44,45 Some of these materials and also smaller molecules can be redistributed by rinsing, and the biofilm matrix can protect some of them from being removed.16 A series of films was formed in parallel with identical cultures and under identical conditions, and sampled at different times of culture development. As shown in Fig. 11, almost every film cultured for less than 300 min produced, when drained, a water layer showing interference fringes (17 films). The thickness of the layer was proportional to the water absorbance intensity , as is generally found to be true. The fringe spacing shows that these are among the thinnest films produced, with correspondingly small 1451-nm absorptions. Strikingly, of the 10 films cultured for times between 500 and 700 min, none produced an interfering water layer, although was of the expected size. For culture times between 800 and 900 min, 2 of the 10 films produced an interfering water layer. Thus, when the bacteria are most active, during exponential growth and active reproduction, at least one of the criteria for forming an interfering layer is not satisfied. Furthermore, the film structures existing at these later times are highly variable, as indicated by the large variation in their capacity to sequester water. The absence of observable fringes implies that something prevents the water, which is certainly present, from coalescing into a planar layer. This may be the structure of the biofilm: perhaps the internal pores are blocked, too narrow, or too tortuous to allow rearrangement of the water. It may also be the bacteria, which may block pores.30,31 Also, if organisms produce an extracellular matrix with a chemical structure that produces large, internal, Swiss cheese-like voids, it might preclude the observation of optical interference. Another explanation is that films sampled during or after the growth phase contain more and larger channels and voids, due to the larger numbers of bacteria or their increased activity that impede the formation of the water layer.30,31,35,36,46,47 Further study might lead to a method for assaying bacterial cultures by observing their activities at different stages of development. In an open system, the stability of the two-layer structure is extended by the slow rate of gas transport through the relatively dry outer material, i.e., the Knudsen effect.48 Some alginate films11 dried using supercritical fluids to produce aerogels and hydrogels have been shown to have a porous structure with internal cavities smaller than the mean free path of air molecules. Because mass transport is slow, evaporation is slow, and since the entire carbohydrate layer can be hundreds of microns thick, at least some of the layer structure is maintained as water in the interfering layer evaporates, extending the lifetime of that layer. The materials of the bacteria exude tend to produce a structure that can sequester water, thus enhancing their survivability when water is scarce.16,27,29,41 The evidence suggests that, with respect to accommodating the needs of a bacterial culture, the interfering layer closely resembles the original hydrated immersed film. It thus may help to protect the culture when the film is dehydrated, providing a stable environment for the bacteria. 5.ConclusionsWe have discovered that most biofilms produced before a bacterial culture’s exponential growth phase, when removed from the aqueous growth medium and drained to remove bulk medium, spontaneously produce an internal two-layer structure. Similar films produced during the exponential growth phase, when the bacteria are expected to be most physically active, generally do not produce a two-layer structure. A thin layer having an index of refraction higher than that of dry porous alginate (the principal component of the biofilm) is formed from the water remaining after draining. This layer, which is adjacent to the solid substrate, displays optical interference across the UV-visible-NIR region, showing that it is of uniform optical thickness and has an index of refraction different from both the substrate and the relatively dry porous alginate. The optical thickness and the degree of hydration can be obtained unambiguously from the optical interference fringes, providing unique quantitative physical and chemical information on this hydrated layer. As the film dries by evaporation, the layer maintains its properties, although it becomes thinner. Formation of the layer occurs with all organisms tested and various growing conditions and so may be more dependent on the chemical nature of alginate than on bacterial processes. The layer is a separate phase, distinct from the remainder of the film, which has the same carbohydrate matrix but with about 30% to 40% less water per unit volume than the layer. We speculate that the environment in the interfering layer is similar to that of the original medium-immersed alginate, suggesting that the layer provides a protective environment for bacteria when water is scarce. DisclosuresNo conflicts of interest, financial or otherwise, are declared by the authors. There are no competing interests. AcknowledgmentsWe are grateful for the assistance of Professor Luk and his lab for producing confocal fluorescence microscopic data as well as allowing use of the infrastructure needed to obtain the data in this paper. We also appreciate many conversations about the analysis and meaning of the data. Similarly, we appreciate the contribution of Professor Tara Kahan for the confocal Raman apparatus and conducting the measurements. ReferencesR. M. Donlan,
“Biofilms: microbial life on surfaces,”
Emerg. Infect. Dis., 8 881
–890
(2002). http://dx.doi.org/10.3201/eid0809.020063 Google Scholar
B. Vu et al.,
“Bacterial extracellular polysaccharides involved in biofilm formation,”
Molecules, 14
(7), 2535
–2554
(2009). http://dx.doi.org/10.3390/molecules14072535 Google Scholar
T. C. Mah and G. A. O’Toole,
“Mechanisms of biofilm resistance to antimicrobial agents,”
Trends Microbiol., 9
(1), 34
–39
(2001). http://dx.doi.org/10.1016/S0966-842X(00)01913-2 Google Scholar
M. Born and E. Wolf, Principles of Optics, Pergamon Press, Fairview Park, New York
(1980). Google Scholar
H. Büning-Pfaue,
“Analysis of water in food by near infrared spectroscopy,”
Food Chem., 82 107
–115
(2003). http://dx.doi.org/10.1016/S0308-8146(02)00583-6 Google Scholar
D. Tonova, A. Paneva and B. Pantchev,
“Determination of refractive index profiles of gradient optical waveguides by ellipsometry,”
Opt. Commun., 150 121
–125
(1998). http://dx.doi.org/10.1016/S0030-4018(98)00094-7 Google Scholar
T. E. Jenkins,
“Multiple-angle-of-incidence ellipsometry,”
J. Phys. D: Appl. Phys., 32 R45
–R56
(1999). http://dx.doi.org/10.1088/0022-3727/32/9/201 JPAPBE 0022-3727 Google Scholar
R. Todorov, A. Paneva and K. Petkov,
“Optical characterization of thin chalcogenide films by multiple-angle-of-incidence ellipsometry,”
Thin Solid Films, 518
(12), 3280
–3288
(2010). http://dx.doi.org/10.1016/j.tsf.2009.09.002 THSFAP 0040-6090 Google Scholar
S. Sultanova and I. N. Kasarova,
“Dispersion properties of optical polymers,”
Acta Phys. Pol. A, 116 585
–587
(2009). http://dx.doi.org/10.12693/APhysPolA.116.585 ATPLB6 0587-4246 Google Scholar
“Specifications of Cell Window Materials,”
(2017) http://www.starnacells.com/d_tech/tech_05_specs.html February ). 2017). Google Scholar
S. D. Ravi Prakash et al.,
“Miscibility studies of sodium alginate/poly(vinyl alcohol) blend in water by viscosity, ultrasonic, and refractive index methods,”
J. Appl. Polym. Sci., 90 33
–39
(2003). http://dx.doi.org/10.1002/(ISSN)1097-4628 Google Scholar
P. Prasad et al.,
“Investigation on miscibility of sodium alginate/pullulan blends,”
J. Polym. Environ., 20 887
–893
(2012). http://dx.doi.org/10.1007/s10924-012-0427-4 Google Scholar
Ó. Esteban, F. Marvá and J. C. Martínez-Antón,
“Optical constants of a sodium alginate polymer in the UV-vis range,”
Opt. Mater., 31
(4), 696
–699
(2009). http://dx.doi.org/10.1016/j.optmat.2008.08.003 OMATET 0925-3467 Google Scholar
G. Herzberg, Infrared and Raman Spectra, Van Nostrand, Princeton, New Jersey
(1960). Google Scholar
F.-X. Schmid,
“Biological macromolecules: UV-visible spectrophotometry,”
Encyclopedia of Life Sciences, Wiley-Blackwell, Hoboken, New Jersey
(2001). Google Scholar
B. Christophe, A. Roux and J. Ghigo,
“Escherichia coli biofilms,”
Current Topics in Microbiology and Immunology, 322 249
–289 Springer, Heidelberg, New York
(2008). Google Scholar
S. Scheiner and M. Čuma,
“Relative stability of hydrogen and deuterium bonds,”
J. Am. Chem. Soc., 118
(6), 1511
–1521
(1996). http://dx.doi.org/10.1021/ja9530376 JACSAT 0002-7863 Google Scholar
A. T. Tu, Raman Spectroscopy in Biology: Principles and Applications, Wiley-Interscience Publication, Fort Collins, Colorado
(1982). Google Scholar
T. Kawarai et al.,
“Biofilm formation by Escherichia coli in hypertonic sucrose media,”
J. Biosci. Bioeng., 107
(6), 630
–635
(2009). http://dx.doi.org/10.1016/j.jbiosc.2009.01.018 JBBIF6 389-1723 Google Scholar
T. Coenye and H. J. Nelis,
“In vitro and in vivo model systems to study microbial biofilm formation,”
J. Microbiol. Methods, 83 89
–105
(2010). http://dx.doi.org/10.1016/j.mimet.2010.08.018 JMIMDQ 0167-7012 Google Scholar
A. J. McBain,
“Chapter 4: in vitro biofilm models: an overview,”
Adv. Appl. Microbiol., 69 99
–132
(2009). http://dx.doi.org/10.1016/S0065-2164(09)69004-3 Google Scholar
X. Zogaj et al.,
“The multicellular morphotypes of Salmonella typhimurium and Escherichia coli produce cellulose as second component of the extracellular matrix,”
Mol. Microbiol., 39 1452
–1463
(2001). http://dx.doi.org/10.1046/j.1365-2958.2001.02337.x MOMIEE 0950-382X Google Scholar
U. Römling, M. Gomelsky and M. Y. Galperin,
“Cyclic di-GMP: the first 25 years of a universal bacterial second messenger,”
Microbiol. Mol. Biol. Rev., 77
(1), 1
–52
(2013). http://dx.doi.org/10.1128/MMBR.00043-12 MMBRF7 1092-2172 Google Scholar
H. Weber et al.,
“Cyclic-di-GMP mediated signaling within the network of Escherichia coli,”
Mol. Microbiol., 62 1014
–1034
(2006). http://dx.doi.org/10.1111/mmi.2006.62.issue-4 MOMIEE 0950-382X Google Scholar
Y. Itoh et al.,
“Roles of pgaABCD genes in synthesis, modification, and export of the Escherichia coli biofilm adhesion poly-beta-1, 6-N-acetyl-D-glucosamine,”
J. Bacteriol., 190 3670
–3680
(2008). http://dx.doi.org/10.1128/JB.01920-07 JOBAAY 0021-9193 Google Scholar
E. E. Mann and D. J. Wozniak,
“Pseudomonas biofilm matrix composition and niche biology,”
FEMS Microbiol. Rev., 36
(4), 893
–916
(2012). http://dx.doi.org/10.1111/j.1574-6976.2011.00322.x Google Scholar
M. Ghannoum and G. A. O’Toole, Microbial Biofilms: Introduction to Biofilms: Conceptual Themes, ASM Press, Washington, DC
(2004). Google Scholar
R. J. Redfield,
“Is quorum sensing a side effect of diffusion sensing?,”
Trends Microbiol., 10 365
–370
(2002). http://dx.doi.org/10.1016/S0966-842X(02)02400-9 TRMIEA 0966-842X Google Scholar
M. Starkey et al., Microbial Biofilms: Chapter 10: A Sticky Business: the Extracellular Polymeric Substance Matrix of Bacterial Biofilms, ASM Press, Washington, DC
(2004). Google Scholar
J. W. Costerton et al.,
“Microbial biofilms,”
Annu. Rev. Microbiol., 49 711
–745
(1995). http://dx.doi.org/10.1146/annurev.mi.49.100195.003431 ARMIAZ 0066-4227 Google Scholar
R. Bakke and P. Q. Olsen,
“Biofilm thickness measurements by light microscopy,”
J. Microbiol. Methods, 5 93
–98
(1986). http://dx.doi.org/10.1016/0167-7012(86)90005-9 JMIMDQ 0167-7012 Google Scholar
T. C. Zhang and P. L. Bishop,
“Density porosity and pore structure of biofilms,”
Water Res., 28
(11), 2267
–2277
(1994). http://dx.doi.org/10.1016/0043-1354(94)90042-6 WATRAG 0043-1354 Google Scholar
M. Born and E. Wolf, Principles of Optics, Pergamon Press, Fairview Park, New York
(1980). Google Scholar
W. H. Flygare, Molecular Structure and Dynamics, Prentice-Hall, Englewood Cliffs, New Jersey
(1978). Google Scholar
A. T. Poortinga et al.,
“Electric double layer interactions in bacterial adhesion to surfaces,”
Surf. Sci. Rep., 47 1
–32
(2002). http://dx.doi.org/10.1016/S0167-5729(02)00032-8 SSREDI 0167-5729 Google Scholar
C. Marlière and S. Dhahrib,
“An in vivo study of electrical charge distribution on the bacterial cell wall by atomic force microscopy in vibrating force mode,”
Nanoscale, 7 8843
–8857
(2015). http://dx.doi.org/10.1039/C5NR00968E Google Scholar
J. Adler and B. Templeton,
“The effect of environmental conditions on the motility of Escherichia coli,”
J. Gen. Microbiol., 46
(2), 175
–184
(1967). http://dx.doi.org/10.1099/00221287-46-2-175 JGMIAN 0022-1287 Google Scholar
C. D. Amsler, M. Cho and P. Matsumura,
“Multiple factors underlying the maximum motility of Escherichia coli as cultures enter post-exponential growth,”
J. Bacteriol., 175
(19), 6238
–6244
(1993). http://dx.doi.org/10.1128/jb.175.19.6238-6244.1993 JOBAAY 0021-9193 Google Scholar
R. R. Mallepally et al.,
“Superabsorbent alginate aerogels,”
J. Supercrit. Fluids, 79 202
–208
(2013). http://dx.doi.org/10.1016/j.supflu.2012.11.024 Google Scholar
K. Y. Lee and D. J. Mooney,
“Alginate: properties and biomedical applications,”
Prog. Polym. Sci., 37
(1), 106
–126
(2012). http://dx.doi.org/10.1016/j.progpolymsci.2011.06.003 PRPSB8 0079-6700 Google Scholar
J. Sun and H. Tan,
“Alginate-based biomaterials for regenerative medicine applications,”
Materials, 6 1285
–1309
(2013). http://dx.doi.org/10.3390/ma6041285 Google Scholar
H. Zheng, I. V. Korendovych and Y. Y. Luk,
“Quantification of alginate by aggregation induced by calcium ions and fluorescent polycations,”
Anal. Biochem., 492 76
–81
(2016). http://dx.doi.org/10.1016/j.ab.2015.09.016 ANBCA2 0003-2697 Google Scholar
I. W. Sutherland,
“The biofilm matrix–an immobilized but dynamic microbial environment,”
Trends Microbiol., 9 222
–227
(2001). http://dx.doi.org/10.1016/S0966-842X(01)02012-1 TRMIEA 0966-842X Google Scholar
A. P. White et al.,
“Extracellular polysaccharides associated with thin aggregative fimbriae of Salmonella enterica serovar enteritidis,”
J. Bacteriol., 185 5398
–5407
(2003). http://dx.doi.org/10.1128/JB.185.18.5398-5407.2003 JOBAAY 0021-9193 Google Scholar
A. R. Rice, M. A. Hamilton and A. K. Camper,
“Movement, replication, and emigration rates of individual bacteria in a biofilm,”
Microb. Ecol., 45
(2), 163
–172
(2003). http://dx.doi.org/10.1007/s00248-002-1028-x MCBEBU 1432-184X Google Scholar
C. Picioreanu et al.,
“Microbial motility involvement in biofilm structure formation–a 3D modelling study,”
Water Sci. Technol., 55 337
–43
(2007). http://dx.doi.org/10.2166/wst.2007.275 WSTED4 0273-1223 Google Scholar
B. Notario et al.,
“Experimental validation of the Knudsen effect in nanocellular polymeric foams,”
Polymer, 56 57
–67
(2015). http://dx.doi.org/10.1016/j.polymer.2014.10.006 Google Scholar
BiographyJerry Goodisman is professor emeritus of physical chemistry at Syracuse University, where he has been since 1969. He has published over two hundred articles and four monographs on subjects including quantum mechanics, statistical mechanics, electrochemistry, and chemical kinetics. Most recently he has been engaged in research on the mechanism of action of anticancer drugs, the agglomeration process, and the properties of biofilms. Joseph Chaiken has been at Syracuse University since 1982 and he is now a professor of chemistry and adjunct professor of bioengineering. Having published roughly 100 articles on subjects ranging from the first observation of electronic-vibrational quantum interferences in polyatomic molecules to the first use of noninvasive in vivo Raman spectroscopy to monitor blood glucose in humans, He is most recently interested in the quantitative spectroscopy of turbid media, the properties of biofilms, and coalescence growth processes. |


