|
|
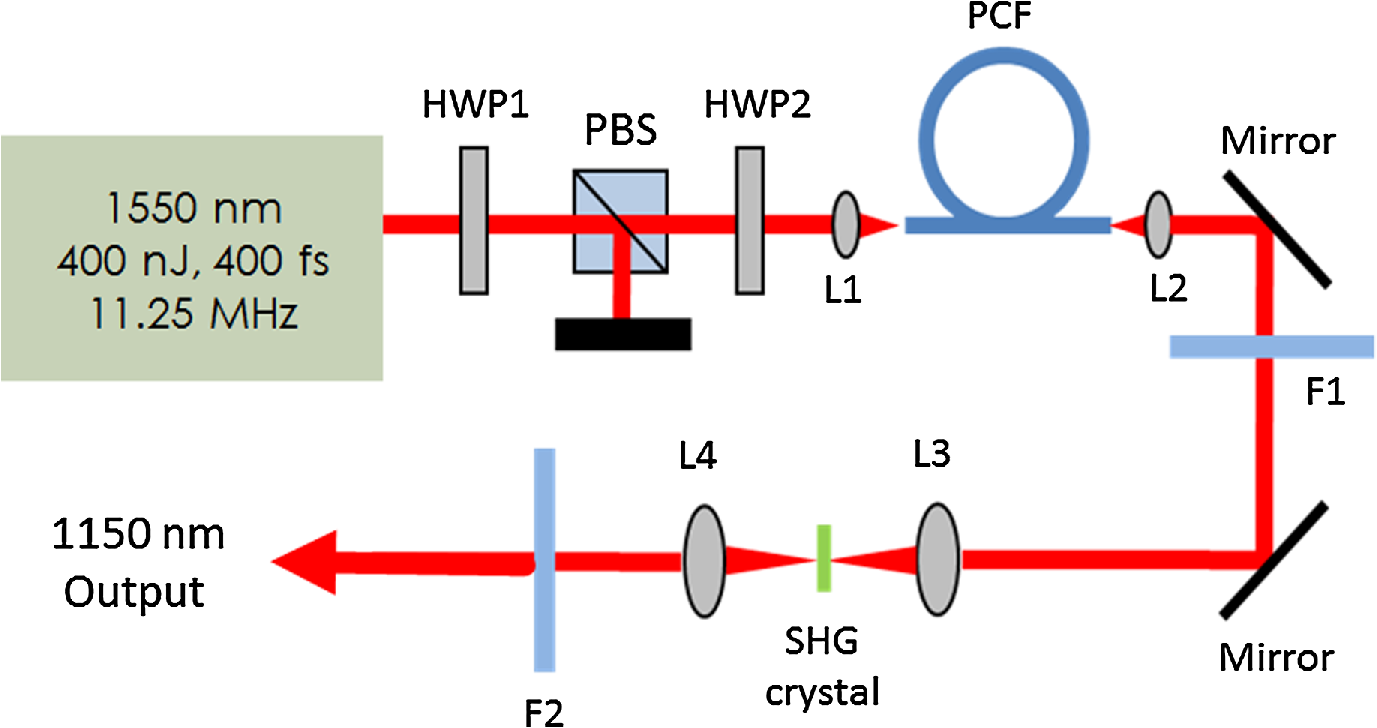
1.IntroductionA biopsy is an important procedure for clinical diagnosis. Pathologists examine the tissues removed from lesions to determine whether or not diseases are present and help medical doctors make treatment decisions. However, the traditional biopsy process has a limited sampling area and may cause some side effects such as infection or cancer metastasis.1 Moreover, the inspection of excised tissues requires a long and labor-consuming process of fixation, occlusion, histology section, dye staining, and mounting. Although intraoperative frozen-section analysis offers faster processing time ( per section), the accuracy is still poorer than paraffin-embedded histology.2,3 There is an unmet clinical need to develop a least-invasive and time-saving method to produce accurate and large field-of-view histopathology images. With the invention of confocal microscopy,4 histopathological-grade sectioning images from thick tissues can be noninvasively acquired with a submicron three-dimensional spatial resolution. Without any labeling, the contrast relies on the autofluorescence of endogenous pigments and backreflected photons due to scattering or refractive index heterogeneity. Excited at a 1000- to 1300-nm infrared wavelength, the imaging depth can be extended to at the cost of losing autofluorescence contrast and degraded lateral resolution. This kind of optical virtual biopsy tool can save preparation time and allow doctors to make a quick pathological examination in vivo or ex vivo on freshly excised tissues. Exploiting the interference contrasts, optical coherence tomography (OCT) improves the imaging depth to 1 to 2 mm at the cost of lateral resolution (10 to ).5 The OCT modality is suitable for the large field-of-view ranging on the layered tissues, but the lateral resolution is not enough for visualizing subcellular details, which is critical for the histopathological diagnosis. With the advance of ultrafast lasers, the nonlinear optical microscopy, such as multiphoton fluorescence microscopy,6 second harmonic generation (SHG) microscopy, and third harmonic generation (THG)7 microscopy, was developed. Because the yields of nonlinear optical signals depend nonlinearly on the excitation intensity, only the area at the location around the focus can generate detectable signals, thus providing the intrinsic sectioning capability. Compared with the multiphoton fluorescence microscopy, the SHG and THG microscopies have less molecular information but provide more morphological information that can be recognized in traditional histopathology.8 The SHG contrast can reveal collagen networks,9 and the THG contrast can outline cellular structures via its sensitivity to lipids.10,11 The high-spatial-resolution and deep-tissue imaging capability of such harmonic generation microscopy (HGM) make it an emerging and powerful virtual biopsy modality complementary to multiphoton fluorescence microscopy. By far, the HGM have been widely applied to the investigation of human skin and mucosa,12–14 assessment of atopic dermatitis,15 diagnoses of oral squamous cell carcinoma,16 characterizations of skin aging,17 morphological analysis on human adipocytes,18 live brain imaging of neurons,19 and the in vivo cytometry on leukocytes.20–22 Since the biological tissues have severe scattering at visible wavelengths and strong water absorption at wavelengths longer than 1300 nm,23 people commonly adopt 800 to 1300 nm femtosecond laser sources for deep-tissue optical virtual biopsy.13,24–29 In the 800- to 1100-nm wavelength range, many endogenous pigments such as flavins can be two-photon excited.30 Their autofluorescence can serve as valuable contrasts to reveal the morphology and distribution of cells. For HGM, a higher excitation intensity for THG is required, and the two-photon absorption of endogenous fluorophores may result in on-focus photodamage. Therefore, the suitable wavelength range for HGM should be longer within 1100 to 1300 nm. Moreover, the second overtone absorption band of the lipid stretching modes lies within 1150 to 1250 nm, which can resonantly enhance the THG signals.11 To generate intense 1150- to 1250-nm femtosecond laser pulses, people often use a femtosecond Cr:forsterite laser (1230 to 1250 nm) or a femtosecond Ti:sapphire laser cascaded with an optical parametric oscillator. However, the performance of these laser systems is sensitive to the temperature change, and they need more maintenance efforts. For routine clinical use, stable and high-pulse-energy laser sources are highly desired. The phenomenon of soliton self-frequency-shift (SSFS) in optical fibers was first discovered31 in 1986 and has been applied to generating wavelength-tunable femtosecond laser sources.32–35 By an excitation of high-power Yb:fiber33,36–40 or Ti:sapphire41 femtosecond lasers in dispersion-zero shifted photonic crystal fiber (PCF), several groups have demonstrated the redshift of solitons to the 1150- to 1250-nm wavelength range. They demonstrate the possibility of using fiber laser for the development of stable 1150- to 1250-nm femtosecond lasers. Although the Yb:fiber-laser-based SSFS or supercontinuum sources can excite two-photon fluorescence and SHG contrast, the pulse energy and pulse width performance are not sufficient for the in vivo THG imaging. Typically, before the imaging system, 5-nJ pulse energy at an 100-fs pulse width is required to achieve a good enough THG contrast in vivo.12–14 Limited by the small core diameter of the dispersion-zero shifted PCF, most of those femtosecond SSFS solitons can only sustain sub-nJ to 2 nJ pulse energies, which are not sufficient for the in vivo HGM. Although Fang et al.38 and Yao et al.40 have demonstrated pulse energies at this wavelength range, they did not perform in vivo HGM to validate their capability in the optical virtual biopsy. Recently, using a high-power Er:fiber femtosecond laser () and a large mode area PCF, Xu’s group generated energetic SSFS solitons tunable from 1580 to 2130 nm with a pulse energy up to 45 nJ.42 After efficient () frequency-doubling, the three-color (775, 865, and 950 nm) near-infrared femtosecond laser source can be applied to the multilabel multiphoton fluorescence microscopy in vitro.43 This approach employs a large mode area PCF to overcome the limitation of soliton energies. Although 1550 nm is longer than 1250 nm, high-energy SSFS solitons can be efficiently frequency-doubled to the wavelength band that the Ti:sapphire laser covers. Nevertheless, it is still difficult to achieve 1150- to 1250-nm wavelengths due to the strong absorption around 2200 nm in the fused silica,44 which impedes the longest possible wavelength of SSFS solitons.45 The four-wave-mixing-based optical parametric oscillator can deliver energetic, tunable, chirped femtosecond pulses at 1200- to 1300-nm wavelengths,46 but the 560-fs pulse width was not short enough to generate THG signals efficiently. In this paper, we develop a stable fiber-based femtosecond laser around 1150 nm with 6.5-nJ pulse energy, 86-fs pulse width, and 11.25-MHz pulse repetition rate. It was achieved by a bismuth borate (BIBO) or magnesium-doped periodically poled lithium niobate (MgO:PPLN) mediated frequency doubling of 2300-nm SSFS solitons generated from the excitation of a moderate mode area PCF with a high-power 1550-nm femtosecond laser. For this unique source, we built a tailor-made laser scanned microscope and constructed a pulse-per-pixel data acquisition card. As a whole, we validate its feasibility to perform in vivo HGM. This integrated biomedical HGM system is useful for routine clinical use. 2.Experimental Setup and Animal Handling2.1.Fiber-Based 1150-nm Femtosecond Laser SourceThe generation of the 1150-nm femtosecond laser source is a process of SSFS, followed by frequency doubling (Fig. 1). The initial pump source is a high pulse energy (400 nJ) Er:fiber femtosecond laser (Calmar, FLCPA-01C) operating at 1550 nm. The excitation pulses have a 7.5-MHz (or 11.25 MHz) repetition rate and a 400-fs pulse width. To control the input laser power focused on the fiber, the combination of a half-wave plate and a polarization beam splitter (PBS) were used. The power level after PBS can be controlled by rotating the optical axis of the first half-wave plate (HWP1 in Fig. 1). In front of the fiber, another half-wave plate (HWP2 in Fig. 1) was placed for aligning the polarization of the laser to the optical axis of the polarization-maintaining large mode area PCF (NKT Photonics, LMA-PM-15) with a mode field diameter of . Using an aspheric lens (L1 in Fig. 1) with a 18.4-mm focal distance (Thorlabs, C280TMD-C), the highest achievable fiber coupling efficiency was 75%. At the output of the fiber, a calcium fluoride lens (L2 in Fig. 1) with a 40-mm focal distance was used (Thorlabs, LA5370-D) to collimate the output beam. The 2250-nm long pass filter (F1 in Fig. 1) with 94% transmission at 2300 nm was inserted to select the most redshifted soliton. For obtaining the laser pulses around 1150 nm, the 2300-nm solitons were focused in an SHG crystal. The SHG crystals we used include a 1-mm-thick BIBO and a 1-mm-thick magnesium-doped periodically poled lithium niobate (MgO:PPLN). At the end of the laser source system, an 1150-nm bandpass filter (F2 in Fig. 1) with 80% transmission at 1150 nm was placed to eliminate the 2300-nm solitons. The laser spectrum was analyzed by an infrared spectrometer (A.P.E., WaveScan) with a measuring range of 1000 to 2600 nm. 2.2.Harmonic Generation Microscopy SystemThe 1150-nm laser beam was raster-scanned by an 8-kHz resonant scanning mirror (Cambridge Technology, 1-003-3002509) and a galvanometer mirror (Cambridge Technology, 6215HM40B). The scanning of these two mirrors was synchronized by a counter circuit board designed to receive the line clock from the resonant scanner and generate the ramp signals to drive the galvanometer mirror via the control board (Cambridge, 671215H-1HP). Data sampling of each line was arranged in each half period () of the resonant scanning. For imaging, the resulted frame rate was 30 Hz. A telescope, consisting of a pair of convex lenses, was placed between the scanning unit and the objective (Olympus, UAPON 40XW340) for beam expansion and relay. When the scanning mirrors were at rest, the laser beam was normally incident on the center of both lenses. The expanded beam size fit the back aperture of the objectives. When the mirrors started to scan, divergently sweeping rays of laser beams became parallel to each other after the first lens and then converged to the back aperture of the objective after the second lens. A multiphoton dichroic beam splitter (Chroma, 750DCSPXR) was inserted between the objective and the telescope to reflect the exciting 1150 nm laser and allow the transmission of nonlinear optical signals. As the laser beam was focused on the specimens, the generated SHG () and THG () signals were epicollected by the same objective, transmitted through the multiphoton dichroic beam splitter, and further focused by a lens (OptoSigma, SLSQ-25-80P) onto the photomultiplier tubes (PMTs) (Hamamatsu, H7732). The SHG and THG signals were separated by a dichroic beam splitter (Semrock, FF506-Di03-). The appropriate band-pass filters (Thorlabs, MF390-18 and Chroma, ) were inserted in front of the PMTs to block undesired background signals. As the focused laser beam takes a raster scan on the specimen point by point, two PMTs detected the generated nonlinear optical signals, and the photocurrents were transmitted to the data acquisition system to show the two-dimensional images. Compared with conventional high repetition rate (50 to 100 MHz) femtosecond lasers, the pulse repetition rate of this unique 1150-nm femtosecond source was relatively low. The synchronization of the data sampling with the laser pulses is required. To coordinate the timing among laser pulses, scanners, and the data acquisition, we constructed a frame grabber based on a field programmable array (FPGA) card (Terasic, Artera DE4) and wrote an image acquisition program. Two trans-impedance amplifiers (Hamamatsu, C6438-01) with 50-MHz bandwidth converted the photocurrent from PMTs into voltage signals. Then, the analog signals were digitized at a 14-bit pixel depth by an analog-to-digital convertor on the FPGA card. On the other hand, the global clock of the FPGA was synchronized to the laser pulses through a phase lock loop module. The time-delay of the sampling clock can be adjusted to meet the timing of the analog HGM signals from PMTs, so the amplitudes of the sampled signals can be maximized. The line and frame synchronization signals from these two axes were also sent to the FPGA card for the reconstruction of images in the computer. Finally, HGM images with fields of view were acquired and shown on the screen of the computer at a 30-Hz frame rate. 2.3.Animal Model and AnesthesiaThe live animals we used for HGM in vivo imaging were ICR mice purchased from the Animal Center of National Taiwan University Hospital. The study followed the protocols reviewed by the Animal Care and Use Committee of National Taiwan University Hospital (IACUC-NTUH) under the case number 20120028. Regarding anesthesia, isoflurane was used in our experiment for its effectiveness, lack of side-effects, and rapid wash-out in continuous time-course imaging and prolonged experimental observations. We concurrently maintained the body temperature with a small warm bag during the entire period when the mice were under anesthesia until recovery. 3.ResultsIn the light source development, we first operated the 1550-nm femtosecond laser at a 7.5-MHz pulse repetition rate. Using a lens, we focused and coupled the 1550-nm laser pulses () into a polarization-maintaining large mode area PCF. Since the dispersion of a normal fiber is negative at 1550 nm, this femtosecond excitation can generate solitons and further induce SSFS. The amount of frequency shift is dependent on the excitation power and the length of the fiber.47 Shorter fiber requires higher excitation power to achieve the same wavelength of the most redshifted solitons. The corresponding pulse energies at that wavelength will thus be increased (Fig. 2). Previously, pumped by 400 nJ pulses, the wavelength of the most redshifted solitons could reach 2130 nm in a core-diameter PCF.42 In our core-diameter PCF, stronger nonlinear optical processes push the solitons to a wavelength longer than 2200 nm (Fig. 2). With similar coupling efficiency, the 2300-nm solitons can be achieved by only 240 nJ of pulse energy. After frequency doubling with a BIBO crystal, we found the shorter fiber generates a higher average power [Fig. 3(a), blue squares]. Fig. 2The relation between the wavelength of fundamental soliton and input power for difference length fibers.  Fig. 3(a) The output power (blue square) and the corresponding pulse width (black square) of the 1150-nm femtosecond sources. (b) Autocorrelation traces of the 1150-nm femtosecond sources, which is generated by the SHG of 2300-nm solitons from a different length of fibers.  Characterized by the autocorrelation measurement, we found that the pulse width of the 1150 nm source reached a minimum of 86 fs at the length of 0.6 m [Fig. 3(b)]. However, the pulse width became longer in the 0.5-m PCF, which might be due to the spectral overlap between the most redshifted solitons and other solitons. The spectrum of the most redshifted solitons from the 0.6-m PCF separates more from those of others [Fig. 4(a)]. Passing a 2250-nm long pass filter, the resulted soliton spectrum has a 2300-nm peak and an 86-nm bandwidth [Fig. 4(b)]. After SHG, the 1150-nm femtosecond source has a 21-nm bandwidth [Fig. 5(a)] and an 86-fs pulse width, assuming a hyperbolic secant pulse shape [Fig. 5(b)]. The time-bandwidth product is 0.41, indicating that some dispersion was introduced to the pulses in the process of SHG in BIBO. We thus chose 0.6-m PCF for further optimization. At this fiber length, the average power of the 2300 nm solitons was 130 mW, and the SHG power was 12.6 mW. The conversion efficiency was just 9.7%. To improve the efficiency, we used the quasi-phase-matching technique to obtain a stronger SHG output. The periodically poled material we chose was magnesium-oxide (MgO) doped lithium niobate (LN), which has a strong coefficient for SHG. The MgO:PPLN crystal has a poling period and a thickness of 1 mm. At room temperature, the power of the SHG was raised to 49 mW, corresponding to a 6.5-nJ pulse energy. Fig. 4The spectra of (a) solitons in a 0.6-m photonics crystal fiber. (b) The 2300-nm soliton spectrum after passing the 2250-nm long pass filter. 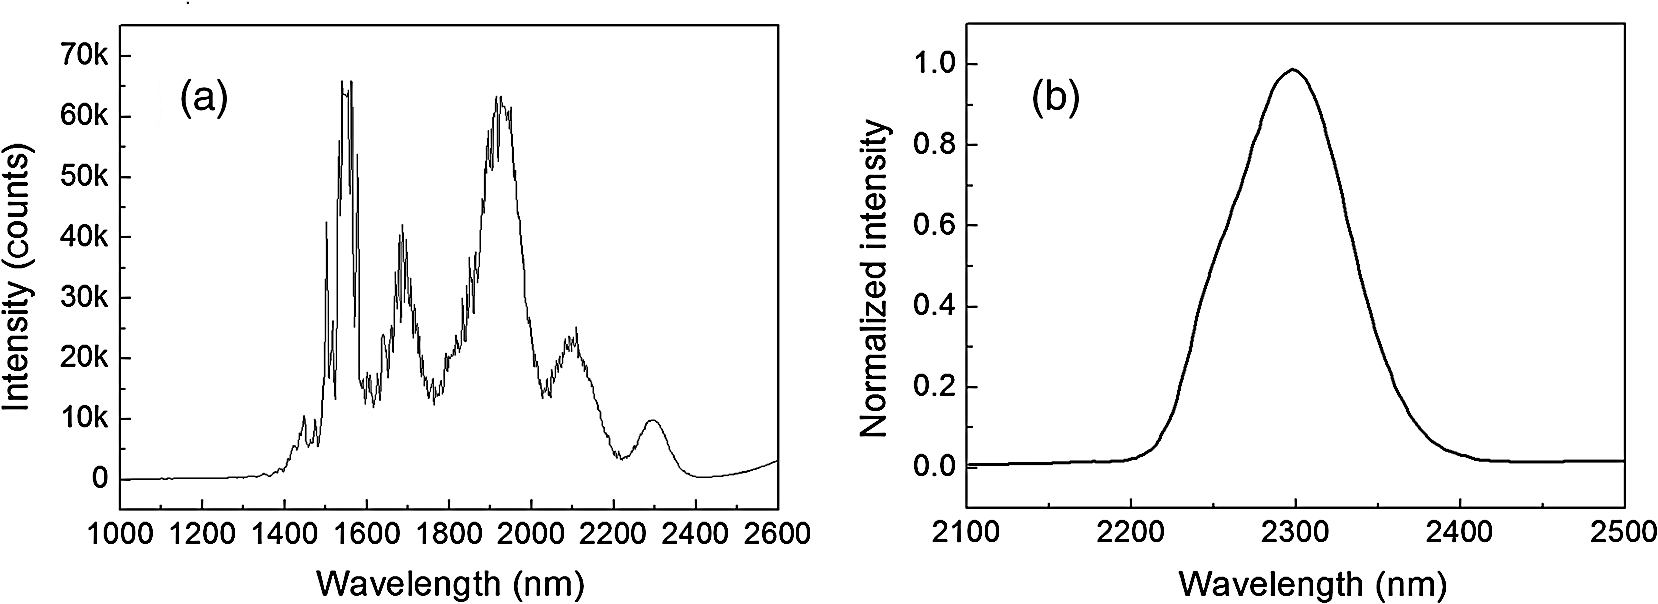 Then we guided the laser beam into the home built laser scanning microscope for the in vivo HGM imaging. To obtain 512 data points within a line period of the 8-kHz resonant scanner, we increased the repetition rate of the 1550-nm laser up to 11.25 MHz. The corresponding 88.89-ns pulse repetition period was still longer than the impulse response time of a 50-MHz bandwidth trans-impedance amplifier. The pulsed HGM signals will return to background level within a pulse repetition period, which means the time point of data sampling needs to synchronize with the laser pulses to acquire optimal signals in digitization. In this case, only one laser excitation contributes the signals in each pixel. Controlling the electronic time delay on a FPGA card, we synchronized the time point of data sampling with the pulsed HGM signals. According to the average SHG intensities of the collagen imaging, we found the optimal delay time (Fig. 6). Fig. 6The SHG images of a collagen sample at an electronic delay of (a) , (b) , (c) 0 ns, (d) 4.4 ns, (e) 8.8 ns, and (f) 13.2 ns. The corresponding pixel average intensities are 4909, 19,043, 22,405, 18,981, 12,740, and 3945, respectively. Fields of view: .  Due to the system loss, the output pulse energy after the objective was decreased to 1.87 nJ. This energy level is below the calculated breakdown threshold of 10 nJ in biological tissues.48 Considering an focal spot size and 100-fs pulse width, the instantaneous irradiance of our imaging system was about , which is also below the water breakdown threshold ().48 Since Débarre et al.49 reported a possible damage of 1.57 nJ pulses () on the embryo development in the course of THG imaging, we still evaluated the photodamage effects by performing in vivo SHG microscopy on the collagen network of the mice ears. If there are thermal damages caused by the laser illumination, the collagen will be denatured and the average SHG intensity will be greatly decreased. In a 2-min continuous illumination, no obvious structural change was observed [Fig. 7(a)], nor did the average SHG intensity [Fig. 7(b)]. Therefore, it is certain that our operation energy level and focusing irradiance will not cause obvious tissue damage. Fig. 7(a) The montage SHG images of collagen in the mice ear continuously acquired for 120 s and (b) the corresponding average SHG intensity in each frame.  Using this developed light source and pulse-per-pixel imaging system, we acquired tomographic images in vivo from the ear pinna of a healthy ICR mouse. The mouse was anesthetized and handled similarly to our previous work.21 The THG contrasts (Fig. 8, magenta color) can reveal epidermal keratinocytes [Fig. 8(a)] and sebaceous glands in the dermis layer. The nuclei of keratinocytes can be clearly resolved. Four glands can be identified, as shown in Fig. 8(b). On the other hand, the SHG contrasts can reveal the collagen network beneath the layer of keratinocytes. Both the SHG and THG signals could be obtained at a depth deeper than . Taking a closer view around the sebaceous gland, we can capture the flowing red blood cells in the vessel [Fig. 8(e), 9, 10]. Due to a directional flow of blood, the disc-shaped red blood cells tend to stick together. Since the flowing direction of blood lay on the imaging plane, the THG sectioning image revealed the cross-sectional features of the red blood cells. These in vivo imaging results demonstrate that our pulse-per-pixel HGM system can acquire not only clear anatomical structures and subcellular morphologies but also fast biological events such as the flowing of red blood cells. Fig. 8(a–d) The combined SHG (green) and THG (magenta) images of mice ears in vivo. The depth from the skin surface: (a) 0, (b) 20, (c) 40, and (d) . Fields of view: . (e) The THG image of flowing red blood cells in the vessel of a mouse. Field of view: . 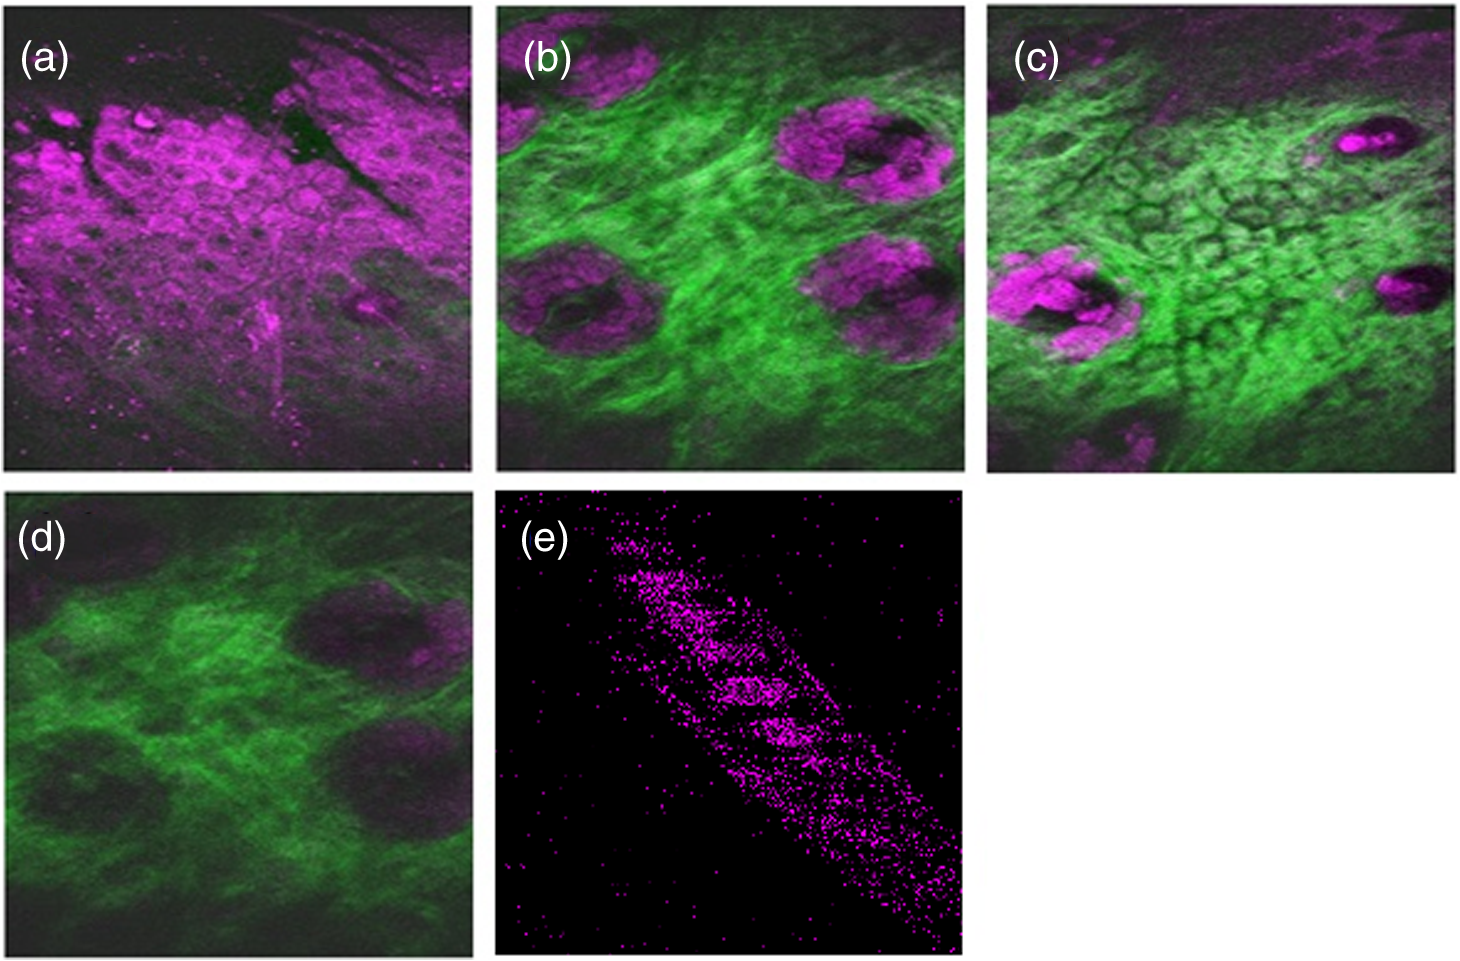 Fig. 9The THG movie of flowing blood cells in mice ear (location 1). Field of view: (Video 1 MPEG, 111 KB [URL: http://dx.doi.org/10.1117/1.JBO.22.3.036008.1]).  Fig. 10The THG movie of flowing blood cells in mice ear (location 2). Field of view: (Video 2 MPEG, 441 KB [URL: http://dx.doi.org/10.1117/1.JBO.22.3.036008.2]).  4.Discussion and ConclusionThe SSFS processes in the larger mode area PCF fiber can be divided into two regimes (Fig. 2). At low excitation power, the fundamental soliton shifted rapidly as the input power increased. When the wavelength of the fundamental soliton shifted to 1800 nm, affected by the rising absorption of waters in the fiber after 1750 nm,44 it took more input power to shift the same amount of frequency. In addition, the attenuation of the soliton energy will reduce the nonlinear effect of self-phase modulation and broaden the pulse width.50 That is why we obtained broader pulses for longer 0.8- and 1.2-m PCF. Although a core-diameter PCF may obtain 2300-nm solitons under an excitation of level pulse energy, the repetition rate has to be lowered to 1-MHz level, which is inadequate for high frame rate HGM in vivo. The solution we provide here just fits all the requirements of high-speed HGM. On the other hand, conventional femtosecond solid-state lasers have 50- to 110-MHz pulse repetition rates. There are 5 to 10 pulse excitations within a pixel dwell time. Due to a slower impulse response (20 to 30 ns) of the 50-MHz trans-impedance amplifier, responses from 2 to 3 pulses were integrated together. Although we only have one pulse per pixel, the 6.5-nJ pulse energy before the imaging system is higher than the typical 5 nJ, which can contribute 2.2 times higher THG signals for each pulse. As a result, the contrast quality was still good enough for video-rate in vivo THG microscopy. In conclusion, using a high power 1550-nm femtosecond laser and a 0.6-m long PCF with core-diameter, we successfully generated 2300-nm solitons by SSFS and obtained a stable 1150-nm femtosecond source through the SHG with MgO:PPLN. We can achieve 6.5-nJ pulse energy and 86-fs pulse width at an 11.25-MHz repetition rate, which is promising for high-speed virtual optical biopsy with HGM. Combined with pulse-per-pixel imaging and data acquisition system, we demonstrated video-rate HGM in vivo and successfully captured the flowing red blood cells. This integrated solution, together with our SSFS source in 800 to 1100 nm,43 has the potential to be developed as a stable virtual optical biopsy system for routine clinical use. AcknowledgmentsWe acknowledge Sheng-Lung Huang’s Laboratory for helping with the fiber preparation. This work was supported in part by the Ministry of Science and Technology, Taiwan, under Grand No. NSC 102-2221-E-002-195-MY3, and the National Health Research Institutes under Grand No. NHRI-EX104-10427EI. We would also like to thank the support from the Faculty of Health Sciences, University of Macau. ReferencesB. R. Masters, G. Gonnord and P. Corcuff,
“Three-dimensional microscopic biopsy of in vivo human skin: a new technique based on a flexible confocal microscope,”
J. Microsc., 185
(Pt 3), 329
–338
(1997). http://dx.doi.org/10.1046/j.1365-2818.1997.d01-624.x JMICAR 0022-2720 Google Scholar
D. M. Layfield et al.,
“Intraoperative assessment of sentinel lymph nodes in breast cancer,”
Br. J. Surg., 98
(1), 4
–17
(2011). http://dx.doi.org/10.1002/bjs.v98.1 Google Scholar
L. C. Liu et al.,
“Intraoperative frozen section analysis of sentinel lymph nodes in breast cancer patients: a meta-analysis and single-institution experience,”
Cancer, 117
(2), 250
–258
(2011). http://dx.doi.org/10.1002/cncr.v117.2 CANCAR 0008-543X Google Scholar
M. Minsky,
“Memoir on inventing the confocal scanning microscope,”
Scanning, 10 128
–138
(1988). http://dx.doi.org/10.1002/sca.v10:4 SCNNDF 0161-0457 Google Scholar
E. A. Swanson et al.,
“In vivo retinal imaging by optical coherence tomography,”
Opt. Lett., 18
(21), 1864
–1866
(1993). http://dx.doi.org/10.1364/OL.18.001864 OPLEDP 0146-9592 Google Scholar
W. Denk, J. H. Strickler and W. W. Webb,
“Two-photon laser scanning fluorescence microscopy,”
Science, 248
(4951), 73
–76
(1990). http://dx.doi.org/10.1126/science.2321027 SCIEAS 0036-8075 Google Scholar
S. W. Chu et al.,
“Multimodal nonlinear spectral microscopy based on a femtosecond Cr:forsterite laser,”
Opt. Lett., 26
(23), 1909
–1911
(2001). http://dx.doi.org/10.1364/OL.26.001909 OPLEDP 0146-9592 Google Scholar
Y. K. Tao et al.,
“Assessment of breast pathologies using nonlinear microscopy,”
Proc. Natl. Acad. Sci. U. S. A., 111
(43), 15304
–15309
(2014). http://dx.doi.org/10.1073/pnas.1416955111 Google Scholar
P. J. Cmapagnola and L. M. Loew,
“Second-harmonic imaging microscopy for visualizing biomolecular arrays in cells, tissues and organisms,”
Nat. Biotechnol., 21
(11), 1356
–1360
(2003). http://dx.doi.org/10.1038/nbt894 NABIF9 1087-0156 Google Scholar
D. Débarre et al.,
“Imaging lipid bodies in cells and tissues using third-harmonic generation microscopy,”
Nat. Methods, 3
(1), 47
–53
(2006). http://dx.doi.org/10.1038/nmeth813 1548-7091 Google Scholar
Y. C. Chen et al.,
“Third harmonic generation susceptibility spectroscopy in free fatty acids,”
J. Biomed. Opt., 20
(9), 095013
(2015). http://dx.doi.org/10.1117/1.JBO.20.9.095013 JBOPFO 1083-3668 Google Scholar
S. Y. Chen, H. Y. Wu and C. K. Sun,
“In vivo harmonic generation biopsy of human skin,”
J. Biomed. Opt., 14
(6), 060505
(2009). http://dx.doi.org/10.1117/1.3269676 JBOPFO 1083-3668 Google Scholar
S. Y. Chen et al.,
“In vivo virtual biopsy of human skin by using noninvasive higher harmonic generation microscopy,”
IEEE J. Sel. Top. Quantum Electron., 16
(3), 478
–492
(2010). http://dx.doi.org/10.1109/JSTQE.2009.2031987 IJSQEN 1077-260X Google Scholar
M. R. Tsai et al.,
“In vivo optical virtual biopsy of human oral mucosa with harmonic generation microscopy,”
Biomed. Opt. Express, 2
(8), 2317
–2328
(2011). http://dx.doi.org/10.1364/BOE.2.002317 BOEICL 2156-7085 Google Scholar
J. H. Lee et al.,
“Noninvasive in vivo assessment of epidermal hyperkeratosis and dermal fibrosis in atopic dermatitis,”
J. Biomed. Opt., 14
(1), 014008
(2009). http://dx.doi.org/10.1117/1.3077182 JBOPFO 1083-3668 Google Scholar
M. R. Tsai et al.,
“Characterization of oral squamous cell carcinoma based on higher-harmonic generation microscopy,”
J. Biophoton., 5
(5–6), 415
–424
(2012). http://dx.doi.org/10.1002/jbio.v5.5/6 Google Scholar
Y. H. Liao et al.,
“Quantitative analysis of intrinsic skin aging in dermal papillae by in vivo harmonic generation microscopy,”
Biomed. Opt. Express, 5
(9), 3266
–3279
(2014). http://dx.doi.org/10.1364/BOE.5.003266 BOEICL 2156-7085 Google Scholar
C. K. Tsai et al.,
“Virtual optical biopsy of human adipocytes with third harmonic generation microscopy,”
Biomed. Opt. Express, 4
(1), 178
–186
(2013). http://dx.doi.org/10.1364/BOE.4.000178 BOEICL 2156-7085 Google Scholar
S. Witte et al.,
“Label-free live brain imaging and targeted patching with third-harmonic generation microscopy,”
Proc. Natl. Acad. Sci. U. S. A., 108
(15), 5970
–5975
(2011). http://dx.doi.org/10.1073/pnas.1018743108 Google Scholar
C. K. Chen and T. M. Liu,
“Imaging morphodynamics of human blood cells in vivo with video-rate third harmonic generation microscopy,”
Biomed. Opt. Express, 3
(11), 2860
–2865
(2012). http://dx.doi.org/10.1364/BOE.3.002860 BOEICL 2156-7085 Google Scholar
C. K. Tsai et al.,
“Imaging granularity of leukocytes with third harmonic generation microscopy,”
Biomed. Opt. Express, 3
(9), 2234
–2243
(2012). http://dx.doi.org/10.1364/BOE.3.002234 BOEICL 2156-7085 Google Scholar
C. H. Wu et al.,
“Imaging cytometry of human leukocytes with third harmonic generation microscopy,”
Sci. Rep., 6 37210
(2016). http://dx.doi.org/10.1038/srep37210 SRCEC3 2045-2322 Google Scholar
R. R. Anderson and J. A. Parrish,
“The optics of human skin,”
J. Invest. Dermatol., 77
(1), 13
–19
(1981). http://dx.doi.org/10.1111/1523-1747.ep12479191 JIDEAE 0022-202X Google Scholar
S. González and Z. Tannous,
“Real-time, in vivo confocal reflectance microscopy of basal cell carcinoma,”
J. Am. Acad. Dermatol., 47
(6), 869
–874
(2002). http://dx.doi.org/10.1067/mjd.2002.124690 JAADDB 0190-9622 Google Scholar
G. J. Tearney et al.,
“In vivo endoscopic optical biopsy with optical coherence tomography,”
Science, 276
(5321), 2037
–2039
(1997). http://dx.doi.org/10.1126/science.276.5321.2037 SCIEAS 0036-8075 Google Scholar
S. W. Chu et al.,
“In vivo developmental biology study using noninvasive multi-harmonic generation microscopy,”
Opt. Express, 11
(23), 3093
–3099
(2003). http://dx.doi.org/10.1364/OE.11.003093 OPEXFF 1094-4087 Google Scholar
K. König, U. Simon and K. J. Halbhuber,
“3D-resolved two-photon fluorescence microscopy of living cells using a modified confocal laser scanning microscope,”
Cell Mol. Biol., 42
(8), 1181
–1194
(1996). Google Scholar
A. Zoumi, A. Yeh and B. J. Tromberg,
“Imaging cells and extracellular matrix in vivo by using second-harmonic generation and two-photon excited fluorescence,”
Proc. Natl. Acad. Sci. U. S. A., 99
(17), 11014
–11019
(2002). http://dx.doi.org/10.1073/pnas.172368799 Google Scholar
S. Tang et al.,
“Developing compact multiphoton systems using femtosecond fiber lasers,”
J. Biomed. Opt., 14
(3), 030508
(2009). http://dx.doi.org/10.1117/1.3153842 JBOPFO 1083-3668 Google Scholar
W. R. Zipfel et al.,
“Live tissue intrinsic emission microscopy using multiphoton-excited native fluorescence and second harmonic generation,”
Proc. Natl. Acad. Sci. U. S. A., 100
(12), 7075
–7080
(2003). http://dx.doi.org/10.1073/pnas.0832308100 Google Scholar
F. M. Mitschke and L. F. Mollenauer,
“Discovery of the soliton self-frequency shift,”
Opt. Lett., 11
(10), 659
–661
(1986). http://dx.doi.org/10.1364/OL.11.000659 OPLEDP 0146-9592 Google Scholar
N. Nishizawa and T. Goto,
“Widely wavelength-tunable ultrashort pulse generation using polarization maintaining optical fibers,”
IEEE J. Sel. Top. Quantum Electron., 7
(4), 518
–524
(2001). http://dx.doi.org/10.1109/2944.974222 IJSQEN 1077-260X Google Scholar
H. Lim et al.,
“Fibre-based source of femtosecond pulses tunable from 1.0 to ,”
Electron. Lett., 40
(24), 1523
–1525
(2004). http://dx.doi.org/10.1049/el:20047091 ELLEAK 0013-5194 Google Scholar
F. W. Wise,
“Femtosecond fiber lasers based on dissipative processes for nonlinear microscopy,”
IEEE J. Sel. Top. Quantum Electron., 18
(4), 1412
–1421
(2012). http://dx.doi.org/10.1109/JSTQE.2011.2179919 IJSQEN 1077-260X Google Scholar
H. Tu and S. A. Boppart,
“Coherent fiber supercontinuum for biophotonics,”
Laser Photon. Rev., 7
(5), 628
–645
(2013). http://dx.doi.org/10.1002/lpor.2013.7.issue-5 Google Scholar
J. Takayanagi et al.,
“ wavelength-tunable ultrashort-pulse generation using femtosecond Yb-doped fiber laser and photonic crystal fiber,”
IEEE Photon. Tech. Lett., 18
(21), 2284
–2286
(2006). http://dx.doi.org/10.1109/LPT.2006.884891 IPTLEL 1041-1135 Google Scholar
J. van Howe et al.,
“Demonstration of soliton self-frequency shift below 1300 nm in higher-order mode, solid silica-based fiber,”
Opt. Lett., 32
(4), 340
–342
(2007). http://dx.doi.org/10.1364/OL.32.000340 OPLEDP 0146-9592 Google Scholar
X. H. Fang et al.,
“An all-photonic-crystal-fiber wavelength-tunable source of high-energy sub-100 fs pulses,”
Opt. Commun., 289 123
–126
(2013). http://dx.doi.org/10.1016/j.optcom.2012.07.089 OPCOB8 0030-4018 Google Scholar
J. Lim et al.,
“3 GHz, watt-level femtosecond Raman soliton source,”
Opt. Lett., 39
(7), 2060
–2062
(2014). http://dx.doi.org/10.1364/OL.39.002060 OPLEDP 0146-9592 Google Scholar
Y. Yao, G. P. Agrawal and W. H. Knox,
“Yb:fiber laser-based, spectrally coherent and efficient generation of femtosecond pulses from a fiber with two zero-dispersion wavelengths,”
Opt. Lett., 40
(15), 3631
–3634
(2015). http://dx.doi.org/10.1364/OL.40.003631 OPLEDP 0146-9592 Google Scholar
H. Tu and S. A. Boppart,
“Optical frequency up-conversion by supercontinuum-free widely-tunable fiber-optic Cherenkov radiation,”
Opt. Express, 17
(12), 9858
–9872
(2009). http://dx.doi.org/10.1364/OE.17.009858 OPEXFF 1094-4087 Google Scholar
K. Wang and C. Xu,
“Tunable high-energy soliton pulse generation from a large-mode-area fiber and its application to third harmonic generation microscopy,”
Appl. Phys. Lett., 99
(7), 071112
(2011). http://dx.doi.org/10.1063/1.3628337 APPLAB 0003-6951 Google Scholar
K. Wang et al.,
“Three-color femtosecond source for simultaneous excitation of three fluorescent proteins in two-photon fluorescence microscopy,”
Biomed. Opt. Express, 3
(9), 1972
–1977
(2012). http://dx.doi.org/10.1364/BOE.3.001972 BOEICL 2156-7085 Google Scholar
O. Humbach et al.,
“Analysis of OH absorption bands in synthetic silica,”
J. Non-cryst. Solids, 203 19
–26
(1996). http://dx.doi.org/10.1016/0022-3093(96)00329-8 JNCSBJ 0022-3093 Google Scholar
M. C. Chan et al.,
“ tunable Raman soliton source based on a Cr:forsterite-laser and a photonic-crystal fiber,”
IEEE Photon. Technol. Lett., 20
(11), 900
–902
(2008). http://dx.doi.org/10.1109/LPT.2008.922339 IPTLEL 1041-1135 Google Scholar
T. Gottschall et al.,
“Four-wave-mixing-based optical parametric oscillator delivering energetic, tunable, chirped femtosecond pulses for non-linear biomedical applications,”
Opt. Express, 23
(18), 23968
–23977
(2015). http://dx.doi.org/10.1364/OE.23.023968 OPEXFF 1094-4087 Google Scholar
J. P. Gordon,
“Theory of the soliton self-frequency shift,”
Opt. Lett., 11
(10), 662
–664
(1986). http://dx.doi.org/10.1364/OL.11.000662 OPLEDP 0146-9592 Google Scholar
N. Linz et al.,
“Wavelength dependence of femtosecond laser-induced breakdown in water and implications for laser surgery,”
Phys. Rev. B, 94
(2), 024113
(2016). http://dx.doi.org/10.1103/PhysRevB.94.024113 Google Scholar
D. Débarre et al.,
“Mitigating phototoxicity during multiphoton microscopy of live Drosophila embryos in the wavelength range,”
PLoS One, 9
(8), e104250
(2014). http://dx.doi.org/10.1371/journal.pone.0104250 POLNCL 1932-6203 Google Scholar
K. Tajima,
“Compensation of soliton broadening in nonlinear optical fibers with loss,”
Opt. Lett., 12
(1), 54
–56
(1987). http://dx.doi.org/10.1364/OL.12.000054 OPLEDP 0146-9592 Google Scholar
BiographyTzu-Ming Liu received his BS degree in electrical engineering from National Taiwan University in 1999 and his PhD in photonics and optoelectronics from National Taiwan University in 2004. Throughout his postdoctoral research period between 2005 and 2009, he applied femtosecond laser techniques in the studies of phonon physics, nanophotonics, and embryo development. He was an assistant professor at the Institute of Biomedical Engineering, National Taiwan University since 2009. Currently, he is an associate professor at Faculty of Health Sciences, the University of Macau. |