
|
|
1.IntroductionThere has been significant recent interest in the development of technologies for detection and enumeration of circulating cells in the bloodstream in many of areas of preclinical small animal research. The term “in vivo flow cytometry” (IVFC) represents a promising set of technologies that uses either optical or photoacoustic detection of circulating cells directly in the peripheral blood, for example, in a small blood vessel in the ear of a mouse.1–4 IVFC is advantageous because it has been shown that technologies that rely on drawing, storing, and enriching blood samples may yield significant cell count errors and artifacts.5,6 Moreover, IVFC allows continuous measurement of circulating cell populations over time, rather than at discrete time points. Our group has specifically worked on the problem of rare circulating cell detection, which we define as fewer than of peripheral blood.7–9 Rare circulating cells are particularly important in the study of, for example, circulating tumor cell (CTC) dissemination in cancer metastasis, where clinically and preclinically significant concentrations are in the range of only 1 to .10 CTC enumeration is also widely needed in studying disease development or testing of new therapies. However, at such low concentrations, microscopy-based IVFC may require impractically long acquisition times to detect individual cells due to low blood flow rates in arterioles (1 to ). We have previously attempted to improve the sensitivity of IVFC by probing larger circulating blood volumes in bulk tissue using diffuse light.7,8 By probing the blood flowing through the vasculature in the tail or hindleg of a mouse, it is possible to sample several hundred microliters of peripheral blood per minute.11 This, in principle, allows optical sampling of the entire mouse peripheral blood volume in minutes.7,8 We termed this technology “diffuse fluorescence flow cytometry” (DFFC). We previously demonstrated that DFFC allowed detection of fluorescently labeled multiple myeloma (MM)7 and mesenchymal stem cells8 in nude mice in vivo. Despite this progress, our previous optical designs had a number of practical limitations: first, because fluorescent light was detected from multiple blood vessels in the mouse limb, we used a relatively complicated optical design with multiple light sources and detectors to localize moving cells.7 Second, the design was such that motion artifacts due to breathing of the mouse were a problem, which necessitated correction using a second detection wavelength and background subtraction.8 Third, the design used a transillumination geometry (where the laser and detectors were on opposite sides of the limb), which limited DFFC to physically small limbs of mice (on the order of a few millimeters in diameter). This precluded the use in larger animals such as rats or guinea pigs. As such, a major ongoing priority is the development of alternate DFFC designs to address these limitations. In this work, we designed a completely new diffuse reflectance fiber probe for detection of circulating cells in superficial peripheral blood vessels in vivo. Overall, this probe has significant advantages versus our previous work, including elimination of motion artifacts, markedly improved signal-to-noise ratios (SNRs), and the ability probe circulating blood in larger limbs and animal species. We demonstrate that this probe allowed us to enumerate microspheres in limb-mimicking optical flow phantoms, and MM cells in nude mice in vivo. We anticipate that this design could have significant application, for example, for preclinical study of CTCs in small animal models. 2.Methods and Materials2.1.Instrument DesignA diagram of the fiber-DFFC instrument is shown in Fig. 1(a). The specially designed optical bundle (EM-Vision LLC, Florida) consists of a central “excitation” and eight “collection” core diameter multimode optical fibers. The center-to-center separation for all fibers was . We noted previously that even small amounts of autofluorescence generated in optical fibers could obscure the weak signals from individual cells in vivo.7 Therefore, two micromachined filters were deposited directly on the fiber tip as shown: a 635-, 20-nm full-width at half-maximum (FWHM) bandpass for the excitation fiber, and an outer ring-shaped 650-nm long-pass filter for the collection fibers. The probe tip also had a 3-mm diameter ball lens to couple light from the sample into the fibers. The fiber probe was placed in firm contact with the surface of the sample, in this case either a phantom [Fig. 1(b)] or a mouse tail [Fig. 1(c)], so that measurements were taken in diffuse reflectance configuration. Fig. 1(a) Fiber-DFFC system schematic. The probe uses a central excitation () and eight collection fibers (), half of which are coupled to the PMT. The probe is placed in contact with the (b) flow phantom or (c) tail of a nude mouse.  The excitation source was a broadband super-continuum (SC) fiber laser (Koheras SuperK Power, NKT Photonics, Birkerod, Denmark) fitted with a beam splitter unit (SpectraK Split, NKT Photonics) and a 640-nm bandpass filter (10-nm FWHM, Chroma Technologies, Bellows Falls, Vermont). We note that we used the SC only as a broadband light source and did not use the pulsed properties of the laser output. The laser was coupled into the excitation fiber using an SMA-coupled achromatic lens package (F230 SMA-B; Thorlabs Inc., Newton, New Jersey) and the power at the sample was 9 mW. The eight collection fibers were divided into two bundles of four fibers (alternating around the probe so that the detected signal was approximately symmetrical), which were also terminated on SMA-coupled lens packages (F260 SMA-B; Thorlabs) to collimate the output light. One output arm was passed through a 690-nm emission filter (50-nm FWHM, Chroma) and focused onto a photomultiplier tube (PMT; H6780-20, Hamamatsu Photonics, Bridgewater, New Jersey) with a 25-mm focal length lens (Edmund Optics, Barrington, New Jersey). The second output arm was not used for these experiments but could be used in the future, for example, for multispectral experiments. The output of the PMT was amplified with a current preamplifier (SR570, Stanford Research Systems, Sunnyvale, California) configured with 100-Hz low-pass filter, and acquired with a data acquisition card (DAQ; NI-USB-6251, National Instrument, Austin, Texas). The DAQ was controlled using a custom script written in MATLAB (The Mathworks Inc., Natick, Massachusetts). 2.2.Validation in Optical Phantoms In VitroAs an initial test of the fiber-DFFC system, we used flow cytometry microspheres (red laser cell sorting beads, Catalog No. C16507, Life Technologies Co., Carlsbad, California) suspended in phosphate buffered saline (PBS) at low concentrations of either 100, 500, or ( samples for each). The microspheres mimic the size ( diameter) and fluorescence intensity of cells that are brightly labeled with a near-infrared dye. The microsphere solution was pumped through a 3-D printed optical phantom printed from VeroWhitePlus plastic (similar to ABS) on an Object30 printer (Stratasys Ltd., Billerica, Massachusetts). The exact optical and autofluorescence properties of the printed material are not known, but we and others have observed that these approximate that of biological tissue at near-infrared wavelengths.12 The phantom was 6 mm in diameter, 20 mm in length, with a 0.8-mm clear cylindrical channel centered 0.75 mm from the surface. We threaded a strand of internal diameter Tygon tubing (TGY-010-C, Small Parts, Inc., Seattle, Washington) through the channel and connected it to a syringe on a microsyringe pump (70-2209, Harvard Apparatus, Holliston, Massachusetts) configured to produce a flow speed of (). Microspheres were, therefore, flowing between 625 and from the surface, mimicking a superficial blood vessel. The fiber probe was placed in contact with the phantom, approximately above the tubing as shown in Fig. 1(b). To test the fiber-DFFC quantitative accuracy in phantoms, we also used a high-sensitivity fluorescence imaging system similar to what we have described previously.9 Briefly, the camera was an electron multiplied charge coupled device (EMCCD; iXonEM 885 Andor Technology, Belfast, Northern Ireland) camera fitted with a magnifying objective, lens tube (Mitutoyo Objective Edmund Optics, Barrington, New Jersey) and a 710-nm bandpass filter (Chroma). In combination, this yielded a image with a frame rate of . The bare tube was illuminated with a 660-nm diode laser (DPSS-660; Crystalaser Inc., Reno, Nevada). 2.3.Validation in Mice In VivoWe performed preliminary tests of fiber-DFFC in nude mice (Charles River Labs) with fluorescently labeled MM cells (Northwestern University, Chicago, Illinois). All mice were handled in accordance with Northeastern University’s Division of Laboratory Animal Medicine policies on animal care. MM cells were harvested using a cell scraper, spun down at 400 g, and then resuspended in Roswell Park Memorial Institute medium with 0.1% bovine serum albumin at a concentration of . Cells were dyed using a final concentration of of Vybrant-DiD (Thermofisher Scientific, Waltham, Massachusetts) and incubated for 20 min at 37°C. At the end of the incubation process, FBS was added (2% of total volume) to prevent cell clumping during centrifuging. Cells were centrifuged as before and washed once with PBS with FBS to remove any free DiD in suspension. Nude mice were retro-orbitally (r.o.) injected with of MM cells in suspension, at concentrations of either labeled , or labeled cells plus unlabeled . In both cases, cells were injected, but in the second case only 1 in 10 cells was labeled. The rationale was to produce similar clearance kinetics in both cases, since this is known to be dependent on the concentration of the injected cells. Moreover, we note that in practice most injected cells are cleared rapidly from circulation or lost at the site of injection, so that only a small fraction is in quasistable circulation.13 Approximately 5 to 10 min after injection, mice were scanned with the fiber-DFFC probe, which was placed in firm contact with the ventral surface of the mouse tail, approximately over the tail artery 3 cm from the tip, where the tail diameter was 3 mm. Mice were held under inhaled isofluorane and were kept on a warming pad throughout the experiments. 2.4.Data ProcessingAs we show, data generated by the instrument required only minimal processing. We first subtracted the background offset from the signal. In the in vivo case, it is generally not possible to perform a matched control (“blank”) measurement for subtraction, so we estimated the background directly from the measured signals as follows: we applied a 2.5-s median filter to the raw data, and then applied a moving average filter (“smooth” function in MATLAB) to smooth the result. We subtracted this estimated background from the raw data. We then applied a 0.1-s moving average filter to the background-subtracted signal. We note that this step was not necessary (particularly in phantoms) but decreased the standard deviation of the background and improved the overall SNR. We used MATLAB’s “findpeaks” function on the result to automatically identify fluorescent spikes from moving cells. 3.Results3.1.Optical Phantoms In VitroExample data acquired from the phantom is shown in Fig. 2. When PBS only was pumped through the tubing [Fig. 2(a)], approximately of background signal was detected, indicating that the phantom had a substantial autofluorescence background similar to that observed in our in vivo experiments (note that the PMT produces a negative output, so that the current values presented here were inverted for visualization). When spheres were pumped through the phantom, “spikes” were observed on top of this background, as shown in Fig. 2(b). Fig. 2Example data traces collected from the surface of an optical phantom (a) without and (b) with fluorescent microspheres. We performed signal processing as described in the text (c) and (d) and identified peaks (red circles). We also (e) imaged bare tubing with an EMCCD camera to obtain independent measurements of microsphere numbers. Dotted lines represent the approximate location of the tubing. Frames shown were separated by 250 ms. (f) The number of spheres counted with the fiber-DFFC and EMCCD systems in 5-min scans is shown, indicating excellent agreement between the methods.  We processed these data as described above, and the result is shown in Figs. 2(c) and 2(d). The “spikes” observed were similar to those in our previous work,7,8 and we interpret these to be the fluorescence signal generated as microspheres pass through the instrument field of view (FOV). Background subtraction and smoothing yielded an overall SNR improvement from to 40 dB. Here, SNR was defined as , where was the peak amplitude and is the background standard deviation. We also calculated the temporal width of the spikes, which on average had FWHM of 107 ms. Given that the flow speed was , we estimate that the fiber-DFFC instrument FOV was 0.5 mm. To test the quantitative accuracy of the system, we used the “findpeaks” function in MATLAB with a 30-nA threshold and determined the number of microspheres in 5-min traces for each sample [indicated with red circles in Fig. 2(d)]. We also used a fluorescence imager to directly visualize and manually count the microspheres in the Tygon tubing during the same intervals. An example image sequence is shown in Fig. 2(e), where each image is separated by 250 ms. The resulting microsphere count data obtained with the two methods are shown in Fig. 2(f), where each data point represents a separate 5-min scan. Based on the estimated concentrations of the microspheres and the flow rate, we expect 75, 37.5, and 7.5 spheres in 5 min for the three dilutions, respectively. Although we note that it is difficult to dilute spheres accurately at such low concentrations, these are in good general agreement with the average measured counts (, , and , respectively). Overall, these data demonstrate the count accuracy of the fiber-DFFC in flow phantoms. 3.2.Testing in Mice In VivoAn example 5-min processed data trace for an uninjected (control) mouse is shown in Fig. 3(a). The background autofluorescence signal varied between approximately and over the mice tested here, but after processing was very flat with a standard deviation of approximately only 5 nA. As noted above, motion artifacts due to the breathing motion of mice was a major problem in our previous work,8 but the fiber-DFFC design allowed us to completely remove this issue, simply by securing the sample (tail) to the platform and placing the fiber probe in firm contact with the surface [Fig. 1(c)]. This is a major advantage of the fiber DFFC probe, since it eliminated the need to correct for this artifact using a second background measurement and a weighted subtraction.8 Fig. 3Example 5-min data traces measured from (a) uninjected control mice, and mice injected with (b) or (c) fluorescently labeled MM cells. Red circles indicate detected peaks. An example spike is shown inset in (b). The distribution of peak (d) widths and (e) amplitudes is shown. The (f) normalized cell count as a function of time after injection is shown. 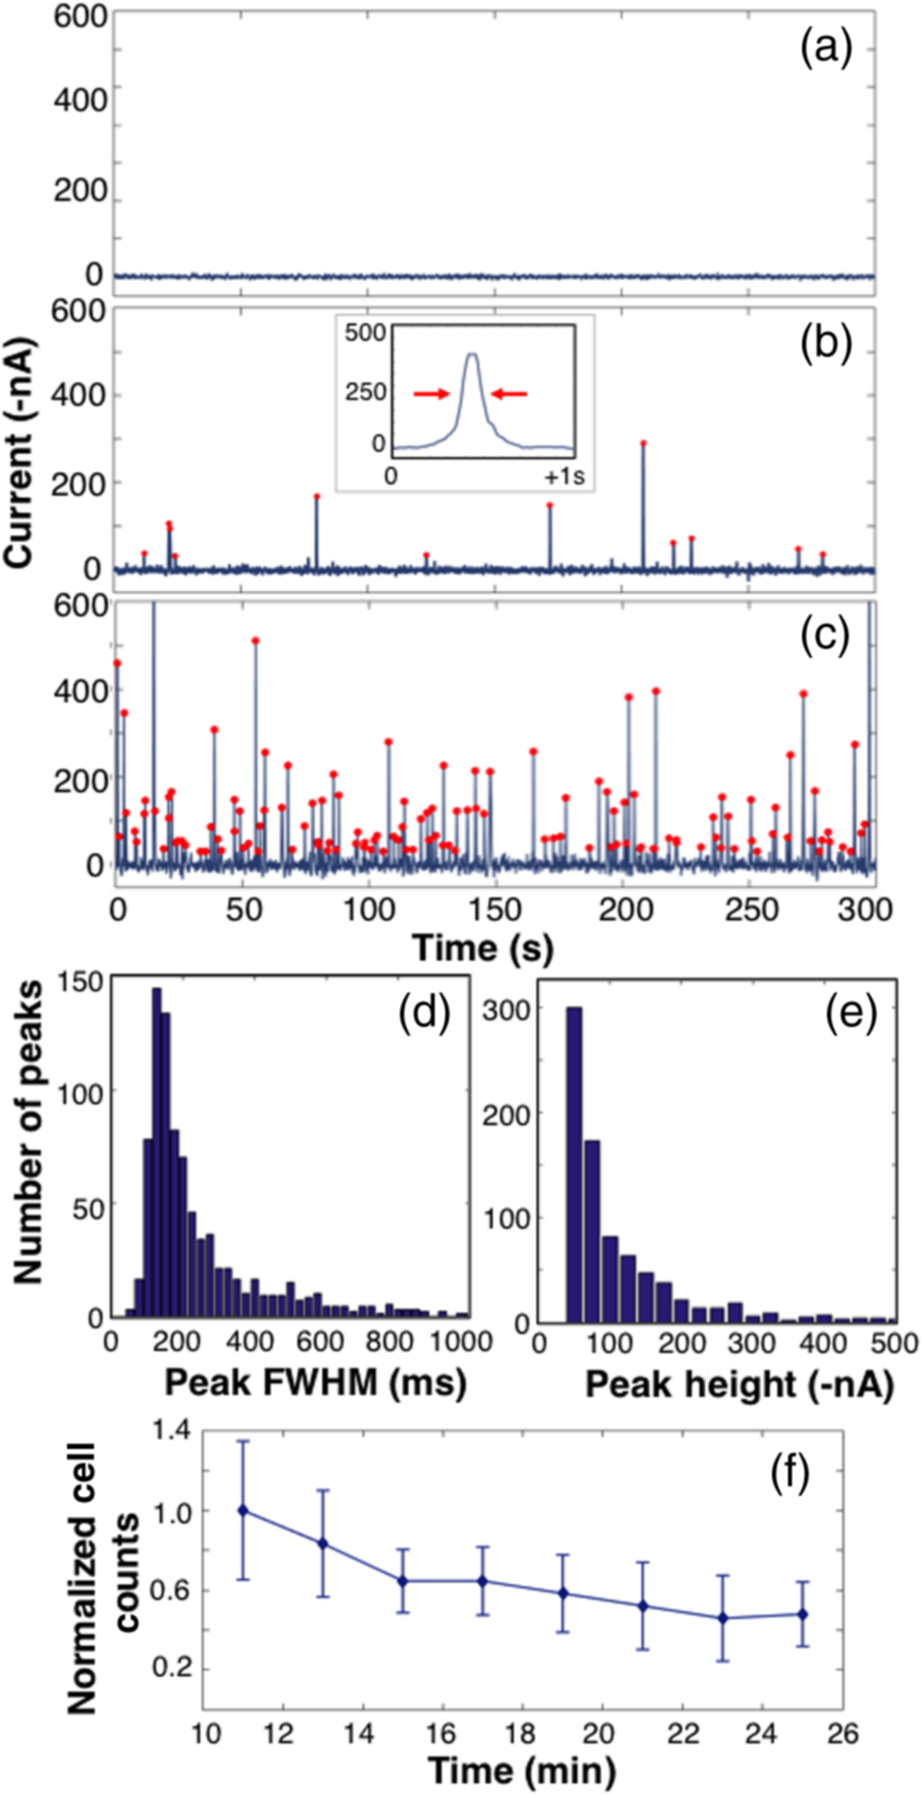 Data traces for mice injected with either or labeled MM cells are shown in Figs. 3(b) and 3(c). “Spikes” were again evident, which we interpret to be fluorescently labeled MM cells passing through the fiber-DFFC FOV as they moved along the artery. The distribution of the widths of the peaks is shown in the histogram in Fig. 3(d). Most were between 150 and 200 ms; given the 0.5-mm FOV, this implies an average linear flow speed of cells in the tail of 2.5 to , although individual cells moving at speeds between 1 and were observed. A literature search failed to provide a specific value for the blood flow rate in mice tail blood vessels, but the range of flow rates here is generally consistent with previously reported blood flow speeds in mice and our own work.7,14 Based on the background noise levels observed in the control animals, we set a peak detection threshold of 30 nA; this yielded a count rate of 24.5, 1.9, and in 15-min data traces for the , , and control mice, respectively, [peaks are indicated with red circles in Figs. 3(b) and 3(c)]. The histogram of the peak amplitudes (heights) of the data shown in Figs. 3(b) and 3(c) is shown in Fig. 3(e). The mean amplitude was approximately , which is equivalent to an SNR of 26.8 dB, where in mice was 5 nA. However, individual spikes with SNRs as high as 40 dB were observed, indicating the high quality of the data here relative to our previous DFFC designs in which SNRs of peaks in vivo were on average only 14 dB.7,8 While the mean and distribution of spike heights in Figs. 3(b) and 3(c) were similar, occasionally very large () spikes were observed at the higher concentration, which may have been due to more than one cell passing through the instrument FOV at the same time or simply a brightly labeled cell. Finally, the MM clearance kinetics of mice injected with labeled MM cells is shown in Fig. 3(f) in a 15-min period, starting 10 min after injection. Here, the count data are normalized to the 10-min time point, and the error bars represent the standard error observed in mice. As expected, MM cells cleared from circulation with approximately the same kinetics observed previously, with a half-life of .13 4.Discussion and ConclusionsIn summary, we developed and validated a fiber probe for diffuse reflectance detection of fluorescently labeled circulating cells in vivo. Although we used only a small number of animals for this proof-of-concept study, cells were clearly evident in vivo, and the count rate was approximately proportional to the injected cell concentration that was observed. Moreover, MM cells cleared from circulation during a 15-min interval with kinetics in agreement with previous findings, although we note that these are in general dependent on the mouse strain and injected concentration.13 It is important to emphasize that the signal from individual circulating cells is very weak, and could easily be masked by autofluorescence generated in the optical fibers. Therefore, careful selection of excitation and collection filters was absolutely critical for this problem. Otherwise, the fiber-DFFC design is relatively simple, but this is highly advantageous for DFFC because it essentially eliminates motion artifacts that were previously problematic,8 and also obviates the need to measure light transilluminated through the limb, which previously limited DFFC to mouse applications. In principle, this also opens up the possibility of using the probe for larger animals such as rats, guinea pigs, and even humans, although we have not yet tested this explicitly. According to our Monte Carlo simulations, the depth of collection with our design is within the first 1 mm of the surface (this result is consistent with other measurements in phantoms not shown here). This limits the current design to superficial vessels, which in principle could also include, for example, the femoral or saphenous vessels in the hindleg. This implies that the probe samples smaller circulating blood volumes and should, therefore, have lower overall cell detection sensitivity than our previous “open-optics” DFFC design.8 The probe geometry also yielded a significant reduction in noise (both due to motion and stray background light) so that, as we have noted, the SNR of detected spikes was significantly better. Moreover, we could increase the sampled blood volume simply by adding fiber probes. This is the subject of ongoing work, as well as better quantifying the sensitivity of this design relative to our previous one. We also anticipate that the robustness of this design will allow broader use of DFFC for preclinical research applications such as measurement of CTC dissemination in orthotopic tumor models in vivo. AcknowledgmentsThis work was funded by the National Institutes of Health (R01HL124315; NHLBI). We thank Eric Marple of EMVision LLC for helpful advice and discussion related to the fiber probe design. We thank Ms. Rebecca Sung for 3-D printing the optical phantom. ReferencesI. Georgakoudi et al.,
“In vivo flow cytometry: a new method for enumerating circulating cancer cells,”
Cancer Res., 64 5044
–5047
(2004). http://dx.doi.org/10.1158/0008-5472.CAN-04-1058 CNREA8 0008-5472 Google Scholar
M. A. Juratli et al.,
“Real-time monitoring of circulating tumor cell release during tumor manipulation using in vivo photoacoustic and fluorescent flow cytometry,”
Head Neck, 36 1207
–1215
(2014). http://dx.doi.org/10.1002/pro.v36.8 Google Scholar
Z. C. Fan et al.,
“Real-time monitoring of rare circulating hepatocellular carcinoma cells in an orthotopic model by in vivo flow cytometry assesses resection on metastasis,”
Cancer Res., 72 2683
–2691
(2012). http://dx.doi.org/10.1158/0008-5472.CAN-11-3733 CNREA8 0008-5472 Google Scholar
D. Hwu et al.,
“Assessment of the role of circulating breast cancer cells in tumor formation and metastatic potential using in vivo flow cytometry,”
J. Biomed. Opt., 16 040501
(2011). http://dx.doi.org/10.1117/1.3560624 JBOPFO 1083-3668 Google Scholar
B. Weigelt, J. L. Peterse and L. J. van ‘t Veer,
“Breast cancer metastasis: markers and models,”
Nat. Rev. Cancer, 5 591
–602
(2005). http://dx.doi.org/10.1038/nrc1670 NRCAC4 1474-175X Google Scholar
J. Hoff,
“Methods of blood collection in the mouse,”
Lab Animal, 29 49
–53
(2000). Google Scholar
E. Zettergren et al.,
“Instrument for fluorescence sensing of circulating cells with diffuse light in mice in vivo,”
J. Biomed. Opt., 17 037001
(2012). http://dx.doi.org/10.1117/1.JBO.17.3.037001 JBOPFO 1083-3668 Google Scholar
N. Pestana et al.,
“Improved diffuse fluorescence flow cytometer prototype for high sensitivity detection of rare circulating cells in vivo,”
J. Biomed. Opt., 18 077002
(2013). http://dx.doi.org/10.1117/1.JBO.18.7.077002 JBOPFO 1083-3668 Google Scholar
S. Markovic et al.,
“A computer vision approach to rare cell in vivo fluorescence flow cytometry,”
Cytometry A, 83 1113
–1123
(2013). http://dx.doi.org/10.1002/cyto.a.v83.12 Google Scholar
C. Alix-Panabieres and K. Pantel,
“Circulating tumor cells: liquid biopsy of cancer,”
Clin. Chem., 59 110
–118
(2013). http://dx.doi.org/10.1373/clinchem.2012.194258 Google Scholar
S. Wagner et al.,
“Time-of-flight quantitative measurements of blood flow in mouse hindlimbs,”
J. Magn. Reson. Imaging, 19 468
–474
(2004). http://dx.doi.org/10.1002/(ISSN)1522-2586 Google Scholar
P. Diep et al.,
“Three-dimensional printed optical phantoms with customized absorption and scattering properties,”
Biomed. Opt. Express, 6 4212
–4220
(2015). http://dx.doi.org/10.1364/BOE.6.004212 BOEICL 2156-7085 Google Scholar
J. M. Runnels et al.,
“Optical techniques for tracking multiple myeloma engraftment, growth, and response to therapy,”
J. Biomed. Opt., 16 011006
(2011). http://dx.doi.org/10.1117/1.3520571 JBOPFO 1083-3668 Google Scholar
V. P. Zharov et al.,
“In vivo photoacoustic flow cytometry for monitoring of circulating single cancer cells and contrast agents,”
Opt. Lett., 31 3623
–3625
(2006). http://dx.doi.org/10.1364/OL.31.003623 OPLEDP 0146-9592 Google Scholar
BiographyVivian Pera received her PhD from Northeastern University in 2015. She is a postdoctoral fellow in the Department of Biomedical Engineering at Boston University. Xuefei Tan received her BS degree from Nankai University, China, in 2010. She is currently a PhD candidate in the Department of Electrical and Computer Engineering at Northeastern University and a member of the Biomedical Optics Research Laboratory. |


